EXHIBIT 99.2
Published on February 28, 2019

INVESTOR PRESENTATION Q2 FY2019

DISCLAIMER This presentation includes forward-looking statements. All statements contained in this presentation other than statements of historical facts, including statements regarding our future results of operations and financial position, our business strategy and plans and our objectives for future operations, are forward-looking statements. The words “anticipate,” believe,” “continue,” “estimate,” “expect,” “intend,” “may,” “will” and similar expressions are intended to identify forward-looking statements. Such forward-looking statements include, but are not limited to, the statements regarding our projected financial performance for our third fiscal quarter and full-fiscal year 2019. Forward-looking statements involve known and unknown risks, uncertainties and other factors that could cause actual results to differ materially from the results anticipated by these forward-looking statements, including, but not limited to: our ability to sustain our revenue growth rate in the future; our ability to retain existing clients and attract new clients, including our ability to increase revenue from existing clients and diversify our revenue concentration; our ability to attract and retain highly-skilled IT professionals at cost-effective rates; our ability to penetrate new industry verticals and geographies and grow our revenue in current industry verticals and geographies; our ability to maintain favorable pricing and utilization rates; our ability to successfully identify acquisition targets, consummate acquisitions and successfully integrate acquired businesses and personnel; the effects of increased competition as well as innovations by new and existing competitors in our market; the size of our addressable market and market trends; our ability to adapt to technological change and innovate solutions for our clients; our plans for growth and future operations, including our ability to manage our growth; our expectations of future operating results or financial performance; our ability to effectively manage our international operations, including our exposure to foreign currency exchange rate fluctuations; and our future financial performance, including trends in revenue, cost of sales, gross profit, selling, general and administrative expenses, finance income and expense and taxes, as well as other risks and uncertainties discussed in the “Risk Factors” section of our Annual Report on Form 20-F filed with the Securities and Exchange Commission on October 11, 2018. Except as required by law, we assume no duty to update any of these forward-looking statements after the date of this presentation to conform these statements to actual results or revised expectations, except as required by law. You should, therefore, not rely on these forward-looking statements as representing our views as of any date subsequent to the date of this presentation. Moreover, except as required by law, neither we nor any other person assumes responsibility for the accuracy and completeness of the forward-looking statements contained in this presentation. This presentation also contains estimates and other statistical data made by independent parties and by us relating to market size and growth and other data about our industry. This data involves a number of assumptions and limitations, and you are cautioned not to give undue weight to such estimates. Neither we nor any other person makes any representation as to the accuracy or completeness of such data or undertakes any obligation to update such data after the date of this presentation. In addition, projections, assumptions and estimates of our future performance and the future performance of the markets in which we operate are necessarily subject to a high degree of uncertainty and risk. By attending or receiving this presentation you acknowledge that you will be solely responsible for your own assessment of the market and our market position and that you will conduct your own analysis and be solely responsible for forming your own view of the potential future performance of our business. This presentation includes non-IFRS financial measures which have certain limitations and should not be considered in isolation, or as alternatives to or substitutes for, financial measures determined in accordance with IFRS. The non-IFRS measures as defined by us may not be comparable to similar non-IFRS measures presented by other companies. Our presentation of such measures, which may include adjustments to exclude unusual or non-recurring items, should not be construed as an inference that our future results will be unaffected by these or other unusual or non-recurring items. See the IFRS to Non- IFRS Reconciliation section for a reconciliation of these non-IFRS financial measures to the most directly comparable IFRS financial measures. 2
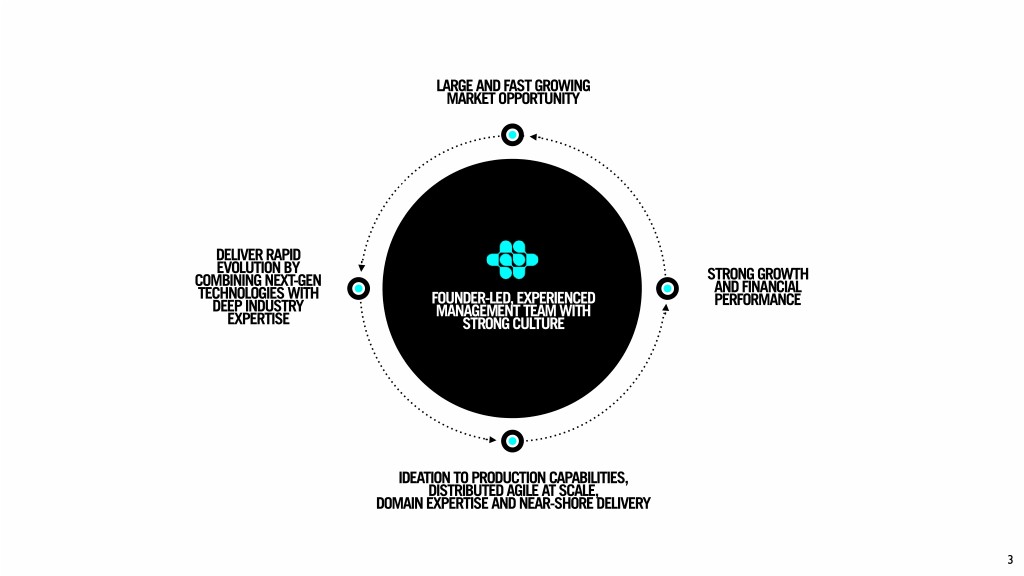
LARGE AND FAST GROWING MARKET OPPORTUNITY DELIVER RAPID EVOLUTION BY STRONG GROWTH COMBINING NEXT-GEN AND FINANCIAL TECHNOLOGIES WITH FOUNDER-LED, EXPERIENCED PERFORMANCE DEEP INDUSTRY MANAGEMENT TEAM WITH EXPERTISE STRONG CULTURE IDEATION TO PRODUCTION CAPABILITIES, DISTRIBUTED AGILE AT SCALE, DOMAIN EXPERTISE AND NEAR-SHORE DELIVERY 3
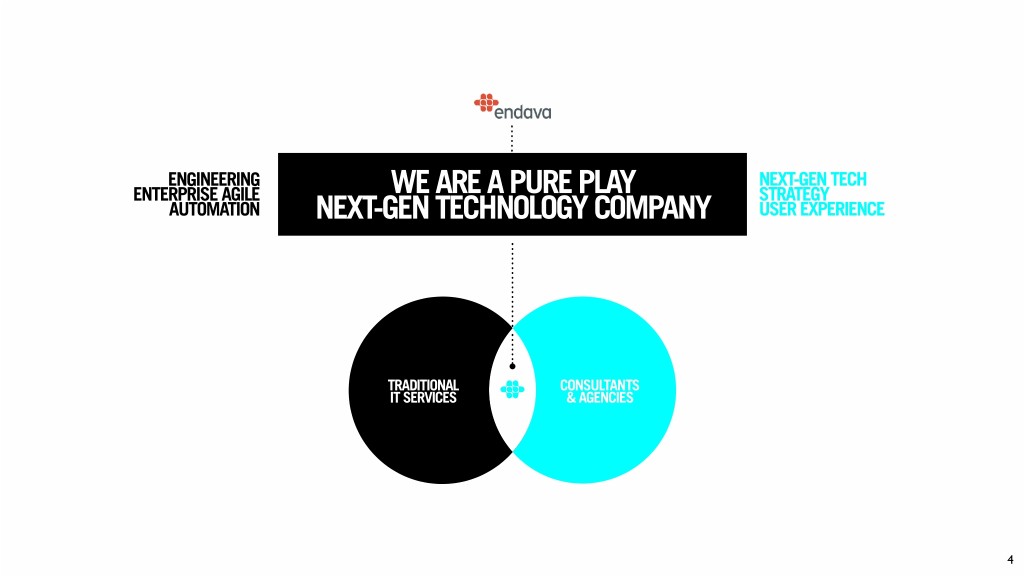
ENGINEERING NEXT-GEN TECH ENTERPRISE AGILE WE ARE A PURE PLAY STRATEGY AUTOMATION NEXT-GEN TECHNOLOGY COMPANY USER EXPERIENCE TRADITIONAL CONSULTANTS IT SERVICES & AGENCIES 4
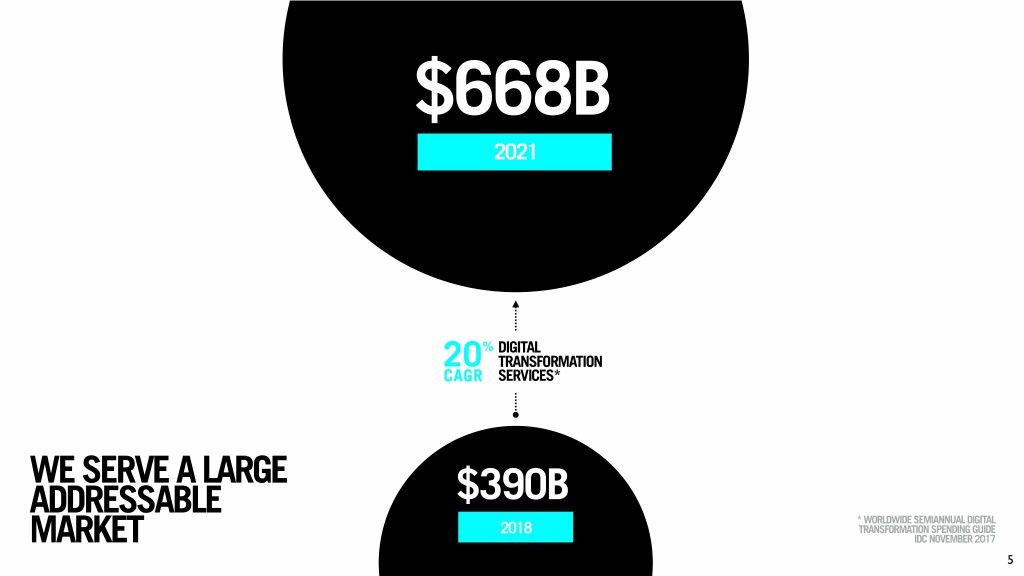
$668B 2021 % DIGITAL 20 TRANSFORMATION CAGR SERVICES* WE SERVE A LARGE ADDRESSABLE $390B * WORLDWIDE SEMIANNUAL DIGITAL 2018 TRANSFORMATION SPENDING GUIDE MARKET IDC NOVEMBER 2017 5
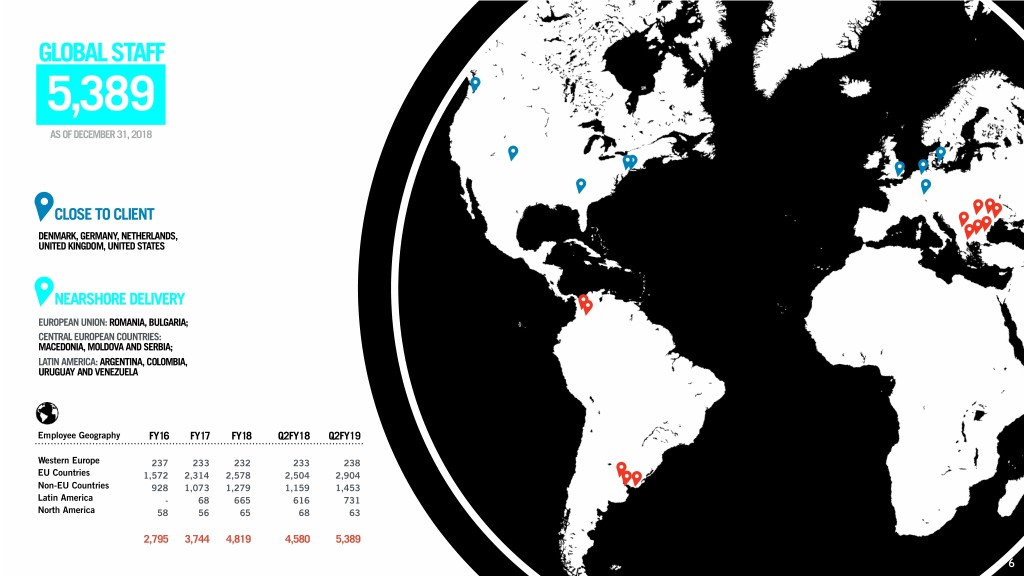
GLOBAL STAFF 5,3 89 AS OF DECEMBER 31, 2018 CLOSE TO CLIENT DENMARK, GERMANY, NETHERLANDS, UNITED KINGDOM, UNITED STATES NEARSHORE DELIVERY EUROPEAN UNION: ROMANIA, BULGARIA;
CENTRAL EUROPEAN COUNTRIES: MACEDONIA, MOLDOVA AND SERBIA;
LATIN AMERICA: ARGENTINA, COLOMBIA, URUGUAY AND VENEZUELA Employee Geography FY16 FY17 FY18 Q2FY18 Q2FY19 Western Europe 237 233 232 233 238 EU Countries 1,572 2,314 2,578 2,504 2,904 Non-EU Countries 928 1,073 1,279 1,159 1,453 Latin America - 68 665 616 731 North America 58 56 65 68 63 2,795 3,744 4,819 4,580 5,389 6
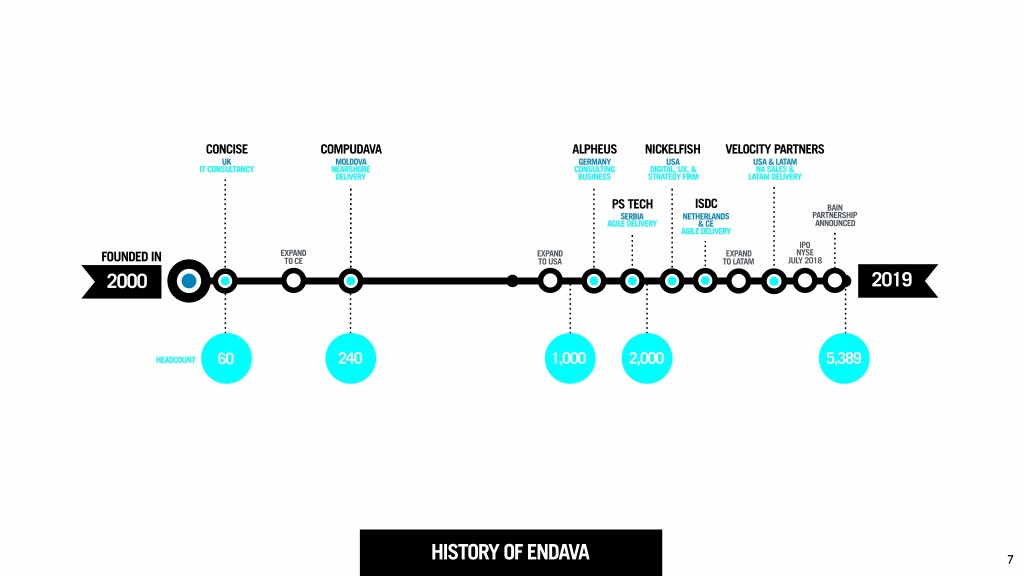
CONCISE COMPUDAVA ALPHEUS NICKELFISH VELOCITY PARTNERS UK MOLDOVA
GERMANY
USA
USA & LATAM
IT CONSULTANCY NEARSHORE
CONSULTING DIGITAL, UX, & NA SALES & DELIVERY BUSINESS STRATEGY FIRM LATAM DELIVERY PS TECH ISDC BAIN SERBIA
NETHERLANDS
PARTNERSHIP AGILE DELIVERY & CE
ANNOUNCED AGILE DELIVERY IPO EXPAND
EXPAND
EXPAND
NYSE FOUNDED IN TO CE TO USA TO LATAM JULY 2018 2000 2019 HEADCOUNT 60 240 1,000 2,000 5,389 HISTORY OF ENDAVA 7
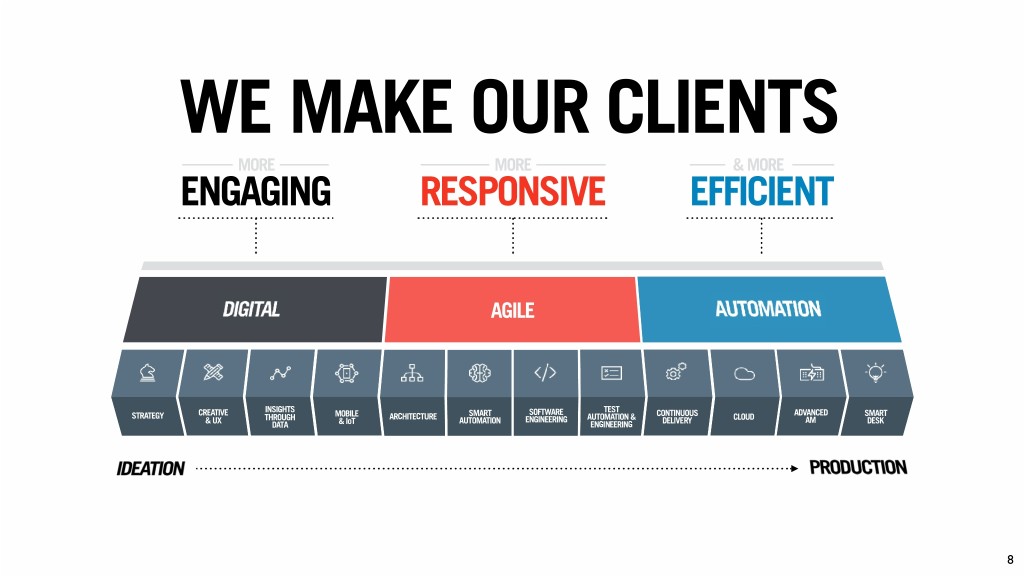
WE MAKE OUR CLIENTS MORE MORE & MORE ENGAGING RESPONSIVE EFFICIENT AGILE BUSINESS AUTOMATION DIGITAL
CREATIVE INSIGHTS MOBILEDIGITAL
DISTRIBUTEDSMART
SOFTWARE
TESTINGTEST CONTINUOUS APPLICATIONSADVANCED
SERVICESMART
STRATEGY THROUGH EXECUTION ARCHITECTURE AGILE DEV ENGINEERING AUTOMATIONSERVICES & CD & DEVOPS CLOUD MANAGEMENTAM & UX DATA & IoT AUTOMATION ENGINEERING DELIVERY DESK 8
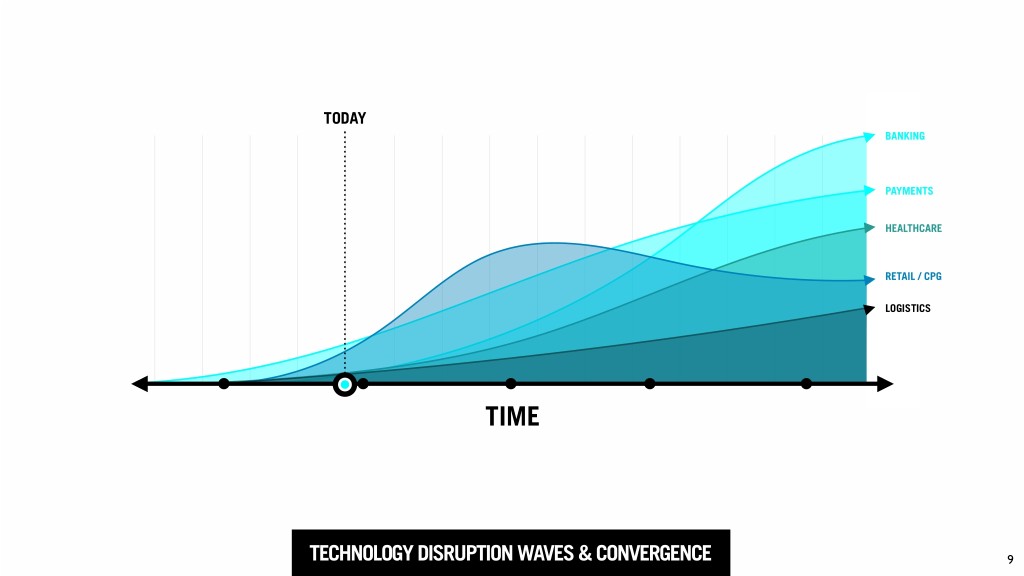
TODAY BANKING PAYMENTS HEALTHCARE RETAIL / CPG LOGISTICS TIME TECHNOLOGY DISRUPTION WAVES & CONVERGENCE 9

SCALABILITY BRAND CULTURE M&A AS WE STRIVE TO BE THE TO SUPPORT THIS GROWTH, WE WE USE TUCK-IN ACQUISITIONS TO ASPIRATIONAL BRAND FOR IT NEED LEADERSHIP AND HAVE ACCELERATE OUR GROWTH PROFESSIONALS IN THE DEVELOPED THE ‘PASS IT ON’ STRATEGY - TO EITHER ESTABLISH REGIONS IN WHICH WE INITIATIVE WHICH DRIVES OURSELVES IN A NEW GEO OR TO OPERATE, WE ATTRACT HIGH LOYALTY AND LOWERS ESTABLISH A NEW AREA OF QUALITY TALENT. ATTRITION. EXPERTISE AND MARKET GROWTH. 10

FINANCIALS 11

FINANCIAL HIGHLIGHTS MASTER SERVICE AGREEMENTS WITH CLIENTS PRIMARILY T&M BASED PRICING LONG-TERM CLIENT RELATIONSHIPS STRONG REVENUE GROWTH HEALTHY MARGINS LOW CAPEX REQUIREMENTS POSITIVE FREE CASH FLOW 12
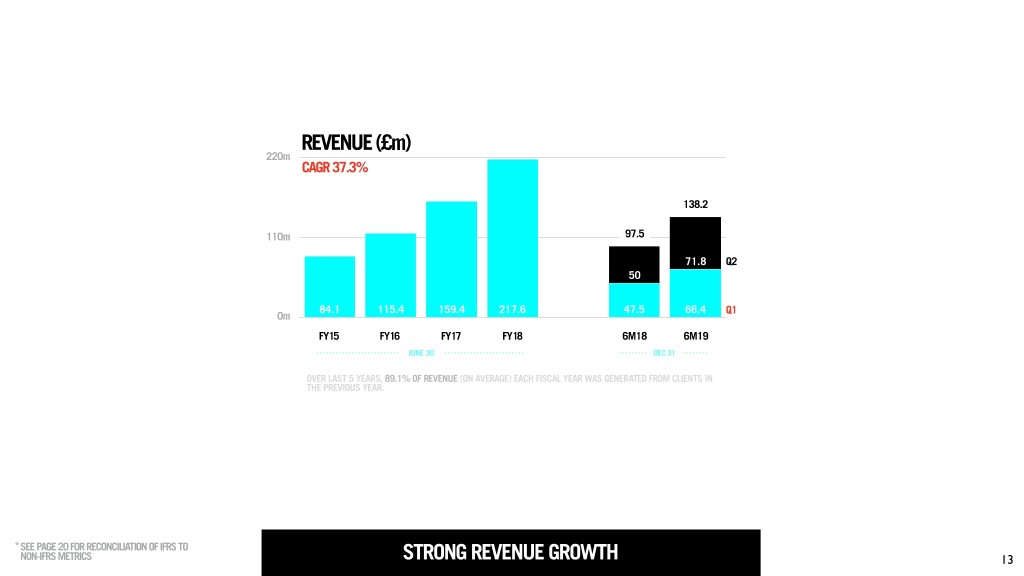
REVENUE (£m) 220m CAGR 37.3% 138.2 110m 97.5 71.8 Q2 50 84.1 115.4 159.4 217.6 47.5 66.4 Q1 0m FY15 FY16 FY17 FY17 _ 6m18 6m19 FY15 FY16 FY17 FY18 6M18 6M19 JUNE 30 DEC 31 OVER LAST 5 YEARS, 89.1% OF REVENUE (ON AVERAGE) EACH FISCAL YEAR WAS GENERATED FROM CLIENTS IN THE PREVIOUS YEAR. *SEE PAGE 20 FOR RECONCILIATION OF IFRS TO NON-IFRS METRICS STRONG REVENUE GROWTH 13
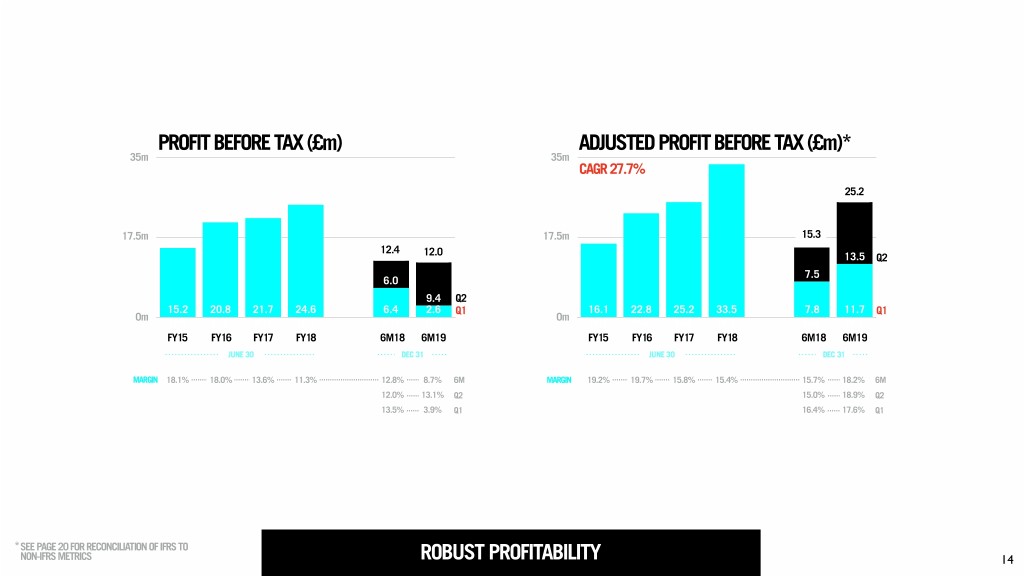
PROFIT BEFORE TAX (£m) ADJUSTED PROFIT BEFORE TAX (£m)* 35m 35m CAGR 27.7% 25.2 17.5m 17.5m 15.3 12.4 12.0 13.5 Q2 7.5 6.0 9.4 Q2 15.2 20.8 21.7 24.6 6.4 2.6 Q1 16.1 22.8 25.2 33.5 7.8 11.7 Q1 0m 0m FY15 FY16 FY17 FY18 _ FY17 FY18 FY15 FY16 FY17 FY18 _ FY17 FY18 FY15 FY16 FY17 FY18 6M18 6M19 FY15 FY16 FY17 FY18 6M18 6M19 JUNE 30 DEC 31 JUNE 30 DEC 31 MARGIN 18.1% 18.0% 13.6% 11.3% 12.8% 8.7% 6M MARGIN 19.2% 19.7% 15.8% 15.4% 15.7% 18.2% 6M 12.0% 13.1% Q2 15.0% 18.9% Q2 13.5% 3.9% Q1 16.4% 17.6% Q1 *SEE PAGE 20 FOR RECONCILIATION OF IFRS TO NON-IFRS METRICS ROBUST PROFITABILITY 14
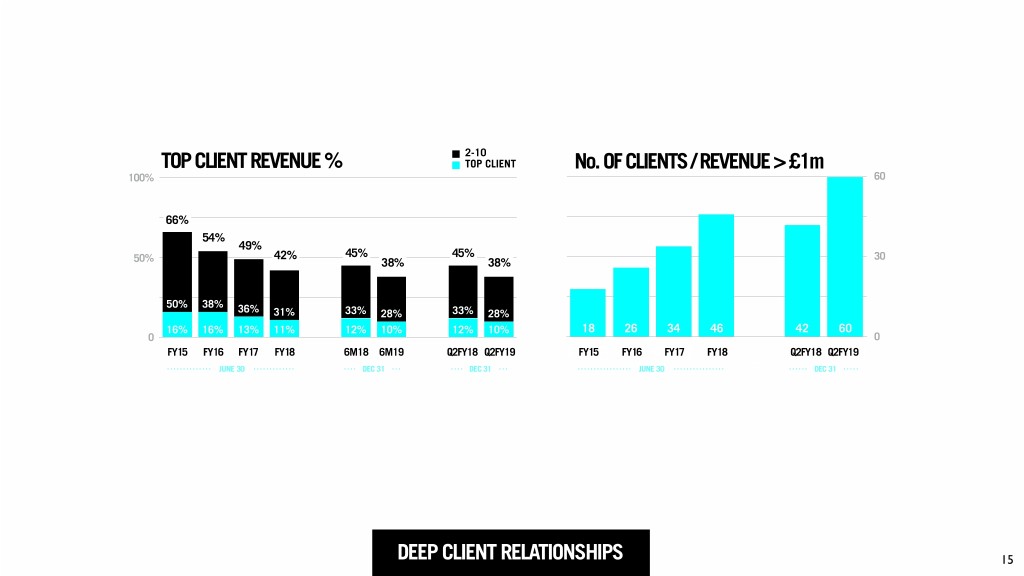
2-10 TOP CLIENT REVENUE % TOP CLIENT No. OF CLIENTS / REVENUE > £1m 100% 60 66% 54% 49% 42% 45% 45% 30 50% 38% 38% 50% 38% 36% 31% 33% 28% 33% 28% 16% 16% 13% 11% 12% 10% 12% 10% 18 26 34 46 42 60 0 0 FY15 FY16 FY17 FY17 _ FY17 FY18 - q218 q219 FY15 FY16 FY17 FY18 6M18 6M19 Q2FY18 Q2FY19 FY15FY15 FY16 FY17FY17 FY18 _ Q2FY18 FY18Q2FY19 JUNE 30 DEC 31 DEC 31 JUNE 30 DEC 31 DEEP CLIENT RELATIONSHIPS 15

AVERAGE SPEND: AVERAGE SPEND: TOTAL No. OF CLIENTS TOP 10 CLIENTS (£000s) REMAINING CLIENTS (£000s) 300 9,0009000 600 6750 150 4,5004500 300 2250 112 154 188 258 197 271 5,510 6,200 7,820 9,040 4,407 5,246 2,240 2,730 284 434 504 597 360 456 209 263 0 00 0 FY15 FY16 FY17 FY17 _ FY17 FY18 FY15 FY16 FY17 FY18 _ FY17 FY18 - Q218 Q219 FY15 FY16 FY17 FY18 _ FY17 FY18 - Q218 Q219 2015 2016 2017 2018 Q2FY18 Q2FY19 FY15 FY16 FY17 FY18 6M18 6M19 Q2FY18 Q2FY19 FY15 FY16 FY17 FY18 6M18 6M19 Q2FY18 Q2FY19 AS OF JUNE 30, AS OF DEC 31, JUNE 30 DEC 31 DEC 31 JUNE 30 DEC 31 DEC 31 INCREASING NUMBER & SPEND OF CLIENTS 16

N.AMERICA EUROPE REVENUE % BY REGION UK 100% 20% 10% 15% 18% 16% 12% 21% 27% 18% 27% Q2 FY2019 34% 50% 34% 37% 28% REVENUE % BY VERTICAL 53% 78% 64% 50% 45% 48% 45% 0% FY15 FY16 FY17 FY17 _ FY17 FY18 PAYMENTS AND FINANCIAL SERVICES FY15 FY16 FY17 FY18 Q2FY18 Q2FY19 TECHNOLOGY, MEDIA, & TELECOMMUNICATIONS JUNE 30 DEC 31 OTHER* *OTHER INCLUDES CONSUMER PRODUCTS,
HEALTHCARE, LOGISTICS AND RETAIL VERTICALS DIVERSE REVENUE BASE: GEOGRAPHY & INDUSTRY VERTICALS 17
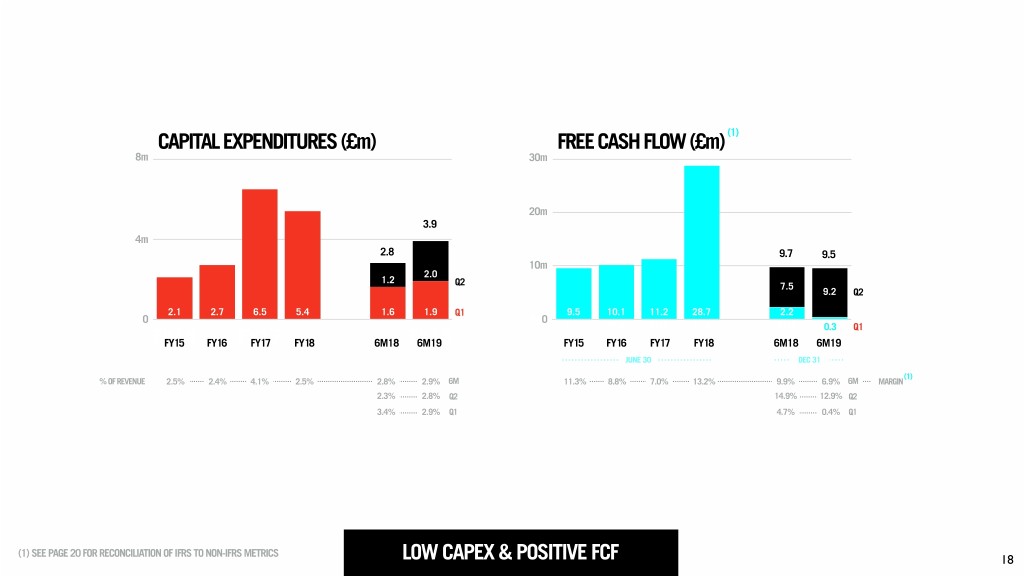
CAPITAL EXPENDITURES (£m) FREE CASH FLOW (£m) (1) 8m 30.0030m 20.0020m 3.9 4m 2.8 9.7 9.5 10.0010m 2.0 1.2 Q2 7.5 9.2 Q2 2.1 2.7 6.5 5.4 1.6 1.9 Q1 9.5 10.1 11.2 28.7 2.2 0.3 0 0.000 FY15 FY16 FY17 FY18 _ FY17 FY180.3 Q1 FY15FY15 FY16 FY17FY17 FY18 _ 6M18 FY186M19 FY15 FY16 FY17 FY18 6M18 6M19 JUNE 30 DEC 31 (1) % OF REVENUE 2.5% 2.4% 4.1% 2.5% 2.8% 2.9% 6M 11.3% 8.8% 7.0% 13.2% 9.9% 6.9% 6M MARGIN 2.3% 2.8% Q2 14.9% 12.9% Q2 3.4% 2.9% Q1 4.7% 0.4% Q1 (1) SEE PAGE 20 FOR RECONCILIATION OF IFRS TO NON-IFRS METRICS LOW CAPEX & POSITIVE FCF 18

APPENDIX 19
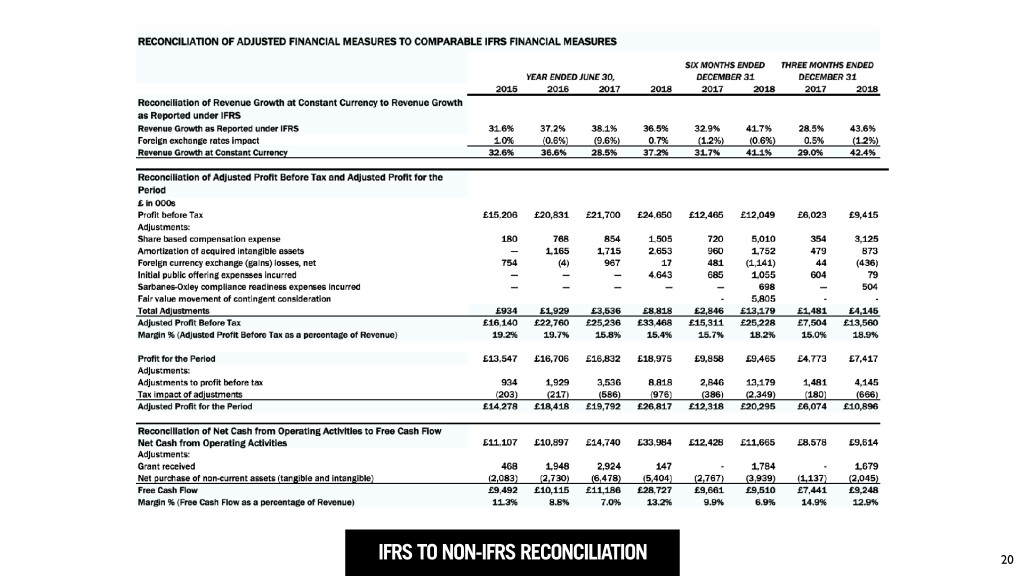
IFRS TO NON-IFRS RECONCILIATION 20

21