20-F: Annual and transition report of foreign private issuers pursuant to Section 13 or 15(d)
Published on September 15, 2020
UNITED STATES
SECURITIES AND EXCHANGE COMMISSION
WASHINGTON, D.C. 20549
______________________________________________________
Form 20-F
______________________________________________________
(Mark One)
¨ REGISTRATION STATEMENT PURSUANT TO SECTION 12(b) OR (g) OF THE SECURITIES EXCHANGE ACT OF 1934
OR
x ANNUAL REPORT PURSUANT TO SECTION 13 OR 15(d) OF THE SECURITIES ACT OF 1934
For the fiscal year ended June 30, 2020
OR
¨ TRANSITION REPORT PURSUANT TO SECTION 13 OR 15(d) OF THE SECURITIES EXCHANGE ACT OF 1934
OR
¨ SHELL COMPANY REPORT PURSUANT TO SECTION 13 OR 15(d) OF THE SECURITIES EXCHANGE ACT OF 1934
Date of event requiring this shell company report
Commission file number 001-38607
________________________________________________________________________________________________________________________________________________________________________________________________
ENDAVA PLC
(Exact name of Registrant as specified in its charter
and translation of Registrant’s name into English)
________________________________________________________________________________________________________________________________________________________________________________________________
England and Wales |
(Jurisdiction of Incorporation or Organization) |
|
125 Old Broad Street,
London EC2N 1AR
|
(Address of principal executive offices) |
|
John Cotterell
Chief Executive Officer
Endava PLC
125 Old Broad Street,
London EC2N 1AR
Tel: +44 20 7367 1000
Email: investors@endava.com
|
(Name, Telephone, E-mail and/or Facsimile number and Address of Company Contact Person) |
Securities registered or to be registered pursuant to Section 12(b) of the Act.
Title of each class |
Trading Symbol(s) |
Name of each exchange on which registered |
||
American Depositary Shares, each representing the right to receive one Class A ordinary share, nominal value £0.02 per share
|
DAVA |
New York Stock Exchange |
||
Class A ordinary shares, nominal value £0.02 per share*
|
New York Stock Exchange |
|||
* |
Not for trading, but only in connection with the registration of the American Depositary Shares. |
Securities registered or to be registered pursuant to Section 12(g) of the Act. None
Securities for which there is a reporting obligation pursuant to Section 15(d) of the Act. None
Indicate the number of outstanding shares of each of the issuer’s classes of capital or common stock as of the close of the period covered by the annual report.
Ordinary shares, nominal value £0.02 per ordinary share: 54,928,169, as of June 30, 2020. As of June 30, 2020, 28,823,893 Class A ordinary shares, 20,455,733 Class B ordinary shares and 5,648,543 Class C ordinary shares were outstanding.
Indicate by check mark if the registrant is a well-known seasoned issuer, as defined in Rule 405 of the Securities Act. | ||||||
x Yes
|
¨ No
|
|||||
If this report is an annual or transition report, indicate by check mark if the registrant is not required to file reports pursuant to Section 13 or 15(d) of the Securities Exchange Act of 1934. | ||||||
¨ Yes
|
x No
|
|||||
Note – Checking the box above will not relieve any registrant required to file reports pursuant to Section 13 or 15(d) of the Securities Exchange Act of 1934 from their obligations under those Sections. | ||||||
Indicate by check mark whether the registrant (1) has filed all reports required to be filed by Section 13 or 15(d) of the Securities Exchange Act of 1934 during the preceding 12 months (or for such shorter period that the registrant was required to file such reports), and (2) has been subject to such filing requirements for the past 90 days. | ||||||
x Yes
|
¨ No
|
|||||
Indicate by check mark whether the registrant has submitted electronically every Interactive Data File required to be submitted pursuant to Rule 405 of Regulation S-T (§232.405 of this chapter) during the preceding 12 months (or for such shorter period that the registrant was required to submit such files). | ||||||
x Yes
|
¨ No
|
|||||
Indicate by check mark whether the registrant is a large accelerated filer, an accelerated filer, a non-accelerated filer, or an emerging growth company. See definition of “large accelerated filer,” “accelerated filer,” and "emerging growth company" in Rule 12b-2 of the Exchange Act. | ||||||
Large accelerated filer x
|
Accelerated filer ¨
|
Non-accelerated filer ¨
|
Emerging growth company ¨
|
|||
If an emerging growth company that prepares its financial statements in accordance with U.S. GAAP, indicate by check mark if the registrant has elected not to use the extended transition period for complying with any new or revised financial accounting standards† provided pursuant to Section 13(a) of the Exchange Act. ¨
| ||||||
† The term “new or revised financial accounting standard” refers to any update issued by the Financial Accounting Standards Board to its Accounting Standards Codification after April 5, 2012. | ||||||
Indicate by check mark whether the registrant has filed a report on and attestation to its management’s assessment of the effectiveness of its internal control over financial reporting under Section 404(b) of the Sarbanes-Oxley Act (15 U.S.C. 7262(b)) by the registered public accounting firm that prepared or issued its audit report. x
| ||||||
Indicate by check mark which basis of accounting the registrant has used to prepare the financial statements included in this filing: | ||||||
U.S. GAAP ¨
|
International Financial Reporting Standards as issued by the International Financial Reporting Standards Board x
|
Other ¨
|
||||
If “Other” has been checked in response to the previous question, indicate by check mark which financial statement item the registrant has elected to follow. | ||||||
Item 17 ¨
|
Item 18 ¨
|
|||||
If this is an annual report, indicate by check mark whether the registrant is a shell company (as defined in Rule 12b-2 of the Exchange Act). | ||||||
¨ Yes
|
x No
|
|||||
TABLE OF CONTENTS
i
ii
CERTAIN DEFINED TERMS AND PRESENTATION OF FINANCIAL INFORMATION
Unless otherwise indicated or the context otherwise requires, all references in this Annual Report on Form 20-F to the terms “Endava,” “Endava Limited,” “Endava plc,” the “Group,” the “Company,” “we,” “us,” and “our” refer to (i) Endava Limited and our wholly-owned subsidiaries for all periods prior to the completion of our corporate reorganization and (ii) Endava plc and our wholly-owned subsidiaries for all periods after the re-registration of Endava Limited as a public limited company. On July 6, 2018, we re-registered Endava Limited as a public limited company and our name was changed from Endava Limited to Endava plc.
Our fiscal year ends on June 30. Our audited consolidated financial statements have been prepared in accordance with International Financial Reporting Standards, or IFRS, as issued by the International Accounting Standards Board, or IASB. None of our financial statements were prepared in accordance with generally accepted accounting principles in the United States, or U.S. GAAP.
Our financial information is presented in British Pounds. For the convenience of the reader, in this Annual Report on Form 20-F, unless otherwise indicated, translations from British Pounds into U.S. dollars were made at the rate of £1.00 to 1.2303, which was the rate in effect on June 30, 2020. Such U.S. dollar amounts are not necessarily indicative of the amounts of U.S. dollars that could actually have been purchased upon exchange of British Pounds at the dates indicated. All references in this Annual Report on Form 20-F to “$” mean U.S. dollars and all references to “£” and “GBP” mean British Pounds.
We have made rounding adjustments to some of the figures included in this Annual Report on Form 20-F. Accordingly, numerical figures shown as totals in some tables may not be an arithmetic aggregation of the figures that preceded them.
iii
CAUTIONARY STATEMENT REGARDING FORWARD-LOOKING STATEMENTS
This Annual Report on Form 20-F contains statements that constitute forward-looking statements. Many of the forward-looking statements contained in this Annual Report on Form 20-F can be identified by the use of forward-looking words such as “anticipate,” “believe,” “could,” “estimate,” “expect,” “intend,” “plan,” “potential” and “should,” among others.
Forward-looking statements appear in a number of places in this Annual Report on Form 20-F and include, but are not limited to, statements regarding our intent, belief, or current expectations. Forward-looking statements are based on our management’s beliefs and assumptions and on information currently available to our management. Such statements are subject to substantial risks and uncertainties, and actual results may differ materially from those expressed or implied in the forward-looking statements due to various important factors, including, but not limited to, those identified under “Risk Factors.” In light of the significant uncertainties in these forward-looking statements, you should not regard these statements as a guarantee by us or any other person that we will achieve our objectives and plans in any specified time frame, or at all.
Forward-looking statements include, but are not limited to, statements about:
• |
the effects of the ongoing COVID-19 pandemic, or of other global outbreaks of pandemics or contagious diseases or fear of such outbreaks, including on the demand for our products and services, and on overall economic conditions and business customer spending levels; |
• |
our ability to sustain our revenue growth rate in the future; |
• |
our ability to retain existing clients and attract new clients, including our ability to increase revenue from existing clients and diversify our revenue concentration; |
• |
our ability to attract and retain highly-skilled IT professionals at cost-effective rates; |
• |
our ability to successfully identify acquisition targets, consummate acquisitions and successfully integrate acquired businesses and personnel; |
• |
our ability to penetrate new industry verticals and geographies and grow our revenue in current industry verticals and geographies; |
• |
our ability to maintain favorable pricing and utilization rates; |
• |
the effects of increased competition as well as innovations by new and existing competitors in our market; |
• |
the size of our addressable market and market trends; |
• |
our ability to adapt to technological change and innovate solutions for our clients; |
• |
our plans for growth and future operations, including our ability to manage our growth; |
• |
our expectations of future operating results or financial performance; |
• |
our ability to effectively manage our international operations, including our exposure to foreign currency exchange rate fluctuations; and |
• |
our future financial performance, including trends in revenue, cost of sales, gross profit, selling, general and administrative expenses, finance income and expense and taxes. |
Forward-looking statements speak only as of the date they are made, and we do not undertake any obligation to update them in light of new information or future developments or to release publicly any revisions to these statements in order to reflect later events or circumstances or to reflect the occurrence of unanticipated events.
iv
In addition, statements that “we believe” and similar statements reflect our beliefs and opinions on the relevant subject. These statements are based upon information available to us as of the date of this Annual Report on Form 20-F and while we believe such information forms a reasonable basis for such statements, such information may be limited or incomplete, and our statements should not be read to indicate that we have conducted an exhaustive inquiry into, or review of, all relevant information. These statements are inherently uncertain and investors are cautioned not to unduly rely upon these statements.
You should read this Annual Report on Form 20-F and the documents that we reference herein and have filed as exhibits to this Annual Report on Form 20-F, completely and with the understanding that our actual future results may be materially different from what we expect. We qualify all of our forward-looking statements by these cautionary statements.
v
MARKET AND INDUSTRY DATA
Certain industry data and market data included in this Annual Report on Form 20-F were obtained from independent third-party surveys, market research, publicly available information, reports of governmental agencies, and industry publications and surveys. All of the market data used in this Annual Report on Form 20-F involves a number of assumptions and limitations, and you are cautioned not to give undue weight to such estimates. We believe that the information from these industry publications and surveys included in this Annual Report on Form 20-F is reliable. The industry in which we operate is subject to a high degree of uncertainty and risk due to a variety of factors, including those described in “Risk Factors.” These and other factors could cause results to differ materially from those expressed in the estimates made by the independent parties and by us.
vi
PART 1
Item 1. Identity of Directors, Senior Management and Advisers
Not Applicable.
Item2. Offer Statistics and Expected Timetable
Not applicable.
Item 3. Key Information
A. Selected Financial Data
The following tables set forth our selected consolidated financial data for the five years ended June 30, 2020. We have derived the consolidated statement of comprehensive income data for the fiscal years ended June 30, 2020, 2019 and 2018 and the consolidated balance sheet data as of June 30, 2020 and 2019 from our audited consolidated financial statements included elsewhere in this Annual Report on Form 20-F. We have derived the consolidated statements of comprehensive income data for the fiscal years ended June 30, 2017 and 2016 and the consolidated balance sheet data as of June 30, 2018, 2017 and 2016 from our audited financial statements not included elsewhere in this Annual Report on Form 20-F. Our historical results are not necessarily indicative of the results that should be expected for any future period. This data should be read together with, and is qualified in its entirety by reference to, “Item 5. Operating and Financial Review and Prospects” as well as our consolidated financial statements and notes thereto included elsewhere in this Annual Report on Form 20-F.
We maintain our books and records in British Pounds, and we prepare our financial statements in accordance with IFRS as issued by the IASB. We report our financial results in British Pounds.
1
Fiscal Year Ended June 30, |
|||||||||||||||||||
2020 |
2019 |
2018 |
2017 |
2016 |
|||||||||||||||
(in thousands, except for share and per share amounts) |
|||||||||||||||||||
Consolidated Statement of Comprehensive Income Data: |
|||||||||||||||||||
Revenue |
£ |
350,950 |
£ |
287,930 |
£ |
217,613 |
£ |
159,368 |
£ |
115,432 |
|||||||||
Cost of sales: |
|||||||||||||||||||
Direct cost of sales(1)
|
(233,352 |
) |
(174,152 |
) |
(132,775 |
) |
(98,853 |
) |
(68,517 |
) |
|||||||||
Allocated cost of sales |
(17,447 |
) |
(14,951 |
) |
(12,668 |
) |
(9,907 |
) |
(6,529 |
) |
|||||||||
Total cost of sales |
(250,799 |
) |
(189,103 |
) |
(145,443 |
) |
(108,760 |
) |
(75,046 |
) |
|||||||||
Gross profit |
100,151 |
98,827 |
72,170 |
50,608 |
40,386 |
||||||||||||||
Selling, general and administrative expenses(1)
|
(78,279 |
) |
(65,857 |
) |
(46,737 |
) |
(27,551 |
) |
(20,453 |
) |
|||||||||
Operating profit |
21,872 |
32,970 |
25,433 |
23,057 |
19,933 |
||||||||||||||
Net finance income/(expense) |
1,169 |
(2,870 |
) |
(783 |
) |
(1,357 |
) |
898 |
|||||||||||
Gain on sale of subsidiary |
2,215 |
— |
— |
— |
— |
||||||||||||||
Profit before tax |
25,256 |
30,100 |
24,650 |
21,700 |
20,831 |
||||||||||||||
Tax on profit on ordinary activities |
(3,846 |
) |
(6,093 |
) |
(5,675 |
) |
(4,868 |
) |
(4,125 |
) |
|||||||||
Profit for the year and profit attributable to the equity holders of the Company |
£ |
21,410 |
£ |
24,007 |
£ |
18,975 |
£ |
16,832 |
£ |
16,706 |
|||||||||
Earnings per share, basic |
£ |
0.40 |
£ |
0.48 |
£ |
0.42 |
£ |
0.37 |
£ |
0.37 |
|||||||||
Earnings per share, diluted |
£ |
0.38 |
£ |
0.44 |
£ |
0.38 |
£ |
0.34 |
£ |
0.34 |
|||||||||
Weighted average number of shares outstanding, basic |
53,423,575 |
50,116,979 |
45,100,165 |
45,258,750 |
45,389,210 |
||||||||||||||
Weighted average number of shares outstanding, diluted |
56,065,080 |
55,026,223 |
50,426,216 |
49,292,520 |
49,318,045 |
||||||||||||||
Other Financial Data: |
|||||||||||||||||||
Revenue period-over-period growth rate |
21.9 |
% |
32.3 |
% |
36.5 |
% |
38.1 |
% |
37.2 |
% |
|||||||||
Profit before tax margin |
7.2 |
% |
10.5 |
% |
11.3 |
% |
13.6 |
% |
18.0 |
% |
|||||||||
Net cash provided by operating activities |
£ |
40,243 |
£ |
35,348 |
£ |
33,984 |
£ |
14,740 |
£ |
10,897 |
|||||||||
________________
(1) |
Includes share-based compensation expenses as follows: |
Fiscal Year Ended June 30, |
|||||||||||||||||||
2020 |
2019 |
2018 |
2017 |
2016 |
|||||||||||||||
(in thousands) |
|||||||||||||||||||
Direct cost of sales |
£ |
8,941 |
£ |
5,724 |
£ |
1,006 |
£ |
560 |
£ |
587 |
|||||||||
Selling, general and administrative expenses |
6,722 |
6,298 |
499 |
294 |
181 |
||||||||||||||
Total |
£ |
15,663 |
£ |
12,022 |
£ |
1,505 |
£ |
854 |
£ |
768 |
|||||||||
As of June 30, |
|||||||||||||||||||
2020(2)
|
2019 |
2018 |
2017 |
2016 |
|||||||||||||||
(in thousands) |
|||||||||||||||||||
Consolidated Balance Sheet Data: |
|||||||||||||||||||
Cash and cash equivalents |
£ |
101,327 |
£ |
70,172 |
£ |
15,048 |
£ |
23,571 |
£ |
12,947 |
|||||||||
Working capital (1)
|
111,061 |
82,676 |
(3,042 |
) |
11,028 |
3,180 |
|||||||||||||
Total assets |
360,943 |
222,678 |
151,014 |
106,382 |
72,897 |
||||||||||||||
Total liabilities |
124,616 |
56,349 |
81,515 |
57,662 |
43,104 |
||||||||||||||
Total equity |
236,327 |
166,329 |
69,499 |
48,720 |
29,793 |
||||||||||||||
(1) |
Working capital is defined as total current assets minus total current liabilities. |
(2) The Group has adopted IFRS 16 using the modified retrospective basis of adoption with the date of initial application of July 1, 2019. Prior year comparatives have not been restated for the effect of IFRS 16 and are presented as historically disclosed under IAS 17.
2
Non-IFRS Measures and Other Management Metrics
We regularly monitor a number of financial and operating metrics to evaluate our business, measure our performance, identify trends affecting our business, formulate financial projections and make strategic decisions. Our management metrics may be calculated in a different manner than similarly titled metrics used by other companies.
Fiscal Year Ended June 30, |
|||||||||||||||||||
2020 |
2019 |
2018 |
2017 |
2016 |
|||||||||||||||
(pounds in thousands) |
|||||||||||||||||||
Revenue growth rate at constant currency(1)
|
21.0 |
% |
31.1 |
% |
37.2 |
% |
28.5 |
% |
36.6 |
% |
|||||||||
Average number of employees involved in delivery of our services(2)
|
5,633 |
4,902 |
3,957 |
3,181 |
2,336 |
||||||||||||||
Revenue concentration(3)
|
38.1 |
% |
37.7 |
% |
41.5 |
% |
49.1 |
% |
53.7 |
% |
|||||||||
Number of large clients(4)
|
65 |
63 |
46 |
34 |
26 |
||||||||||||||
Adjusted profit before taxes margin(5)
|
19.5 |
% |
18.0 |
% |
15.4 |
% |
15.8 |
% |
19.7 |
% |
|||||||||
Adjusted free cash flow(6)
|
£ |
31,446 |
£ |
29,806 |
£ |
28,727 |
£ |
11,186 |
£ |
10,115 |
|||||||||
(1) |
We monitor our revenue growth rate at constant currency. As the impact of foreign currency exchange rates is highly variable and difficult to predict, we believe revenue growth rate at constant currency allows us to better understand the underlying business trends and performance of our ongoing operations on a period-over-period basis. We calculate revenue growth rate at constant currency by translating revenue from entities reporting in foreign currencies into British Pounds using the comparable foreign currency exchange rates from the prior period. For example, the average rates in effect for the fiscal year ended June 30, 2019 were used to convert revenue for the fiscal year ended June 30, 2020 and the revenue for the comparable prior period ended June 30, 2019, rather than the actual exchange rates in effect during the respective period. Revenue growth rate at constant currency is not a measure calculated in accordance with IFRS. While we believe that revenue growth rate at constant currency provides useful information to investors in understanding and evaluating our results of operations in the same manner as our management, our use of revenue growth rate at constant currency has limitations as an analytical tool, and you should not consider it in isolation or as a substitute for analysis of our financial results as reported under IFRS. Further, other companies, including companies in our industry, may report the impact of fluctuations in foreign currency exchange rates differently, which may reduce the value of our revenue growth rate at constant currency as a comparative measure. The following table presents a reconciliation of revenue growth rate at constant currency to revenue growth rate, the most directly comparable financial measure calculated and presented in accordance with IFRS, for each of the periods indicated: |
Fiscal Year Ended June 30, |
|||||||||||||||||||
2020 |
2019 |
2018 |
2017 |
2016 |
|||||||||||||||
(pounds in thousands) |
|||||||||||||||||||
Revenue |
£ |
350,950 |
£ |
287,930 |
£ |
217,613 |
£ |
159,368 |
£ |
115,432 |
|||||||||
Revenue period-over-period growth rate |
21.9 |
% |
32.3 |
% |
36.5 |
% |
38.1 |
% |
37.2 |
% |
|||||||||
Estimated impact of foreign currency exchange rate fluctuations |
(0.9 |
)% |
(1.2 |
)% |
0.7 |
% |
(9.6 |
)% |
(0.6 |
)% |
|||||||||
Revenue growth rate at constant currency |
21.0 |
% |
31.1 |
% |
37.2 |
% |
28.5 |
% |
36.6 |
% |
|||||||||
(2) |
We monitor our average number of employees involved in delivery of our services because we believe it gives us visibility to the size of both our revenue-producing base and our most significant cost base, which in turn allows us better understand changes in our utilization rates and gross margins on a period-over-period basis. We calculate average number of employees involved in delivery of our services as the average of our number of full-time employees involved in delivery of our services on the last day of each month in the relevant period. |
(3) |
We monitor our revenue concentration to better understand our dependence on large clients on a period-over-period basis and to monitor our success in diversifying our revenue basis. We define revenue concentration as the percent of our total revenue derived from our 10 largest clients by revenue in each period presented. |
(4) |
We monitor our number of large clients to better understand our progress in winning large contracts on a period-over-period basis. We define number of large clients as the number of clients from whom we generated more than £1.0 million of revenue in the prior 12-month period. |
(5) |
We monitor our adjusted profit before taxes margin, or Adjusted PBT Margin, to better understand our ability to manage operational costs, to evaluate our core operating performance and trends and to develop future operating plans. In particular, we believe that the exclusion of certain expenses in calculating Adjusted PBT Margin facilitates comparisons of our operating performance on a period-over-period basis. Our Adjusted PBT Margin is our Adjusted PBT as a percentage of our total revenue. Our Adjusted PBT, is our profit before taxes adjusted to exclude the impact of share-based compensation expense, discretionary EBT bonus, amortization of acquired intangible assets, realized and unrealized foreign currency exchange gains and losses, initial public offering expenses incurred, Sarbanes-Oxley compliance readiness expenses, net gain disposal of subsidiary, fair |
3
value movement of contingent consideration, secondary offering expenses incurred and stamp duty on transfer of shares. Share-based compensation expense, amortization of acquired intangible assets, unrealized foreign currency exchange gains and losses and fair value movement of contingent consideration are non-cash expenses. We do not consider these excluded items to be indicative of our core operating performance. Adjusted PBT Margin is not a measure calculated in accordance with IFRS. While we believe that Adjusted PBT Margin provides useful information to investors in understanding and evaluating our results of operations in the same manner as our management, our use of Adjusted PBT Margin has limitations as an analytical tool, and you should not consider it in isolation or as a substitute for analysis of our financial results as reported under IFRS. For example, Adjusted PBT Margin does not reflect the potentially dilutive impact of share-based compensation nor does it reflect the potentially significant impact of foreign currency exchange rate fluctuations on our working capital. Further, other companies, including companies in our industry, may adjust their profit differently to capture their operating performance, which may reduce the value of Adjusted PBT Margin as a comparative measure. The following table presents a reconciliation of Adjusted PBT to profit before taxes, the most directly comparable financial measure calculated and presented in accordance with IFRS, for each of the periods indicated:
Fiscal Year Ended June 30, |
|||||||||||||||||||
2020 |
2019 |
2018 |
2017 |
2016 |
|||||||||||||||
(in thousands) |
|||||||||||||||||||
Profit before taxes |
£ |
25,256 |
£ |
30,100 |
£ |
24,650 |
£ |
21,700 |
£ |
20,831 |
|||||||||
Share-based compensation expense |
15,663 |
12,022 |
1,505 |
854 |
768 |
||||||||||||||
Amortization of acquired intangibles assets |
4,075 |
3,472 |
2,653 |
1,715 |
1,165 |
||||||||||||||
Foreign currency exchange (gains) losses net |
(2,054 |
) |
(2,945 |
) |
17 |
967 |
(4 |
) |
|||||||||||
Discretionary EBT bonus |
27,874 |
— |
— |
— |
— |
||||||||||||||
Net gain on disposal of subsidiary |
(2,215 |
) |
— |
— |
— |
— |
|||||||||||||
Initial public offering expenses incurred |
— |
1,055 |
4,537 |
— |
— |
||||||||||||||
Sarbanes-Oxley compliance readiness expenses incurred |
— |
1,440 |
106 |
— |
— |
||||||||||||||
Secondary offering expenses incurred |
— |
1,009 |
— |
— |
— |
||||||||||||||
Stamp duty on transfer of shares |
— |
10 |
— |
— |
— |
||||||||||||||
Fair value movement of contingent consideration |
— |
5,805 |
— |
— |
— |
||||||||||||||
Adjusted PBT |
£ |
68,599 |
£ |
51,968 |
£ |
33,468 |
£ |
25,236 |
£ |
22,760 |
|||||||||
(6) |
We monitor our adjusted free cash flow to better understand and evaluate our liquidity position and to develop future operating plans. Our adjusted free cash flow is our net cash provided by operating activities, plus grant received, less purchases of non-current tangible and intangible assets. For a discussion of grant received, see “Operating Results—Basis of Presentation—Cost of Sales.” Adjusted free cash flow is not a measure calculated in accordance with IFRS. While we believe that adjusted free cash flow provides useful information to investors in understanding and evaluating our liquidity position in the same manner as our management, our use of adjusted free cash flow has limitations as an analytical tool, and you should not consider it in isolation or as a substitute for analysis of our financial results as reported under IFRS. Further, other companies, including companies in our industry, may adjust their cash flows differently to capture their liquidity, which may reduce the value of free cash flow as a comparative measure. The following table presents a reconciliation of adjusted free cash flow to net cash provided by operating activities, the most directly comparable financial measure calculated and presented in accordance with IFRS, for each of the periods indicated: |
Fiscal Year Ended June 30, |
|||||||||||||||||||
2020 |
2019 |
2018 |
2017 |
2016 |
|||||||||||||||
(in thousands) |
|||||||||||||||||||
Net cash provided by operating activities |
£ |
40,243 |
£ |
35,348 |
£ |
33,984 |
£ |
14,740 |
£ |
10,897 |
|||||||||
Grant received |
888 |
1,784 |
147 |
2,924 |
1,948 |
||||||||||||||
Purchases of non-current assets (tangible and intangible) |
(9,685 |
) |
(7,326 |
) |
(5,404 |
) |
(6,478 |
) |
(2,730 |
) |
|||||||||
Adjusted free cash flow |
£ |
31,446 |
£ |
29,806 |
£ |
28,727 |
£ |
11,186 |
£ |
10,115 |
|||||||||
B. Capitalization and Indebtedness
Not applicable.
C. Reasons for the Offer and Use of Proceeds
4
Not applicable.
D. Risk Factors
Our business faces significant risks. You should carefully consider all of the information set forth in this annual report and in our other filings with the United States Securities and Exchange Commission, or “SEC”, including the following risk factors which we face and which are faced by our industry. Our business, financial condition or results of operations could be materially adversely affected by any of these risks. This report also contains forward-looking statements that involve risks and uncertainties. Our results could materially differ from those anticipated in these forward-looking statements, as a result of certain factors including the risks described below and elsewhere in this report and our other SEC filings. See “Cautionary Statement Regarding Forward-Looking Statements” above.
Risks Related to Our Business and Industry
Our results of operations may be negatively impacted by the COVID-19 pandemic.
The ongoing COVID-19 pandemic has resulted in many countries around the world imposing lockdowns, shelter-in-place orders, quarantines, restrictions on travel and mass gatherings, including the cancellation of trade shows and other events, and the extended shutdown of certain non-essential businesses that cannot be conducted remotely. While the potential economic impact brought by, and the duration of, the ongoing COVID-19 pandemic is difficult to assess or predict, it has resulted in significant disruption of global financial markets, which may reduce our ability to access capital and which could negatively affect our liquidity in the future. In addition, ongoing global economic uncertainty resulting from the spread of COVID-19 could materially affect our business, including the demand for our services, and the value of our ADSs. This financial uncertainty may also negatively impact pricing for our services or cause our clients to reduce or postpone their technology spending significantly, which may, in turn, lower the demand for our services and negatively affect our revenue, profitability and cash flows. The increased uncertainty and disruption to global markets may also negatively impact our growth opportunities whether organically or through acquisitions.
Furthermore, if a significant number of our employees are infected with SARS-CoV-2 and have COVID-19 and are unable to work, then our ability to deliver for our clients and run our business could be negatively affected.
While it is not possible at this time to estimate the full impact that the COVID-19 pandemic could have on worldwide economic activity and our business in particular, the continued spread of COVID-19 and the measures, and the market participant’s perception and responses to the measures, taken by governments, businesses and other organizations in response to COVID-19 could materially and adversely impact our business, results of operations and financial condition.
In addition, to the extent the ongoing COVID-19 pandemic adversely affects our business, results of operations and financial condition, it may also have the effect of heightening many of the other risks and uncertainties described in this “Risk Factors” section which may materially and adversely affect our business, results of operations and financial condition.
We have taken certain precautions due to the ongoing COVID-19 pandemic that could harm our business.
In light of the uncertain and rapidly evolving situation relating to the ongoing COVID-19 pandemic, we have taken temporary precautionary measures intended to help minimize the risk of the virus to our employees, our customers, and the communities in which we participate, which could negatively impact our business. As a company with employees, customers, partners and investors across the globe, we believe in upholding our company value of being good citizens by doing our part to help slow the spread of the virus. To this end, we have enabled all of our employees to work remotely in compliance with relevant government advice and have suspended all non-essential travel worldwide for our employees. In addition, we have cancelled or postponed company-sponsored events, including employee attendance at industry events and non-essential in-person work-related meetings. While we have a distributed workforce and our employees are accustomed to working remotely or working with other remote employees, our workforce is not fully remote. Our employees travel frequently to establish and maintain relationships with one another and with our customers, and many of our business processes assume that employees can meet with customers and prospective customers in person. Although we continue to monitor the situation and may adjust our current policies as more information and guidance become available, temporarily suspending travel and doing business in-person could
5
negatively impact our marketing efforts, challenge our ability to enter into customer contracts in a timely manner, slow down our recruiting efforts, or create operational or other challenges, including decreased productivity, as we adjust to a fully-remote workforce, any of which could harm our business. Though we are taking these precautionary measures as well as preparing our systems for the likelihood of increased cybersecurity threats, there is no guarantee that our precautions will fully protect our employees or enable us to maintain our productivity. The full extent to which the ongoing COVID-19 pandemic and our precautionary measures related thereto may impact our business will depend on future developments, which are highly uncertain and cannot be predicted at this time.
We may not be able to sustain our revenue growth rate in the future.
We have experienced rapid revenue growth in recent periods. Our revenue increased by 21.9% to £351.0 million in the fiscal year ended June 30, 2020 over 2019, and has increased by over 20% in each of the prior two years. We may not be able to sustain revenue growth consistent with our recent history or at all. You should not consider our revenue growth in recent periods as indicative of our future performance. As we grow our business, we expect our revenue growth rates to slow in future periods due to a number of factors, which may include slowing demand for our services, increasing competition, decreasing growth of our overall market, our inability to engage and retain a sufficient number of IT professionals or otherwise scale our business, prevailing wages in the markets in which we operate or our failure, for any reason, to capitalize on growth opportunities.
Additionally, we may experience a decrease in demand due to the worldwide economic impact of the ongoing COVID-19 pandemic, which could have a material adverse effect on our business, results of operations and financial condition.
We are dependent on our existing client base and our ability to retain such clients.
Historically, a significant percentage of our revenue has come from our existing client base. For example, during the fiscal year ended June 30, 2020, 91.0% of our revenue came from clients from whom we generated revenue during the prior fiscal year. However, the volume of work performed for a specific client is likely to vary from year to year, especially since we generally do not have long-term commitments from our clients and are often not our clients’ exclusive technology services provider. A major client in one year may not provide the same level of revenue for us in any subsequent year. Further, one or more of our significant clients could get acquired and there can be no assurance that the acquirer would choose to use our services in respect of such client to the same degree as previously, if at all. In particular, some of our clients are owned by private equity firms and are therefore inherently more likely to be sold at some point in the future.
In addition, the services we provide to our clients, and the revenue and income from those services, may decline or vary as the type and quantity of services we provide changes over time. In addition, our reliance on any individual client for a significant portion of our revenue may give that client a certain degree of pricing leverage against us when negotiating contracts and terms of service. In order to successfully perform and market our services, we must establish and maintain multi-year close relationships with our clients and develop a thorough understanding of their businesses. Our ability to maintain these close relationships is essential to the growth and profitability of our business. If we fail to maintain these relationships and successfully obtain new engagements from our existing clients, we may not achieve our revenue growth and other financial goals.
During the fiscal years ended June 30, 2020 and 2019, 2018 our 10 largest clients accounted for 38.1%, 37.7% and 41.5% of our revenue, respectively. Our largest client for the fiscal years ended June 30, 2020, 2019 and 2018, Worldpay (UK) Limited, or, together with Worldpay Group Limited and its consolidated subsidiaries, Worldpay, accounted for 10.8% of our revenue in the fiscal year ended June 30, 2018 and less than 10% of our revenue in each of the years ended June 30, 2020 and 2019. We are party to a master services agreement with Worldpay. Under the master services agreement, Worldpay committed to spend an aggregate of £55.7 million, after giving effect to certain discounts, with us during the period from January 1, 2017 to December 31, 2021, with annual discounted commitments ranging from £9.7 million to £12.2 million. Either we or Worldpay may terminate the master services agreement for cause (including material breach by the other party) and Worldpay may terminate the master services agreement if we undergo a change of control or due to regulatory requirements. In addition, Worldpay may terminate the master services agreement for convenience subject to six months prior notice no earlier than July 1, 2021 and payment of 30% of the minimum undiscounted commitment amount for the 12-month period following termination.
6
In August 2019, Worldpay was acquired by Fidelity National Information Services, Inc. There can be no assurance that our relationship will not be adversely affected as a result of the merger.
We anticipate that a limited number of clients will continue to account for a significant portion of our revenue in any given fiscal year for foreseeable future and, in some cases, a portion of our revenue attributable to an individual client may increase in the future. There can be no assurance that we will be successful in maintaining our relationship with and successfully obtaining new engagements from our existing clients. If we fail to maintain these relationships and successfully obtain new engagements from our existing clients, we may not achieve our revenue growth and other financial goals.
Additionally, if our existing client base, notably our largest clients, are adversely impacted by the ongoing COVID-19 pandemic, then we may experience a decrease in demand, delays in payment or postponement of projects, which could have a material adverse effect on our business, results of operations and financial condition.
We generally do not have long-term commitments from our clients, and our clients may terminate engagements before completion or choose not to enter into new engagements with us.
Our clients are generally not obligated for any long-term commitments to us. Our clients can terminate many of our master services agreements and work orders with or without cause, in some cases subject only to 15 days’ prior notice in the case of termination without cause. Although a substantial majority of our revenue is typically generated from clients who also contributed to our revenue during the prior year, our engagements with our clients are typically for projects that are singular in nature. In addition, large and complex projects may involve multiple engagements or stages, and a client may choose not to retain us for additional stages or may cancel or delay additional planned engagements. Therefore, we must seek to obtain new engagements when our current engagements are successfully completed or are terminated as well as maintain relationships with existing clients and secure new clients to maintain and expand our business.
Even if we successfully deliver on contracted services and maintain close relationships with our clients, a number of factors outside of our control could cause the loss of or reduction in business or revenue from our existing clients. These factors include, among other things:
• |
the business or financial condition of that client or the economy generally; |
• |
a change in strategic priorities by that client, resulting in a reduced level of spending on technology services; |
• |
changes in the personnel at our clients who are responsible for procurement of information technology, or IT, services or with whom we primarily interact; |
• |
a demand for price reductions by that client; |
• |
mergers, acquisitions or significant corporate restructurings involving that client; |
• |
a decision by that client to move work in-house or to one or several of our competitors; and |
• |
Uncertainty and disruption to the global markets including due to public health pandemics, such as the ongoing COVID-19 pandemic. |
The loss or diminution in business from any of our major clients could have a material adverse effect on our revenue and results of operations. The ability of our clients to terminate agreements makes our future revenue uncertain. We may not be able to replace any client that elects to terminate or not renew its contract with us, which could materially adversely affect our revenue and thus our results of operations. Further, terminations or delays in engagements may make it difficult to plan our project resource requirements.
We must attract and retain highly-skilled IT professionals.
In order to sustain our growth, we must attract and retain a large number of highly-skilled and talented IT professionals. During the fiscal year ended June 30, 2020, we increased our headcount by 870 employees, or 15.1%. Our business is people driven and, accordingly, our success depends upon our ability to attract, develop, motivate,
7
retain and effectively utilize highly-skilled IT professionals in our delivery locations, which are principally located in Bulgaria, North Macedonia, Moldova, Romania and Serbia, which we collectively refer to as Central Europe, and Argentina, Colombia, Uruguay and Venezuela in Latin America. We believe that there is significant competition for technology professionals in the geographic regions in which our delivery centers are located and that such competition is likely to continue for the foreseeable future. Increased hiring by technology companies and increasing worldwide competition for skilled technology professionals may lead to a shortage in the availability of suitable personnel in the locations where we operate and hire. In addition, the increased uncertainty and disruption resulting from the COVID-19 pandemic may negatively impact our ability to recruit, hire and train the IT professionals we require to operate our business. Our ability to properly staff projects, maintain and renew existing engagements and win new business depends, in large part, on our ability to recruit, train and retain IT professionals. Failure to hire, train and retain IT professionals in sufficient numbers could have a material adverse effect on our business, results of operations and financial condition.
Increases in our current levels of attrition may increase our operating costs and adversely affect our future business prospects.
The technology industry generally experiences a significant rate of turnover of its workforce. There is a limited pool of individuals who have the skills and training needed to help us grow our company. We compete for such talented individuals not only with other companies in our industry but also with companies in other industries, such as software services, engineering services, financial services and technology generally, among others. High attrition rates of IT personnel would increase our hiring and training costs and could have an adverse effect on our ability to complete existing contracts in a timely manner, meet client objectives and expand our business.
Our revenue is dependent on a limited number of industry verticals, and any decrease in demand for technology services in these verticals or our failure to effectively penetrate new verticals could adversely affect our results of operations.
Historically, we have focused on developing industry expertise and deep client relationships in a limited number of industry verticals. As a result, a substantial portion of our revenue has been generated by clients operating in the Payments and Financial Services vertical and the technology, media and telecommunications, or TMT, vertical. Payments and Financial Services and TMT constituted 52.8% and 25.7%, 52.9% and 27.4%, and 56.8% and 28.1% of our revenue, respectively, for the fiscal years ended June 30, 2020, 2019 and 2018 respectively. Our business growth largely depends on continued demand for our services from clients in Payments and Financial Services and TMT, and any slowdown or reversal of the trend to spend on technology services in these verticals could result in a decrease in the demand for our services and materially adversely affect our revenue, financial condition and results of operations.
We have also recently begun expanding our business into other verticals, such as consumer products, healthcare, logistics and retail. However, we have less experience in these verticals and there can be no assurance that we will be successful in penetrating these verticals. There may be competitors in these verticals that may be entrenched and difficult to dislodge. As a result of these and other factors, including increased spending controls by companies due to the economic impact of the ongoing COVID-19 pandemic, our efforts to expand our client base may be expensive and may not succeed, and we therefore may be unable to grow our revenue. If we fail to further penetrate our existing industry verticals or expand our client base in new verticals, we may be unable to grow our revenue and our operating results may be harmed.
Other developments, including impacts from the ongoing COVID-19 pandemic, in the industries in which we operate may also lead to a decline in the demand for our services, and we may not be able to successfully anticipate and prepare for any such changes. For example, consolidation or acquisitions, particularly involving our clients, may adversely affect our business. Our clients and potential clients may experience rapid changes in their prospects, substantial price competition and pressure on their profitability. This, in turn, may result in increasing pressure on us from clients and potential clients to lower our prices, which could adversely affect our revenue, results of operations and financial condition.
Our contracts could be unprofitable.
We perform our services primarily under time-and-materials contracts (where materials costs consist of travel and out-of-pocket expenses). We charge out the services performed by our employees under these contracts at daily or
8
hourly rates that are agreed at the time at which the contract is entered. The rates and other pricing terms negotiated with our clients are highly dependent on our internal forecasts of our operating costs and predictions of increases in those costs influenced by wage inflation and other marketplace factors, as well as the volume of work provided by the client. Our predictions are based on limited data and could turn out to be inaccurate, resulting in contracts that may not be profitable. Typically, we do not have the ability to increase the rates established at the outset of a client project, other than on an annual basis and often subject to caps. Independent of our right to increase our rates on an annual basis, client expectations regarding the anticipated cost of a project may limit our practical ability to increase our rates for ongoing work.
In addition to our time-and-materials contracts, we undertake some engagements on a fixed-price basis and also provide managed services in certain cases. Our pricing in fixed-price and managed service contracts is highly dependent on our assumptions and forecasts about the costs we expect to incur to complete the related project, which are based on limited data and could turn out to be inaccurate. Any failure by us to accurately estimate the resources, including the skills and seniority of our employees, required to complete a fixed-price or managed service contracts on time and on budget or meet a service level on a managed service contract, or any unexpected increase in the cost of our employees assigned to the related project, office space or materials could expose us to risks associated with cost overruns and could have a material adverse effect on our business, results of operations and financial condition. In addition, any unexpected changes in economic conditions that affect any of the foregoing assumptions and predictions could render contracts that would have been favorable to us when signed unfavorable.
Our profitability could suffer if we are not able to maintain favorable pricing.
Our profitability and operating results are dependent on the rates we are able to charge for our services. Our rates are affected by a number of factors, including:
• |
our clients’ perception of our ability to add value through our services; |
• |
our competitors’ pricing policies; |
• |
bid practices of clients and their use of third-party advisors; |
• |
the ability of large clients to exert pricing pressure; |
• |
employee wage levels and increases in compensation costs; |
• |
employee utilization levels; |
• |
our ability to charge premium prices when justified by market demand or the type of service; and |
• |
general economic conditions. |
If we are not able to maintain favorable pricing for our services, our profitability could suffer.
We must maintain adequate resource utilization rates and productivity levels.
Our profitability and the cost of providing our services are affected by our utilization rates of our employees in our delivery locations. If we are not able to maintain appropriate utilization rates for our employees involved in delivery of our services, our profit margin and our profitability may suffer. Our utilization rates are affected by a number of factors, including:
• |
our ability to promptly transition our employees from completed projects to new assignments and to hire and integrate new employees; |
• |
our ability to forecast demand for our services (and which may be impacted due to the effects of the ongoing COVID-19 pandemic) and thereby maintain an appropriate number of employees in each of our delivery locations; |
• |
our ability to deploy employees with appropriate skills and seniority to projects; |
9
• |
our ability to manage the attrition of our employees; and |
• |
our need to devote time and resources to training, professional development and other activities that cannot be billed to our clients. |
Our revenue could also suffer if we misjudge demand patterns, including as a result of uncertainties related to the ongoing COVID-19 pandemic, and do not recruit sufficient employees to satisfy demand. Employee shortages could prevent us from completing our contractual commitments in a timely manner and cause us to lose contracts or clients. Further, to the extent that we lack sufficient employees with lower levels of seniority and daily or hourly rates, we may be required to deploy more senior employees with higher rates on projects without the ability to pass such higher rates along to our clients, which could adversely affect our profit margin and profitability.
Recent acquisitions and potential future acquisitions could prove difficult to integrate, disrupt our business, dilute shareholder value and strain our resources.
We have completed six acquisitions (including the acquisitions of Velocity Partners LLC, or Velocity Partners, in December 2017, Intuitus Limited, or Intuitus, in November 2019, Exozet Berlin GmbH, or Exozet, in December 2019 and the Comtrade Digital Services business, or CDS, in August 2020) during the previous five fiscal years. In the future, we may acquire additional businesses that we believe could complement or expand our business. Realizing the benefits of acquisitions depends in part on the successful integration of operations and personnel. Integrating the operations of acquired businesses successfully or otherwise realizing any of the anticipated benefits of acquisitions, including anticipated cost savings and additional revenue opportunities, is complex and time-consuming and involves a number of potential challenges. In addition, travel and physical distancing restrictions due to the ongoing COVID-19 pandemic and related precautionary and safety measures could extend timelines and delay integration activities and operating synergies. The failure to meet these integration challenges could seriously harm our financial condition and results of operations. Past acquisitions and any acquisitions we may complete in the future will give rise to certain risks and we may encounter unexpected difficulties or incur unexpected costs, including:
• |
diversion of management attention from ongoing business concerns to integration matters; |
• |
lack of available staff to perform the integration in a timely manner or alternatively, to perform ongoing business activities due to their integration work; |
• |
consolidating and rationalizing information technology platforms and administrative infrastructures; |
• |
complexities associated with managing the geographic separation of the combined businesses and consolidating multiple physical locations; |
• |
retaining IT professionals and other key employees and achieving minimal unplanned attrition; |
• |
integrating personnel from different corporate cultures while maintaining focus on providing consistent, high quality service; |
• |
demonstrating to our clients and to clients of acquired businesses that the acquisition will not result in adverse changes in client service standards or business focus; |
• |
possible cash flow interruption or loss of profit as a result of transitional matters; |
• |
inability to generate sufficient profit to offset acquisition and integration costs in a reasonable timeframe or at all; and |
• |
inability to achieve the operating synergies anticipated in the acquisitions. |
Additionally, acquired businesses may have liabilities or adverse operating issues that we fail to discover through due diligence prior to the acquisition. In particular, to the extent that prior owners of any acquired businesses or properties failed to comply with or otherwise violated applicable laws or regulations, or failed to fulfil their contractual obligations to clients, we, as the successor owner, may be financially responsible for these violations and failures and may suffer financial or reputational harm or otherwise be adversely affected. Similarly, our acquisition targets may not have as
10
robust internal controls over financial reporting as would be expected of a public company. Acquisitions also frequently result in the recording of goodwill and other intangible assets which are subject to potential impairment in the future that could harm our financial results. We may also become subject to new regulations as a result of an acquisition, including if we acquire a business serving clients in a regulated industry or acquire a business with clients or operations in a country in which we do not already operate. In addition, if we finance acquisitions by issuing convertible debt or equity securities, our existing shareholders may be diluted, which could affect the market price of our ADSs. As a result, if we fail to properly evaluate acquisitions or investments, we may not achieve the anticipated benefits of any such acquisitions, and we may incur costs in excess of what we anticipate. Acquisitions frequently involve benefits related to the integration of operations of the acquired business. The failure to successfully integrate the operations or otherwise to realize any of the anticipated benefits of the acquisition could seriously harm our results of operations.
We may pursue acquisition opportunities which may cause our business to suffer.
We may pursue acquisition opportunities to grow our business. We can offer no assurance that any such acquired businesses will prove to be successful and accretive to shareholder value. Among other negative effects, our pursuit of such business opportunities could reduce operating margins and require more working capital, subject us to additional laws and regulations and materially and adversely affect our business, financial condition, cash flows or results of operations.
We are focused on growing our client base in North America and Europe and may not be successful.
We are focused on geographic expansion, particularly in North America and Europe. In fiscal years 2020, 2019 and 2018, 28.5%, 27.5% and 21.0% of our revenue, respectively, came from clients in North America and 24.5%, 27.5% and 33.7% of our revenue, respectively, came from clients in Europe. From fiscal year 2019 to fiscal year 2020, our revenue from clients in North America and Europe increased by 26.3% and 8.5%, respectively, and from fiscal year 2018 to fiscal year 2019, our revenue from clients in North America and Europe increased by 73.8%and 7.8%, respectively. We have made significant investments to expand in North America, including our acquisition of Velocity Partners in December 2017, which increased our sales presence in North America and added nearshore delivery capacity in Latin America. We have also made meaningful investments to expand in Europe, including our acquisitions of Intuitus in November 2019, Exozet in December 2019 and CDS in August 2020, which expanded our sales presence in Europe and expanded the services we can provide clients. However, our ability to add new clients will depend on a number of factors, including the market perception of our services, our ability to successfully add nearshore delivery center capacity and pricing, competition, overall economic conditions, including the impact of the COVID-19 pandemic. If we are unable to retain existing clients and attract new clients in North America and Europe, we may be unable to grow our revenue and our business, financial condition and results of operations could be adversely affected.
We may be unable to effectively manage our rapid growth or achieve anticipated growth, which could place significant strain on our management personnel, systems and resources.
We have experienced rapid growth and significantly expanded our business over the past several years, both organically and through acquisitions. We intend to continue to grow our business in the foreseeable future and to pursue existing and potential market opportunities. We have also increased the size and complexity of the projects that we undertake for our clients and hope to continue being engaged for larger and more complex projects in the future. As we add new delivery sites, acquire new companies, introduce new services or enter into new markets, we may face new market, technological and operational risks and challenges with which we are unfamiliar, and we may not be able to mitigate these risks and challenges to successfully grow those acquisitions, services or markets. In addition, the increased uncertainty and disruption resulting from the ongoing COVID-19 pandemic may negatively impact our growth opportunities as clients reduce or postpone their technology spending and finding and consummating suitable acquisition opportunities becomes more challenging. We may not be able to achieve our anticipated growth or successfully execute large and complex projects, which could materially adversely affect our revenue, results of operations, business and prospects.
Our future growth depends on us successfully recruiting, hiring and training IT professionals, expanding our delivery capabilities, adding effective sales staff and management personnel, adding service offerings, maintaining existing clients and winning new business. We often recruit skilled professionals by having them visit our offices. Consequently, the ongoing travel restrictions or disruptions resulting from the COVID-19 pandemic that prevent us
11
from meeting with professional prospects may adversely impact our ability to recruit the IT professionals necessary to grow our business. Further, effective management of these and other growth initiatives will require us to continue to improve our infrastructure, execution standards and ability to expand services. As our company grows, and we are required to add more employees and infrastructure to support our growth, we may find it increasingly difficult to maintain our corporate culture. If we fail to maintain a culture that fosters career development, innovation, creativity and teamwork, we could experience difficulty in hiring and retaining IT professionals. Failure to manage growth effectively could have a material adverse effect on the quality of the execution of our engagements, our ability to attract and retain IT professionals and our business, results of operations and financial condition.
We face intense competition.
The market for technology and IT services is intensely competitive, highly fragmented and subject to rapid change and evolving industry standards and we expect competition to intensify. We believe that the principal competitive factors that we face are the ability to innovate; technical expertise and industry knowledge; end-to-end solution offerings; delivery location; price; reputation and track record for high-quality and on-time delivery of work; effective employee recruiting; training and retention; responsiveness to clients’ business needs; scale; and financial stability.
Our primary competitors include next-generation IT service providers, such as Globant S.A. and EPAM Systems; digital agencies and consulting companies, such as Ideo, McKinsey & Company, The Omnicom Group, Sapient Corporation and WPP plc; global consulting and traditional IT services companies, such as Accenture PLC, Capgemini SE, Cognizant Technology Solutions Corporation and Tata Consultancy Services Limited; and in-house development departments of our clients. Many of our competitors have substantially greater financial, technical and marketing resources and greater name recognition than we do. As a result, they may be able to compete more aggressively on pricing or devote greater resources to the development and promotion of technology and IT services. Companies based in some emerging markets also present significant price competition due to their competitive cost structures and tax advantages.
In addition, there are relatively few barriers to entry into our markets and we have faced, and expect to continue to face, competition from new market entrants. Further, there is a risk that our clients may elect to increase their internal resources to satisfy their services needs as opposed to relying on a third-party service providers, such as us. The technology services industry may also undergo consolidation, which may result in increased competition in our target markets from larger firms that may have substantially greater financial, marketing or technical resources, may be able to respond more quickly to new technologies or processes and changes in client demands, and may be able to devote greater resources to the development, promotion and sale of their services than we can. Increased competition could also result in price reductions, reduced operating margins and loss of our market share. We cannot assure you that we will be able to compete successfully with existing or new competitors or that competitive pressures will not materially adversely affect our business, results of operations and financial condition.
If we do not continue to innovate and remain at the forefront of emerging technologies and related market trends, we may lose clients and not remain competitive.
Our success depends on delivering innovative solutions that leverage emerging technologies and emerging market trends to drive increased revenue, particularly in response to the ongoing COVID-19 pandemic, whose challenges require many businesses to increase their reliance on digital technologies. Technological advances and innovation are constant in the technology services industry. As a result, we must continue to invest significant resources to stay abreast of technology developments so that we may continue to deliver solutions that our clients will wish to purchase. If we are unable to anticipate technology developments, enhance our existing services or develop and introduce new services to keep pace with such changes and meet changing client needs, we may lose clients and our revenue and results of operations could suffer. Our results of operation would also suffer if our employees are not responsive to the needs of our clients, not able to help clients in driving innovation and not able to help our clients in effectively bringing innovative ideas to market. Our competitors may be able to offer engineering, design and innovation services that are, or that are perceived to be, substantially similar or better than those we offer. This may force us to reduce our daily rates and to expend significant resources in order to remain competitive, which we may be unable to do profitably or at all. Because many of our clients and potential clients regularly contract with other IT service providers, these competitive pressures may be more acute than in other industries.
12
We are dependent on members of our senior management team and other key employees.
Our future success heavily depends upon the continued services of our senior management team, particularly John Cotterell, our Chief Executive Officer, and other key employees. We currently do not maintain key man life insurance for any of the members of our senior management team or other key employees. We also do not have long-term employment contracts with all of our key employees. We are only entitled to six to 12 months’ prior notice if our executive officers intend to terminate their respective employment with us and three months’ prior notice if any of our other senior executives intend to terminate their respective employment with us. If one or more of our senior executives or key employees are unable or unwilling to continue in their present positions, it could disrupt our business operations, and we may not be able to replace them easily, on a timely basis or at all. In addition, competition for senior executives and key employees in our industry is intense, and we may be unable to retain our senior executives and key employees or attract and retain new senior executives and key employees in the future, in which case our business may be severely disrupted.
If any of our senior management team or key employees joins a competitor or forms a competing company, we may lose clients, suppliers, know-how and IT professionals and staff members to them. Also, if any of our sales executives or other sales personnel, who generally maintain close relationships with our clients, joins a competitor or forms a competing company, we may lose clients to that company, and our revenue may be materially adversely affected. Additionally, there could be unauthorized disclosure or use of our technical knowledge, business practices or procedures by such personnel. Any non-competition, non-solicitation or non-disclosure agreements we have with our senior executives or key employees might not provide effective protection to us in light of legal uncertainties associated with the enforceability of such agreements.
Additionally, we have a number of current employees whose equity ownership in our company gives them a substantial amount of personal wealth. As a result, it may be difficult for us to continue to retain and motivate these employees, and this wealth could affect their decisions about whether or not they continue to work for us. Further, although the Class B ordinary shares that are held by our employees are subject to certain restrictions on disposition for periods of up to five years following the completion of our initial public offering in July 2018, sales of our ADSs by our employees in the open market or the perception that such sales may occur may negatively impact the market price of our ADSs. The risk that our employees may sell ADSs in the open market may be made more acute as a result of the fact that we do not anticipate paying dividends for the foreseeable future, meaning open market sales or sales in registered offerings may be our employees’ only means of generating liquidity from their ownership of our securities.
Forecasts of our market may prove to be inaccurate, and even if the markets in which we compete achieve the forecasted growth, there can be no assurance that our business will grow at similar rates, or at all.
Growth forecasts included in this Annual Report on Form 20-F relating to our market opportunity and the expected growth in the market for our services are subject to significant uncertainty and are based on assumptions and estimates which may prove to be inaccurate. Even if these markets meet our size estimates and experience the forecasted growth, we may not grow our business at similar rates, or at all. Our growth is subject to many risks and uncertainties, including our success in implementing our business strategy. Accordingly, the forecasts of market growth included in this Annual Report on Form 20-F should not be taken as indicative of our future growth.
Our business will suffer if we are not successful in delivering contracted services.
Our operating results are dependent on our ability to successfully deliver contracted services in a timely manner. We must consistently build, deliver and support complex projects and managed services. Failure to perform or observe any contractual obligations could damage our relationships with our clients and could result in cancellation or non-renewal of a contract. Some of the challenges we face in delivering contracted services to our clients include:
• |
maintaining high-quality control and process execution standards; |
• |
maintaining planned resource utilization rates on a consistent basis; |
• |
maintaining employee productivity and implementing necessary process improvements; |
• |
controlling costs; |
13
• |
maintaining close client contact and high levels of client satisfaction; |
• |
maintaining physical and data security standards required by our clients; |
• |
recruiting and retaining sufficient numbers of skilled IT professionals; and |
• |
maintaining effective client relationships. |
If we are unable to deliver on contracted services, our relationships with our clients will suffer and we may be unable to obtain new projects. In addition, it could damage our reputation, cause us to lose business, impact our margins and adversely affect our business and results of operations.
Our sales of services, operating results or profitability may experience significant variability and our past results may not be indicative of our future performance.
Our operating results may fluctuate due to a variety of factors, many of which are outside of our control. As a result, comparing our operating results on a period-to-period basis may not be meaningful. Fluctuations in our operating results may be particularly pronounced in the current economic environment due to the uncertainty caused by and the unprecedented nature of the current COVID-19 pandemic. You should not rely on our past results as an indication of our future performance.
Factors that are likely to cause these variations include:
• |
the number, timing, scope and contractual terms of projects in which we are engaged; |
• |
delays in project commencement or staffing delays due to difficulty in assigning appropriately skilled or experienced professionals; |
• |
the accuracy of estimates on the resources, time and fees required to complete projects and costs incurred in the performance of each project; |
• |
inability to retain employees or maintain employee utilization levels; |
• |
changes in pricing in response to client demand and competitive pressures; |
• |
the business decisions of our clients regarding the use of our services or spending on technology; |
• |
the ability to further grow sales of services from existing clients; |
• |
seasonal trends and the budget and work cycles of our clients; |
• |
delays or difficulties in expanding our operational facilities or infrastructure; |
• |
our ability to estimate costs under fixed price or managed service contracts; |
• |
employee wage levels and increases in compensation costs; |
• |
unanticipated contract or project terminations; |
• |
the timing of collection of accounts receivable; |
• |
our ability to manage risk through our contracts; |
• |
the continuing financial stability of our clients; |
• |
changes in our effective tax rate; |
• |
fluctuations in currency exchange rates; |
• |
general economic conditions; and |
14
• |
the impact of public health pandemics, such as the ongoing COVID-19 pandemic. |
As a result of these factors, our operating results may from time to time fall below our estimates or the expectations of public market analysts and investors.
We operate in a rapidly evolving industry, which makes it difficult to evaluate our future prospects and may increase the risk that we will not continue to be successful.
The technology services industry is competitive and continuously evolving, subject to rapidly changing demands and constant technological developments. As a result, success and performance metrics are difficult to predict and measure in our industry. Because services and technologies are rapidly evolving and each company within the industry can vary greatly in terms of the services it provides, its business model, and its results of operations, it can be difficult to predict how any company’s services, including ours, will be received in the market. Neither our past financial performance nor the past financial performance of any other company in the technology services industry is indicative of how our company will fare financially in the future. Our future profits may vary substantially from those of other companies and those we have achieved in the past, making an investment in our company risky and speculative. If our clients’ demand for our services declines as a result of economic conditions, market factors or shifts in the technology industry, our business would suffer and our results of operations and financial condition would be adversely affected.
We have in the past experienced, and may in the future experience, a long selling and implementation cycle with respect to certain projects that require us to make significant resource commitments prior to realizing revenue for our services.
We have experienced, and may in the future experience, a long selling cycle with respect to certain projects that require significant investment of human resources and time by both our clients and us. Before committing to use our services, potential clients may require us to expend substantial time and resources educating them on the value of our services and our ability to meet their requirements. Therefore, our selling cycle is subject to many risks and delays over which we have little or no control, including our clients’ decision to choose alternatives to our services (such as other technology and IT service providers or in-house resources) and the timing of our clients’ budget cycles and approval processes. If our sales cycle unexpectedly lengthens for one or more projects, it would negatively affect the timing of our revenue and hinder our revenue growth. For certain clients, we may begin work and incur costs prior to executing the contract. A delay in our ability to obtain a signed agreement or other persuasive evidence of an arrangement, or to complete certain contract requirements in a particular quarter, could reduce our revenue in that quarter or render us entirely unable to collect payment for work already performed.
Implementing our services also involves a significant commitment of resources over an extended period of time from both our clients and us. Our clients may experience delays in obtaining internal approvals or delays associated with technology, thereby further delaying the implementation process. Our current and future clients may not be willing or able to invest the time and resources necessary to implement our services, and we may fail to close sales with potential clients to which we have devoted significant time and resources. Any significant failure to generate revenue or delays in recognizing revenue after incurring costs related to our sales or services process could materially adversely affect our business.
Additionally, we have experienced and may continue to experience longer sales and implementation cycles for current and future clients due to the worldwide economic impact of the COVID-19 pandemic and the restrictions and precautions that have been implemented by governments and companies, including ours, around the world. Notably, restrictions on face-to-face meetings with clients and our ability to work from client facilities could lengthen our selling and implementation cycles.
If we provide inadequate service or cause disruptions in our clients’ businesses, it could result in significant costs to us, the loss of our clients and damage to our corporate reputation.
Any defects or errors or failure to meet clients’ expectations in the performance of our contracts could result in claims for substantial damages against us. Our contracts generally limit our liability for damages that arise from negligent acts, error, mistakes or omissions in rendering services to our clients. However, we cannot be sure that these contractual provisions will protect us from liability for damages in the event we are sued. In addition, certain liabilities, such as
15
claims of third parties for intellectual property infringement and breaches of data protection and security requirements, for which we may be required to indemnify our clients, could be substantial. The successful assertion of one or more large claims against us in amounts greater than those covered by our current insurance policies could materially adversely affect our business, financial condition and results of operations. Even if such assertions against us are unsuccessful, we may incur reputational harm and substantial legal fees. In addition, a failure or inability to meet a contractual requirement could seriously damage our corporate reputation and limit our ability to attract new business.
In certain instances, we guarantee clients that we will complete a project by a scheduled date or that we will maintain certain service levels. We are generally not subject to monetary penalties for failing to complete projects by the scheduled date, but may suffer reputational harm and loss of future business if we do not meet our contractual commitments. In addition, if the project experiences a performance problem, we may not be able to recover the additional costs we will incur, which could exceed revenue realized from a project. Under our managed service contracts, we may be required to pay liquidated damages if we are unable to maintain agreed-upon service levels.
Our business depends on a strong brand and corporate reputation.
Since many of our specific client engagements involve highly tailored solutions, our corporate reputation is a significant factor in our clients’ and prospective clients’ determination of whether to engage us. We believe the Endava brand name and our reputation are important corporate assets that help distinguish our services from those of our competitors and also contribute to our efforts to recruit and retain talented IT professionals. However, our corporate reputation is susceptible to damage by actions or statements made by current or former employees or clients, competitors, vendors and adversaries in legal proceedings, as well as members of the investment community and the media. There is a risk that negative information about our company, even if based on false rumor or misunderstanding, could adversely affect our business. In particular, damage to our reputation could be difficult and time-consuming to repair, could make potential or existing clients reluctant to select us for new engagements, resulting in a loss of business, and could adversely affect our employee recruitment and retention efforts. Damage to our reputation could also reduce the value and effectiveness of our Endava brand name and could reduce investor confidence in us and adversely affect our operating results.
Our cash flows and results of operations may be adversely affected if we are unable to collect on billed and unbilled receivables from clients.
Our business depends on our ability to effectively bill and successfully obtain payment from our clients of the amounts they owe us for work performed. We evaluate the financial condition of our clients and usually bill and collect on relatively short cycles. We maintain provisions against receivables. Actual losses on client balances could differ from those that we currently anticipate and, as a result, we may need to adjust our provisions. We may not accurately assess the creditworthiness of our clients. Macroeconomic conditions, such as a potential credit crisis in the global financial system and the ongoing global COVID-19 pandemic, have resulted and could continue to result in financial difficulties for our clients, including limited access to the credit markets, insolvency or bankruptcy. Such conditions have caused some clients and could cause other clients to delay payment, request modifications of their payment terms, or default on their payment obligations to us, all of which could increase our receivables balance. Timely collection of fees for client services depends on our ability to complete our contractual commitments and subsequently effectively bill for and collect our contractual service fees. If we are unable to meet our contractual obligations or effectively prepare and provide invoices, including as a result of the ongoing global COVID-19 pandemic, we might experience delays in the collection of or be unable to collect our client balances, which would adversely affect our results of operations and could adversely affect our cash flows. In addition, if we experience an increase in the time required to bill and collect for our services or if our clients are delayed in making payments or stop payments altogether, our cash flows could be adversely affected, which in turn could adversely affect our ability to make necessary investments and, therefore, could affect our results of operations.
If we are unable to comply with our security obligations or our computer systems or the computer systems of our clients are or become vulnerable to security breaches, we may face reputational damage and lose clients and revenue.
The ongoing COVID-19 pandemic and the sustained associated restrictions on travel and public assembly in the locations where we operate have required our workforce to transition from being based primarily in our offices or at client sites to working from their homes via internet based remote access. While we have taken steps to adjust our
16
security policies and practices to meet the changed security profile that this presents, this situation increases our risk of a cybersecurity incident. Additionally, our operations could be materially adversely affected by interruptions in internet service or power at employee residences.
The services we provide are often critical to our clients’ businesses and the level of criticality has increased in some cases as a result of increased reliance on digital systems in the COVID-19 impacted environment. Certain of our client contracts require us to comply with security obligations, which could include maintaining network security and backup data, ensuring our network is virus-free, maintaining business continuity planning procedures, and verifying the integrity of employees that work with our clients by conducting background checks. Any failure in a client’s system, whether or not a result of or related to the services we provide, or breach of security relating to the services we provide to the client could damage our reputation or result in a claim for substantial damages against us. Our liability for breaches of data security requirements, for which we may be required to indemnify our clients, may be extensive. Any significant failure of our equipment or systems, or any major disruption to basic infrastructure like power and telecommunications in the locations in which we operate, could impede our ability to provide services to our clients, have a negative impact on our reputation, cause us to lose clients, and adversely affect our results of operations.
In addition, we often have access to or are required to collect and store confidential client and customer data. If any person, including any of our employees or former employees, penetrates our network security, accidentally exposes our data or code, or misappropriates data or code that belongs to us, our clients, or our clients’ customers, we could be subject to significant liability from our clients or from our clients’ customers for breaching contractual confidentiality provisions or privacy laws. Unauthorized disclosure of sensitive or confidential client and customer data, whether through breach of our computer systems, systems failure, loss or theft of confidential information or intellectual property belonging to our clients or our clients’ customers, or otherwise, could damage our reputation, cause us to lose clients and revenue, and result in financial and other potential losses by us.
We may be subject to liability claims if we breach our contracts and our insurance may be inadequate to cover our losses.
We are subject to numerous obligations in our contracts with our clients. Despite the procedures, systems and internal controls we have implemented to comply with our contracts, we may breach these commitments, whether through a weakness in these procedures, systems and internal controls, negligence or the willful act of an employee or contractor. Our insurance policies, including our errors and omissions insurance, may be inadequate to compensate us for the potentially significant losses that may result from claims arising from breaches of our contracts, disruptions in our services, failures or disruptions to our infrastructure, catastrophic events and disasters or otherwise. In addition, such insurance may not be available to us in the future on economically reasonable terms, or at all. Further, our insurance may not cover all claims made against us and defending a suit, regardless of its merit, could be costly and divert management’s attention.
Regulatory, legislative or self-regulatory/standard developments regarding privacy and data security matters could adversely affect our ability to conduct our business.
We, along with a significant number of our clients, are subject to laws, rules, regulations and industry standards related to data privacy and cyber security, and restrictions or technological requirements regarding the collection, use, storage, protection, retention or transfer of data. For example, the European Union General Data Protection Regulation, or GDPR, came into force in May 2018 and contains numerous requirements and changes from existing EU law, including more robust obligations on data processors and data controllers and heavier documentation requirements for data protection compliance programs. Specifically, the GDPR introduced numerous privacy-related changes for companies operating in the European Union, including greater control over personal data by data subjects (e.g., the “right to be forgotten”), increased data portability for EU consumers, data breach notification requirements and increased fines. In particular, under the GDPR, fines of up to €20 million or up to 4% of the annual global revenue of the noncompliant company, whichever is greater, could be imposed for violations of certain of the GDPR’s requirements. The GDPR requirements apply not only to third-party transactions, but also to transfers of information between us and our subsidiaries, including employee information.
We are required to comply with the GDPR as a “Data Controller” and a “Data Processor.” In the United States, the rules and regulations to which we may be subject include those promulgated under the authority of the Federal
17
Trade Commission, the Gramm Leach Bliley Act and state cybersecurity and breach notification laws, as well as regulator enforcement positions and expectations. Globally, governments and agencies have adopted and could in the future adopt, modify, apply or enforce laws, policies, regulations, and standards covering user privacy, data security, technologies such as cookies that are used to collect, store and/or process data, marketing online, the use of data to inform marketing, the taxation of products and services, unfair and deceptive practices, and the collection (including the collection of information), use, processing, transfer, storage and/or disclosure of data associated with unique individual internet users. New regulation or legislative actions regarding data privacy and security (together with applicable industry standards) may increase the costs of doing business and could have a material adverse impact on our operations and cash flows.
While we have taken steps to mitigate the impact of the GDPR on us, the efficacy and longevity of these mechanisms remains uncertain. Potential or actual legal proceedings could lead to one or both of these mechanisms being declared invalid. Further, despite our ongoing efforts to bring practices into compliance, we may not be successful either due to various factors within our control, such as limited financial or human resources, or other factors outside our control. It is also possible that local data protection authorities may have different interpretations of the GDPR, leading to potential inconsistencies amongst various EU Member States.
Additionally, following the result of a referendum in 2016, the United Kingdom left the European Union on January 31, 2020, commonly referred to as Brexit. Pursuant to the formal withdrawal arrangements agreed between the United Kingdom and the European Union, the United Kingdom will be subject to a transition period until December 31, 2020, or the Transition Period, during which European Union rules will continue to apply in the United Kingdom. While the Data Protection Act of 2018, which “implements” and complements the GDPR has achieved Royal Assent on May 23, 2018 and is now effective in the United Kingdom, it is still unclear whether transfer of data from the European Economic Area, or EEA, to the United Kingdom will remain lawful under GDPR following the expiry of the Transition Period. Beginning in 2021, the United Kingdom will be a “third country” under the GDPR. We may incur liabilities, expenses, costs, and other operational losses under GDPR after the Transition Period and applicable EU Member States and the United Kingdom privacy laws in connection with any measures we take to comply with them.
Additionally, California enacted legislation that has been dubbed the first “GDPR-like” law in the United States. Known as the California Consumer Privacy Act, or CCPA, it creates new individual privacy rights for consumers (as that word is broadly defined in the law) and places increased privacy and security obligations on entities handling personal data of consumers or households. The CCPA went into effect on January 1, 2020 and requires covered companies to provide new disclosures to California consumers, provide such consumers new ways to opt-out of certain sales of personal information, and allow for a new private right of action for data breaches. Despite amendments and multiple revisions of draft regulations (which have now been finalized), it remains unclear how the CCPA will be interpreted, but as currently written, the CCPA could impact our business activities depending on how it is interpreted.
Recent legal developments in Europe have created further complexity and uncertainty regarding transfers of personal data from the European Union and United Kingdom to the United States. On July 16, 2020, the Court of Justice of the European Union, or CJEU, invalidated the E.U.-U.S. Privacy Shield Framework, or Privacy Shield, under which personal data could be transferred from the European Union and United Kingdom to United States entities who had self-certified under the Privacy Shield scheme. While the CJEU upheld the adequacy of the standard contractual clauses (a standard form of contract approved by the European Commission as an adequate personal data transfer mechanism, and potential alternative to the Privacy Shield), it made clear that reliance on them alone may not necessarily be sufficient in all circumstances. Use of the standard contractual clauses must now be assessed on a case-by-case basis taking into account the legal regime applicable in the destination country, in particular applicable surveillance laws and rights of individuals and additional measures and/or contractual provisions may need to be put in place, however, the nature of these additional measures is currently uncertain. As supervisory authorities issue further guidance on personal data export mechanisms, including circumstances where the standard contractual clauses cannot be used, and/or start taking enforcement action, we could suffer additional costs, complaints and/or regulatory investigations or fines, and/or if we are otherwise unable to transfer personal data between and among countries and regions in which we operate, it could affect the manner in which we provide our services, the geographical location or segregation of our relevant systems and operations, and could adversely affect our financial results.
18
Any failure or perceived failure (including as a result of deficiencies in our policies, procedures, or measures relating to privacy, data protection, marketing, or client communications) by us to comply with laws, regulations, policies, legal or contractual obligations, industry standards, or regulatory guidance relating to privacy or data security, may result in governmental investigations and enforcement actions, litigation, fines and penalties or adverse publicity, and could cause our clients and partners to lose trust in us, which could have an adverse effect on our reputation and business. We expect that there will continue to be new proposed laws, regulations and industry standards relating to privacy, data protection, marketing, consumer communications and information security in the United States, the European Union and other jurisdictions, and we cannot determine the impact such future laws, regulations and standards may have on our business. Future laws, regulations, standards and other obligations or any changed interpretation of existing laws or regulations could impair our ability to develop and market new services and maintain and grow our client base and increase revenue.
Our client relationships, revenue, results of operations and financial condition may be adversely affected if we experience disruptions in our internet infrastructure, telecommunications or IT systems.
Disruptions in telecommunications, systems, or internet infrastructure could damage our reputation and harm our ability to deliver services to our clients, which could result in client dissatisfaction and a loss of business and related reduction of our revenue. We may not be able to consistently maintain active voice and data communications between our various global operations and with our clients due to disruptions in telecommunication networks and power supply, or system failures. Any significant failure in our ability to communicate could result in a disruption in business, which could hinder our performance and our ability to complete projects on time. Such failure to perform on client contracts could have a material adverse effect on our revenue, business, results of operations and financial condition and the market price of our ADSs.
Due to the ongoing COVID-19 pandemic and the sustained associated restrictions on travel and public assembly in the locations where we operate, our workforce has transitioned from being based primarily in our offices or at client sites to working from their homes via internet based remote access. While we have taken steps to adjust our policies and practices to meet the challenges this presents, our operations face an increased risk from disruptions in telecommunications, systems or internet infrastructure notably at employee residences. Furthermore, as our workforce has transitioned to working from their residences via an internet based remote access, we face an increased risk of cyber-attacks.
Cyber-attacks or other information or security breaches, whether directed at us or at third parties, may result in a material loss or have material consequences. Furthermore, the public perception that a cyber-attack on our systems has been successful, whether or not this perception is correct, may damage our reputation with customers and third parties with whom we do business. Unauthorized access to or disclosure of personal information, in particular, could cause serious reputational harm and regulatory penalties with a material impact. A successful penetration or circumvention of system security could cause us serious negative consequences, including loss of customers and business opportunities, significant disruption to our operations and business, misappropriation or destruction of our confidential information and/or that of our customers, or damage to our or our customers’ and/or third parties’ computers or systems. It could also result in a violation of applicable privacy and other laws; increased litigation exposure; regulatory fines, penalties or intervention; loss of confidence in our security measures; reputational damage; reimbursement or other compensatory costs; and additional compliance costs, and therefore could materially adversely affect our revenue, results of operations, business and prospects.
Our business operations and financial condition could be adversely affected by negative publicity about offshore outsourcing or anti-outsourcing legislation in the countries in which our clients operate.
Concerns that offshore outsourcing has resulted in a loss of jobs and sensitive technologies and information to foreign countries have led to negative publicity concerning outsourcing in some countries. Many organizations and public figures in the United States and Europe have publicly expressed concern about a perceived association between offshore outsourcing IT service providers and the loss of jobs in their home countries. Current or prospective clients may elect to perform services that we offer, or may be discouraged from transferring these services to offshore providers such as ourselves, to avoid any negative perceptions that may be associated with using an offshore provider or for data
19
privacy and security concerns. As a result, our ability to compete effectively with competitors that operate primarily out of facilities located in these countries could be harmed.
Legislation enacted in certain European jurisdictions and any future legislation in Europe or any other country in which we have clients that restricts the performance of services from an offshore location could also materially adversely affect our business, financial condition and results of operations. For example, legislation enacted in the United Kingdom, based on the 1977 EC Acquired Rights Directive, has been adopted in some form by many European Union countries, and provides that if a company outsources all or part of its business to an IT services provider or changes its current IT services provider, the affected employees of the company or of the previous IT services provider are entitled to become employees of the new IT services provider, generally on the same terms and conditions as their original employment. In addition, dismissals of employees who were employed by the company or the previous IT services provider immediately prior to that transfer are automatically considered unfair dismissals that entitle such employees to compensation. As a result, in order to avoid unfair dismissal claims, we may have to offer, and become liable for, voluntary redundancy payments to the employees of our clients who outsource business to us in the United Kingdom and other European Union countries who have adopted similar laws. This legislation could materially affect our ability to obtain new business from companies in the United Kingdom and European Union and to provide outsourced services to companies in the United Kingdom and European Union in a cost-effective manner.
Certain of our clients require solutions that ensure security given the nature of the content being distributed and associated applicable regulatory requirements. In particular, our U.S. healthcare industry clients may rely on our solutions to protect information in compliance with the requirements of the Health Insurance Portability and Accountability Act of 1996, the 2009 Health Information Technology for Economic and Clinical Health Act, the Final Omnibus Rule of January 25, 2013, and related regulations, which are collectively referred to as HIPAA, and which impose privacy and data security standards that protect individually identifiable health information by limiting the uses and disclosures of individually identifiable health information and requiring that certain privacy and data security standards be implemented to protect this information. As a “business associate” to “covered entities” that are subject to HIPAA, such as certain healthcare providers, health plans and healthcare clearinghouses, we also have our own compliance obligations directly under HIPAA and pursuant to the business associate agreements that we are required to enter into with our clients that are HIPAA-covered entities and any vendors we engage that access, use, transmit or store individually identifiable health information in connection with our business operations. Further, various states have implemented similar privacy laws and regulations that impose restrictive requirements regulating the use and disclosure of health information and other personally identifiable information. These laws and regulations are not necessarily preempted by HIPAA, particularly if a state affords greater protection to individuals than HIPAA. Where state laws are more protective, we have to comply with the stricter provisions. In addition to fines and penalties imposed upon violators, some of these state laws also afford private rights of action to individuals who believe their personal information has been misused.
Compliance efforts can be expensive and burdensome, and if we fail to comply with our obligations under HIPAA, our required business associate agreements or applicable state data privacy laws and regulations, we could be subject to regulatory investigations and orders, significant fines and penalties, mitigation and breach notification expenses, private litigation and contractual damages, corrective action plans and related regulatory oversight and reputational harm.
Governments and industry organizations may also adopt new laws, regulations or requirements, or make changes to existing laws or regulations, that could impact the demand for, or value of, our services. If we are unable to adapt the solutions we deliver to our clients to changing legal and regulatory standards or other requirements in a timely manner, or if our solutions fail to allow our clients to comply with applicable laws and regulations, our clients may lose confidence in our services and could switch to services offered by our competitors, or threaten or bring legal actions against us.
We may not receive sufficient intellectual property rights from our employees and contractors to comply with our obligations to our clients and we may not be able to prevent unauthorized use of our intellectual property.
Our contracts generally require, and our clients typically expect, that we will assign to them all intellectual property rights associated with the deliverables that we create in connection with our engagements. In order to assign these
20
rights to our clients, we must ensure that our employees and contractors validly assign to us all intellectual property rights that they have in such deliverables. Our policy is to require employees and independent contractors to sign assignment of intellectual property agreements with us upon commencement of employment or engagement, but there can be no assurance that we will be able to enforce our rights under such agreements. Given that we operate in a variety of jurisdictions with different and evolving legal regimes, particularly in Central Europe and Latin America, we face increased uncertainty regarding whether such agreements will be found to be valid and enforceable by competent courts and whether we will be able to avail ourselves of the remedies provided for by applicable law.
Our success also depends in part on certain methodologies, practices, tools and technical expertise our company utilizes in designing, developing, implementing and maintaining applications and other proprietary intellectual property rights. In order to protect our intellectual property rights, we rely upon a combination of nondisclosure and other contractual arrangements as well as trade secret, copyright and trademark laws. We consider proprietary trade secrets and confidential know-how to be important to our business. However, trade secrets and confidential know-how are difficult to maintain as confidential. To protect this type of information against disclosure or appropriation by competitors, our policy is to require our employees, consultants, contractors and advisors to enter into confidentiality agreements with us. We also seek to preserve the integrity and confidentiality of our data, trade secrets and know-how by maintaining physical security of our premises and physical and electronic security of our information technology systems. Monitoring unauthorized uses and disclosures is difficult, and we do not know whether the steps we have taken to protect our proprietary technologies will be effective. We cannot guarantee that our trade secrets and other proprietary and confidential information will not be disclosed or that competitors will not otherwise gain access to our trade secrets. Current or former employees, consultants, contractors and advisers may unintentionally or willfully disclose our confidential information to competitors, and confidentiality agreements may not provide an adequate remedy in the event of unauthorized disclosure of confidential information. Enforcing a claim that a third party illegally obtained and used trade secrets and/or confidential know-how is expensive, time consuming and unpredictable. The enforceability of confidentiality agreements may vary from jurisdiction to jurisdiction. Furthermore, if a competitor lawfully obtained or independently developed any of our trade secrets, we would have no right to prevent such competitor from using that technology or information to compete with us, which could harm our competitive position. If the steps taken to maintain our trade secrets are deemed inadequate, we may have insufficient recourse against third parties for misappropriating the trade secret.
We have registered the “Endava” name and logo in the United Kingdom, the United States and certain other countries. We have pending applications for the “Endava” name and logo in other countries; however, we cannot assure you that any future trademark registrations will be issued for pending or future applications or that any registered trademarks will be enforceable or provide adequate protection of our proprietary rights. Our trademarks may also be subject to misappropriation in jurisdictions in which they are not registered.
We may be subject to claims by third parties asserting that companies we have acquired, our employees or we have misappropriated their intellectual property, or claiming ownership of what we regard as our own intellectual property.
We could be subject to claims by third parties that companies we have acquired, our employees or we have misappropriated their intellectual property. Our employees may misappropriate intellectual property from their former employers. Many of our employees were previously employed at our competitors or potential competitors. Some of these employees executed proprietary rights, non-disclosure and non-competition agreements in connection with such previous employment. Although we try to ensure that our employees do not use the proprietary information of others in their work for us, we may be subject to claims that we or these employees have used or disclosed confidential information or intellectual property, including trade secrets or other proprietary information, of any such employee's former employer. Litigation may be necessary to defend against these claims. In addition, we are subject to additional risks as a result of our recent acquisitions and any future acquisitions we may complete. The developers of the technology that we have acquired or may acquire may not have appropriately created, maintained or enforced intellectual property rights in such technology. Indemnification and other rights under acquisition documents may be limited in term and scope and may therefore provide little or no protection from these risks.
If we fail in prosecuting or defending any such claims, in addition to paying monetary damages, we may lose valuable intellectual property rights or personnel or sustain damages. Such intellectual property rights could be awarded
21
to a third party. Even if we successfully prosecute or defend against such claims, litigation could result in substantial costs and distract management.
If we incur any liability for a violation of the intellectual property rights of others, our reputation, business, financial condition and prospects may be adversely affected.
Our success largely depends on our ability to use and develop our technology, tools, code, methodologies and services without infringing the intellectual property rights of third parties, including patents, copyrights, trade secrets and trademarks. We may be subject to litigation involving claims of patent infringement or violation of other intellectual property rights of third parties. Parties making infringement claims may be able to obtain an injunction to prevent us from delivering our services or using technology involving the allegedly infringing intellectual property. Intellectual property litigation is expensive and time-consuming and could divert management’s attention from our business. A successful infringement claim against us, whether with or without merit, could, among others things, require us to pay substantial damages, develop substitute non-infringing technology, or rebrand our name or enter into royalty or license agreements that may not be available on acceptable terms, if at all, and would require us to cease making, licensing or using products that have infringed a third party’s intellectual property rights. Protracted litigation could also result in existing or potential clients deferring or limiting their purchase or use of our services until resolution of such litigation, or could require us to indemnify our clients against infringement claims in certain instances. Any intellectual property claim or litigation, whether we ultimately win or lose, could damage our reputation and materially adversely affect our business, financial condition and results of operations.
In addition, we typically indemnify clients who purchase our services and solutions against potential infringement of intellectual property rights, which subjects us to the risk of indemnification claims. These claims may require us to initiate or defend protracted and costly litigation on behalf of our clients, regardless of the merits of these claims and are often not subject to liability limits or exclusion of consequential, indirect or punitive damages. If any of these claims succeed, we may be forced to pay damages on behalf of our clients, redesign or cease offering our allegedly infringing services or solutions, or obtain licenses for the intellectual property such services or solutions allegedly infringe. If we cannot obtain all necessary licenses on commercially reasonable terms, our clients may stop using our services or solutions.
Further, our current and former employees could challenge our exclusive rights to the software they have developed in the course of their employment. In certain countries in which we operate, an employer is deemed to own the copyright work created by its employees during the course, and within the scope, of their employment, but the employer may be required to satisfy additional legal requirements in order to make further use and dispose of such works. While we believe that we have complied with all such requirements, and have fulfilled all requirements necessary to acquire all rights in software developed by our independent contractors, these requirements are often ambiguously defined and enforced. As a result, we may not be successful in defending against any claim by our current or former employees or independent contractors challenging our exclusive rights over the use and transfer of works those employees or independent contractors created or requesting additional compensation for such works.
We use third-party software, hardware and software-as-a-service, or SaaS, technologies from third parties that may be difficult to replace or that may cause errors or defects in, or failures of, the services or solutions we provide.
We rely on software and hardware from various third parties to deliver our services and solutions, as well as hosted SaaS applications from third parties. If any of these software, hardware or SaaS applications become unavailable due to extended outages, interruptions, cyber-attacks or because they are no longer available on commercially reasonable terms, it could result in delays in the provisioning of our services until equivalent technology is either developed by us, or, if available, is identified, obtained and integrated, which could increase our expenses or otherwise harm our business. In addition, any errors or defects in or failures of this third-party software, hardware or SaaS applications could result in errors or defects in or failures of our services and solutions, which could harm our business and be costly to correct. Many of these providers attempt to impose limitations on their liability for such errors, defects or failures, and if enforceable, we may have additional liability to our clients or third-party providers that could harm our reputation and increase our operating costs.
22
We incorporate third-party open source software into our client deliverables and our failure to comply with the terms of the underlying open source software licenses could adversely impact our clients and create potential liability.
We use open source software extensively in the solutions that we build for our clients and our client deliverables often contain software licensed by third parties under so-called “open source” licenses, including the GNU General Public License, or GPL, the GNU Lesser General Public License, or LGPL, the BSD License, the Apache License and others.. Any piece of third-party software, whether proprietary or open source, can contain security flaws which in some cases can result in security vulnerabilities in the applications utilizing them. Though we employ strategies to actively manage our software supply chain for open source software and attempt to minimize these risks,, there is no guarantee that these steps will be effective or successful. Any vulnerability in an application that we build for a client could be exploited to subvert the security controls in the system and allow a data breach or other security problem. Such an occurrence could have a material adverse impact our reputation, client relationship, financial condition or prospects.
In addition, from time to time, there have been claims against companies that distribute or use open source software in their products and services, asserting that such open source software infringes the claimants’ intellectual property rights. Our clients could be subject to suits by third parties claiming that what we believe to be licensed open source software infringes such third parties’ intellectual property rights, and we are generally required to indemnify our clients against such claims. Use of open source software may entail greater risks than use of third-party commercial software, as open source licensors generally do not provide warranties or other contractual protections regarding infringement claims or the quality of the code. In addition, certain open source licenses require that source code for software programs that are subject to the license be made available to the public and that any modifications or derivative works to such open source software continue to be licensed under the same terms.
Although we monitor our use of open source software in an effort both to comply with the terms of the applicable open source licenses and to avoid subjecting our client deliverables to conditions we do not intend, the terms of many open source licenses have not been interpreted by courts in relevant jurisdictions, and there is a risk that these licenses could be construed in a way that could impose unanticipated conditions or restrictions on our clients’ ability to use the software that we develop for them and operate their businesses as they intend. The terms of certain open source licenses may require us or our clients to release the source code of the software we develop for our clients and to make such software available under the applicable open source licenses. In the event that portions of client deliverables are determined to be subject to an open source license, we or our clients could be required to publicly release the affected portions of source code or re-engineer all, or a portion of, the applicable software. Disclosing our proprietary source code could allow our clients’ competitors to create similar products with lower development effort and time and ultimately could result in a loss of sales for our clients. Any of these events could create liability for us to our clients and damage our reputation, which could have a material adverse effect on our revenue, business, results of operations and financial condition and the market price of our ADSs.
Changes in laws and regulations related to the internet or changes in the internet infrastructure itself may diminish the demand for our services, and could have a negative impact on our business.
The future success of our business depends upon the continued use of the internet as a primary medium for commerce, communication and business applications. Federal, state or foreign government bodies or agencies have in the past adopted, and may in the future adopt, laws or regulations affecting the use of the internet as a commercial medium. Changes in these laws or regulations could adversely affect the demand for our services or require us to modify our solutions in order to comply with these changes. In addition, government agencies or private organizations may begin to impose taxes, fees or other charges for accessing the internet or commerce conducted via the internet. These laws or charges could limit the growth of internet-related commerce or communications generally, resulting in reductions in the demand for technology services such as ours.
In addition, the use of the internet as a business tool could be adversely affected due to delays in the development or adoption of new standards and protocols to handle increased demands of internet activity, security, reliability, cost, ease of use, accessibility, and quality of service. The performance of the internet and its acceptance as a business tool have been adversely affected by “ransomware,” “viruses,” “worms,” “malware,” “phishing attacks,” “data breaches” and similar malicious programs, behavior, and events, and the internet has experienced a variety of outages and other
23
delays as a result of damage to portions of its infrastructure. If the use of the internet is adversely affected by these or any other issues, demand for our services and solutions could suffer.
From time to time, some of our employees spend significant amounts of time at our clients’ facilities, often in foreign jurisdictions, which expose us to certain risks.
Some of our projects require a portion of the work to be undertaken at our clients’ facilities, which are often located outside our employees’ country of residence. The ability of our employees to work in locations around the world may depend on their ability to obtain the required visas and work permits, and this process can be lengthy and difficult. Immigration laws are subject to legislative change, as well as to variations in standards of application and enforcement due to political forces and economic conditions. In addition, we may become subject to taxation in jurisdictions where we would not otherwise be so subject as a result of the amount of time that our employees spend in any such jurisdiction in any given year. While we seek to monitor the number of days that our employees spend in each country to avoid subjecting ourselves to any such taxation, there can be no assurance that we will be successful in these efforts.
Additionally, the ability of our employees to work at our clients’ facilities has been adversely affected by the COVID-19 pandemic. Due to government restrictions and our own precautions, our employees are generally no longer able to work at our clients’ facilities, and their ability to do so for an indeterminate future period will be limited due to ongoing safety precautions, including social distancing and travel restrictions. We may face delays in completing projects, decreased productivity or increased difficulties in delivering for our clients for so long as our employees are unable to work at our clients’ offices.
To the extent our employees and contractors are able to work at our clients’ facilities, we may incur risks relating to our employees and contractors’ presence at our clients’ facilities, including, but not limited to: claims of misconduct, negligence or intentional malfeasance on the part of our employees. Some or all of these claims may lead to litigation and these matters may cause us to incur negative publicity with respect to these alleged problems. It is not possible to predict the outcome of these lawsuits or any other proceeding, and our insurance may not cover all claims that may be asserted against us.
Our business is subject to the risks of geo-political actions, including natural disasters, war and terrorism and public health pandemics.
A significant natural disaster, such as an earthquake, fire or a flood, a catastrophic event, such as a significant power outage, or a public health pandemic, such as COVID-19, could have a material adverse impact on our business, operating results and financial condition. In the event we are hindered by any of the events discussed above, our ability to provide our services to clients could be delayed. Additionally, a natural disaster, catastrophic event or public health epidemic could cause us or our customers to suspend all or a portion of their operations for a significant period of time, result in a permanent loss of resources, or require the relocation of personnel and material to alternate facilities that may not be available or adequate. Such an event could also cause an indirect economic impact on our customers, which could impact our customers’ purchasing decisions and reduce demand for our products and services.
In addition, our facilities are vulnerable to damage or interruption from human error, intentional bad acts, pandemics, earthquakes, hurricanes, floods, fires, war, terrorist attacks, power losses, hardware failures, systems failures, telecommunications failures and similar events. The occurrence of a natural disaster, power failure or an act of terrorism, vandalism or other misconduct could result in lengthy interruptions in provision of our services and failure to comply with our obligations to our clients. The occurrence of any of the foregoing events could damage our systems and hardware or could cause them to fail completely, and our insurance may not cover such events or may be insufficient to compensate us for the potentially significant losses, including the potential harm to the future growth of our business, that may result from interruptions in the provision of our services to clients as a result of system failures.
All of the aforementioned risks may be exacerbated if our disaster recovery plan proves to be inadequate. To the extent that any of the above results in delayed or reduced sales or increases our cost of sales, our business, financial condition and results of operations could be adversely affected.
24
Any debt we incur may affect our ability to operate our business and secure additional financing in the future.
In October 2019, we entered into a new Multicurrency Revolving Facility Agreement, or the Facility Agreement, with HSBC Bank plc as agent, or the Agent, HSBC UK Bank plc, DNB (UK) Limited, Keybank National Association and Silicon Valley Bank as mandated lead arrangers, bookrunners and original lenders, or the Mandated Lead Arrangers and the Original Lenders. The Multicurrency Revolving Credit Facility is an unsecured revolving credit facility in the amount of £200 million with an initial period of three years, and it replaces the existing £50 million secured facility with HSBC UK Bank Plc. The Facility Agreement also provides for an uncommitted accordion option for up to an aggregate of £75 million in additional borrowing. The Facility Agreement remains undrawn; however, we may draw down from the Facility in the future.
The Facility Agreement requires us, and any debt instruments we may enter into in the future may require us, to comply with various covenants that limit our ability to, among other things:
• |
dispose of assets; |
• |
complete mergers or acquisitions; |
• |
incur or guarantee indebtedness; |
• |
sell or encumber certain assets; |
• |
pay dividends or make other distributions to holders of our shares; |
• |
make specified investments; |
• |
engage in different lines of business; and |
• |
engage in certain transactions with affiliates. |
Under the terms of the Facility Agreement, we are required to comply with net leverage ratio and interest coverage covenants. Our ability to meet these ratios and covenants can be affected by events beyond our control and we may not meet these ratios and covenants. To the extent we draw down on the Facility, a failure by us to comply with the ratios or covenants contained in the Facility Agreement could result in an event of default, which could adversely affect our ability to respond to changes in our business and manage our operations. Upon the occurrence of an event of default, including the occurrence of a material adverse change, the lenders could elect to declare any amounts outstanding to be due and payable and exercise other remedies as set forth in the Facility Agreement. If any indebtedness under our Facility were to be accelerated, our future financial condition could be materially adversely affected.
We may also incur additional indebtedness under different agreements in the future. The instruments governing such indebtedness could contain provisions that are as, or more, restrictive than our existing debt instruments. If we are unable to repay, refinance or restructure our indebtedness when payment is due, the lenders could proceed against any collateral granted to them to secure such indebtedness or force us into bankruptcy or liquidation.
We may need additional capital, and a failure by us to raise additional capital on terms favorable to us, or at all, could limit our ability to grow our business and develop or enhance our service offerings to respond to market demand or competitive challenges.
We believe that our current cash balances, cash flow from operations and credit facilities should be sufficient to meet our anticipated cash needs for at least the next 12 months. We may, however, require additional cash resources due to changed business conditions or other future developments, including any investments or acquisitions we may decide to pursue. If these resources are insufficient to satisfy our cash requirements, we may seek to sell additional equity or debt securities, draw down on our revolving credit facility or obtain another credit facility. The sale of additional equity securities could result in dilution to our shareholders. The incurrence of indebtedness would result in increased debt service obligations and could require us to agree to operating and financing covenants that would restrict our operations. Our ability to obtain additional capital on acceptable terms is subject to a variety of uncertainties, including investors' perception of, and demand for, securities of IT services companies, conditions in the capital markets in which
25
we may seek to raise funds, our future results of operations and financial condition, and general economic and political conditions, all of which may be heightened due to the ongoing COIVD-19 pandemnic. Financing may not be available in amounts or on terms acceptable to us, or at all, and could limit our ability to grow our business and develop or enhance our service offerings to respond to market demand or competitive challenges.
We have significant fixed costs related to lease facilities and may incur additional expense as we adapt our facilities in response to the COVID-19 pandemic.
We have made and continue to make significant contractual commitments related to our leased facilities. The total lease related expense (net of any related gains and income) included in our financial statements for the 2020 fiscal year was £9.8 million, and we are contractually committed to £12.1 million in such lease expenses for the 2021 fiscal year. These expenses will have a significant impact on our fixed costs, and if we are unable to grow our business and revenue proportionately, our operating results may be negatively affected.
As we continue to adapt to the changes caused by the ongoing COVID-19 pandemic and take necessary safety precautions to ensure a safe and healthy work environment, we may face increased costs to adapt our offices to mitigate the risk of our employees being diagnosed with COVID-19, including office cleaning costs and ensuring we have enough space to maintain appropriate social distancing.
Additionally, we have moved our workforce to a remote working regime in response to the COVID-19 pandemic, and may continue to maintain such a regime even as social distancing restrictions are loosened. Therefore, we may require less office space than we currently have under our leases. This could require us to renegotiate some of our leases to match a reduced need for office space, which may in turn lead to disputes with existing landlords. This process could be costly and time consuming, and we cannot guarantee that any new leases would be on the same or better terms as our current lease arrangements.
Our ability to expand our business and procure new contracts or enter into beneficial business arrangements could be affected to the extent we enter into agreements with clients containing non-competition clauses.
We are a party to a small number of agreements with clients that restrict our ability to perform similar services for such clients’ competitors. We may in the future enter into agreements with clients that restrict our ability to accept assignments from, or render similar services to, those clients’ customers, require us to obtain our clients’ prior written consent to provide services to their customers or restrict our ability to compete with our clients, or bid for or accept any assignment for which those clients are bidding or negotiating. These restrictions may hamper our ability to compete for and provide services to other clients in a specific industry in which we have expertise and could materially adversely affect our business, financial condition and results of operations.
If our current insurance coverage is or becomes insufficient to protect against losses incurred, our business, results of operations and financial condition may be adversely affected.
We provide technology services that are integral to our clients’ businesses. If we were to default in the provision of any contractually agreed-upon services, our clients could suffer significant damages and make claims against us for those damages. We currently carry errors and omissions liability coverage in an amount we consider appropriate for all of the services we provide. To the extent client damages are deemed recoverable against us in amounts substantially in excess of our insurance coverage, or if our claims for insurance coverage are denied by our insurance carriers for any reason, including reasons beyond our control, there could be a material adverse effect on our revenue, business, results of operations and financial condition.
Risks Related to Our International Operations
The United Kingdom’s withdrawal from the European Union may have a negative effect on global economic conditions, financial markets and our business.
Following the result of a referendum in 2016, the United Kingdom left the European Union on January 31, 2020 (commonly referred to as Brexit). Pursuant to the formal withdrawal arrangements agreed between the United Kingdom and the European Union, the United Kingdom will be subject to a transition period until December 31, 2020, or the Transition Period, during which EU rules will continue to apply in the United Kingdom. During the Transition Period,
26
negotiations between the United Kingdom and the European Union are expected to continue in relation to the future customs and trading relationship between the United Kingdom and the European Union following the expiry of the Transition Period. Under the formal withdrawal arrangements between the United Kingdom and the European Union, the parties had until June 30, 2020 to agree to extend the Transition Period if required. No such extension was agreed prior to such date. No agreement has yet been reached between the United Kingdom. and the European Union and it may be the case that no formal customs and trading agreement will be reached prior to the expiry of the Transition Period on December 31, 2020.
Our principal executive offices are located in the United Kingdom. The lack of clarity over which EU laws and regulations will continue to be implemented in the United Kingdom after the expiry of the Transition Period (including financial laws and regulations, tax and free trade agreements, intellectual property rights, data protection laws, supply chain logistics, environmental, health and safety laws and regulations, immigration laws and employment laws) may negatively impact foreign direct investment in the United Kingdom., increase costs, depress economic activity and restrict access to capital.
The uncertainty concerning the United Kingdom’s legal, political and economic relationship with the European Union after the expiry of the Transition Period may be a source of instability in the international markets, create significant currency fluctuations, and/or otherwise adversely affect trading agreements or similar cross-border cooperation arrangements (whether economic, tax, fiscal, legal, regulatory or otherwise) after the Transition Period. For example, depending on the terms of the United Kingdom’s withdrawal from the European Union after the Transition Period, the United Kingdom. could lose the benefits of global trade agreements negotiated by the European Union on behalf of its members, which may result in increased trade barriers that could make our doing business in the European Union and the EEA more difficult.
These developments, or the perception that any of them could occur, have had and may continue to have a significant adverse effect on global economic conditions and the stability of global financial markets, and could significantly reduce global market liquidity and restrict the ability of key market participants to operate in certain financial markets. In particular, they could also lead to a period of considerable uncertainty in relation to the U.K. financial and banking markets, as well as on the regulatory process in Europe. Asset valuations, currency exchange rates and credit ratings may be especially subject to increased market volatility. These developments, or the perception that any of them could occur, may also have a significant effect on our ability to attract and retain employees, including IT professionals and other employees who are important for our business.
If the United Kingdom and the European Union are unable to negotiate acceptable withdrawal terms or if other EU Member States pursue withdrawal, barrier-free access between the United Kingdom and other EU Member States or among the EEA overall could be diminished or eliminated. The long-term effects of Brexit will depend on any agreements (or lack thereof) between the United Kingdom and the European Union and, in particular, any arrangements for the United Kingdom to retain access to EU markets after the Transition Period.
Such a withdrawal from the European Union is unprecedented, and it is unclear how the United Kingdom’s access to the European single market for goods, capital, services and labor within the European Union, or single market, and the wider commercial, legal and regulatory environment, will impact our U.K. operations and customers. Our U.K. operations service customers in the United Kingdom as well as in other countries in the European Union and EEA, and these operations could be disrupted by Brexit, particularly if there is a change in the United Kingdom’s long-term relationship to the single market. Additionally, there could be new restrictions on travel and immigration that result from Brexit following the Transition Period that could impair the ability of our employees to travel as necessary in connection with their duties to us or obtain required immigration authorizations to work for us. The occurrence of any such event could subject us to additional costs and impair our ability to complete projects for our clients, which could adversely affect our business, operating results and financial condition.
Fluctuations in currency exchange rates and increased inflation could materially adversely affect our financial condition and results of operations.
We have operations in a number of countries, including Argentina, Austria, Australia, Bulgaria, Colombia, Denmark, Germany, Ireland, North Macedonia, Moldova, the Netherlands, Romania, Serbia, Singapore, the United Kingdom, the United States, Uruguay and Venezuela, and we serve clients across Europe and North America. As part
27
of our acquisition of CDS on August 17, 2020, we acquired new operations in Austria, Bosnia and Herzegovina, Germany, Ireland, Serbia, Slovenia and the United States. As a result of the international scope of our operations, fluctuations in exchange rates, particularly between the British Pound, our reporting currency, and the Euro and U.S. dollar, may adversely affect us. Currency fluctuations related to Brexit and the COVID-19 pandemic had a significant impact on our financial results for the fiscal year ended June 30, 2020. In the fiscal year ended June 30, 2020, 42.9% of our sales were denominated in the British Pound, 29.4% of our sales were denominated in U.S. dollars, 26.1% were denominated in Euros and the balance were in other currencies. Conversely, during the same time period, 74.3% of our expenses were denominated in Euros (or in currencies that largely follow the Euro, including the RON) or U.S. dollars. As a result, strengthening of the Euro or U.S. dollar relative to the British Pound presents the most significant risk to us. Any significant fluctuations in currency exchange rates may have a material impact on our business.
In addition, economies in Central European and Latin American countries have periodically experienced high rates of inflation. Periods of higher inflation may slow economic growth in those countries. As a substantial portion of our expenses (excluding currency losses and changes in deferred tax) are denominated in Euros or in currencies that largely follow the Euro, the relative movement of inflation significantly affects our results of operations. Inflation also is likely to increase some of our costs and expenses, including wages, rents, leases and employee benefit payments, which we may not be able to pass on to our clients and, as a result, may reduce our profitability. To the extent inflation causes these costs to increase, such inflation may materially adversely affect our business. Inflationary pressures could also affect our ability to access financial markets and lead to counter-inflationary measures that may harm our financial condition, results of operations or materially adversely affect the market price of our securities.
Our revenue, margins, results of operations and financial condition may be materially adversely affected if general economic conditions in Europe, the United States or the global economy worsen.
We derive a significant portion of our revenue from clients located in Europe and the United States. The technology services industry is particularly sensitive to the economic environment, and tends to decline during general economic downturns. While the potential economic impact and the duration of the COVID-19 pandemic may be difficult to fully assess or predict, it has resulted in significant economic uncertainty and disruption. If the U.S. or European economies continue to weaken or slow or there is a global economic slowdown, pricing for our services may be depressed and our clients may reduce or postpone their technology spending significantly, which may, in turn, lower the demand for our services and negatively affect our revenue and profitability. A weak or declining economy could also cause our customers to delay making payments for our services. Additionally, any weakening or failure of banking institutions or banking systems, which could be caused by a weakening or slowdown of the U.S., European or global economies, could adversely impact our business, operating results and financial condition and negatively impact our ability to receive and make payments. Brexit and the resulting economic uncertainty could also adversely impact our operating results unless and until economic conditions in Europe improve and the prospect of national debt defaults in Europe decline. To the extent that these adverse economic conditions continued or worsened, they would likely have a negative effect on our business. If we are unable to successfully anticipate changing economic and political conditions affecting the markets in which we operate, we may be unable to effectively plan for or respond to those changes, and our results of operations could be adversely affected.
Our international operations involve risks that could increase our expenses, adversely affect our results of operations and require increased time and attention from our management.
As of June 30, 2020, we had 6,624 employees (including directors), approximately 50.8% of whom work in nearshore delivery centers in European Union countries. We have operations in a number of countries, including Argentina, Austria, Australia, Bulgaria, Colombia, Denmark, Germany, Ireland, North Macedonia, Moldova, the Netherlands, Romania, Serbia, Singapore, the United Kingdom, the United States, Uruguay and Venezuela, and we serve clients across Europe and North America. As part of our acquisition of CDS on August 17, 2020, we acquired new operations in Austria, Bosnia and Herzegovina, Germany, Ireland, Serbia, Slovenia and the United States. As a result, we may be subject to risks inherently associated with international operations. Our global operations expose us to numerous and sometimes conflicting legal, tax and regulatory requirements, and violations or unfavorable interpretation by the respective authorities of these regulations could harm our business. Risks associated with international operations include difficulties in enforcing contractual rights, potential difficulties in collecting accounts receivable, the burdens of complying with a wide variety of foreign laws, repatriation of earnings or capital and the
28
risk of asset seizures by foreign governments. In addition, we may face competition in other countries from companies that may have more experience with operations in such countries or with international operations. Such companies may have long-standing or well-established relationships with desired clients, which may put us at a competitive disadvantage. We may also face difficulties integrating new facilities in different countries into our existing operations, as well as integrating employees that we hire in different countries into our existing corporate culture. Our international expansion plans may not be successful and we may not be able to compete effectively in other countries. These factors could impede the success of our international expansion plans and limit our ability to compete effectively in other countries. Additionally, addressing the operational and other challenges posed by our international operations will require significant time and attention from management, which may divert management's attention from other important matters.
Our business, results of operations and financial condition may be adversely affected by the various conflicting legal and regulatory requirements imposed on us by the countries where we operate.
Since we maintain operations and provide services to clients throughout the world, we are subject to numerous, and sometimes conflicting, legal requirements on matters as diverse as import/export controls, content requirements, trade restrictions, tariffs, taxation, sanctions, government affairs, anti-bribery, whistle blowing, internal and disclosure control obligations, data protection and privacy, labor relations and COVID-19 related regulations and restrictions. Our failure to comply with these regulations in the conduct of our business could result in fines, penalties, criminal sanctions against us or our officers, disgorgement of profits, prohibitions on doing business, unfavorable publicity, adverse impact on our reputation and allegations by our clients that we have not performed our contractual obligations. Due to the varying degree of development of the legal systems of the countries in which we operate, local laws might be insufficient to defend us and preserve our rights.
We are also subject to risks relating to compliance with a variety of national and local laws including multiple tax regimes, labor laws, employee health safety and wages and benefits laws. We may, from time to time, be subject to litigation or administrative actions resulting from claims against us by current or former employees individually or as part of class actions, including claims of wrongful terminations, discrimination, misclassification or other violations of labor law or other alleged conduct. We may also, from time to time, be subject to litigation resulting from claims against us by third parties, including claims of breach of non-compete and confidentiality provisions of our employees’ former employment agreements with such third parties. Our failure to comply with applicable regulatory requirements could have a material adverse effect on our revenue, business, results of operations and financial condition.
Many commercial laws and regulations in Central Europe and Latin America are relatively new and have been subject to limited interpretation. As a result, their application can be unpredictable. Government authorities have a high degree of discretion in certain countries in which we have operations and at times have exercised their discretion in ways that may be perceived as selective or arbitrary, and sometimes in a manner that is seen as being influenced by political or commercial considerations. These governments also have the power, in certain circumstances, to interfere with the performance of, nullify or terminate contracts. Selective or arbitrary actions have included withdrawal of licenses, sudden and unexpected tax audits, criminal prosecutions and civil actions. Federal and local government entities have also used common defects in documentation as pretexts for court claims and other demands to invalidate and/or to void transactions, apparently for political purposes. In this environment, our competitors could receive preferential treatment from the government, potentially giving them a competitive advantage. Selective or arbitrary government action could materially adversely affect our business, financial condition and results of operations.
29
Litigation or legal proceedings could expose us to significant liabilities and have a negative impact on our reputation or business.
From time to time, we may be party to various claims and litigation proceedings. We evaluate these claims and litigation proceedings to assess the likelihood of unfavorable outcomes and to estimate, if possible, the amount of potential losses. Based on these assessments and estimates, we may establish reserves, as appropriate. These assessments and estimates are based on the information available to management at the time and involve a significant amount of management judgment. Actual outcomes or losses may differ materially from our assessments and estimates. We are not currently party to any material litigation.
Even when not merited, the defense of these lawsuits may divert our management’s attention, and we may incur significant expenses in defending these lawsuits. The results of litigation and other legal proceedings are inherently uncertain, and adverse judgments or settlements in some of these legal disputes may result in adverse monetary damages, penalties or injunctive relief against us, which could have a material adverse effect on our financial position, cash flows or results of operations. Any claims or litigation, even if fully indemnified or insured, could damage our reputation and make it more difficult to compete effectively or to obtain adequate insurance in the future.
Furthermore, while we maintain insurance for certain potential liabilities, such insurance does not cover all types and amounts of potential liabilities and is subject to various exclusions as well as caps on amounts recoverable. Even if we believe a claim is covered by insurance, insurers may dispute our entitlement to recovery for a variety of potential reasons, which may affect the timing and, if the insurers prevail, the amount of our recovery.
Changes and uncertainties in the tax system in the countries in which we have operations, could materially adversely affect our financial condition and results of operations.
We conduct business globally and file income tax returns in multiple jurisdictions. Our consolidated effective income tax rate could be materially adversely affected by several factors, including: changing tax laws, regulations and treaties, or the interpretation thereof; tax policy initiatives and reforms under consideration (such as those related to the Organization for Economic Co-Operation and Development’s, or OECD, Base Erosion and Profit Shifting, or BEPS, Project, BEPS 2.0, the European Commission’s state aid investigations and other initiatives); the practices of tax authorities in jurisdictions in which we operate; the cancellation of or alteration to relevant tax incentive regimes; the resolution of issues arising from tax audits or examinations and any related interest or penalties. Such changes may include (but are not limited to) the taxation of operating income, investment income, dividends received or (in the specific context of withholding tax) dividends paid.
In particular, there have been significant changes to the taxation systems in Central European countries and also in Argentina and the United States in recent years as the authorities have gradually replaced or introduced new legislation regulating the application of major taxes such as corporate income tax, VAT, corporate property tax, personal income taxes and payroll taxes. In addition, if the United Kingdom is unable to agree to an exit deal with the European Union that includes exemption of withholding tax on dividends between U.K. and E.U. resident group members, profits recognized by us in Romania may become subject to a 5% withholding tax on distributions to us.
We are unable to predict what tax reforms may be proposed or enacted in the future or what effect such changes would have on our business, but such changes, to the extent they are brought into tax legislation, regulations, policies or practices in jurisdictions in which we operate, could increase the estimated tax liability that we have expensed to date and paid or accrued on our balance sheets, and otherwise affect our financial position, future results of operations, cash flows in a particular period and overall or effective tax rates in the future in countries where we have operations, reduce post-tax returns to our shareholders and increase the complexity, burden and cost of tax compliance.
There may be adverse tax and employment law consequences if the independent contractor status of some of our personnel or the exempt status of our employees is successfully challenged.
We retain certain of our workforce as independent contractors, which has increased due to our recent acquisitions, and the determination of whether an individual is considered an independent contractor or an employee typically varies by jurisdiction and depends on the interpretation of the applicable laws. If there is a change in law or regulation, such as the changes to the rules often referred to as “IR35” or the “off-payroll working rules” in the United
30
Kingdom that are due to apply from April 2021, or a government authority or court makes a determination with respect to the requirements for being an independent contractor that differs from our approach either generally or specifically against an independent contractor who works for us, then we could incur significant costs. These could include increased employee benefits costs as well as withholding and other taxes, and could apply to previous periods. Furthermore, any such change in law or regulation or government or court determination could negatively impact how we structure our business and who we hire, which along with any increase in our costs, could materially adversely affect our business, financial condition and results of operations and increase the difficulty in attracting and retaining personnel.
Tax authorities may disagree with our positions and conclusions regarding certain tax positions, or may apply existing rules in an arbitrary or unforeseen manner, resulting in unanticipated costs, taxes or non-realization of expected benefits.
A tax authority may disagree with tax positions that we have taken, which could result in increased tax liabilities. For example, Her Majesty’s Revenue & Customs, or HMRC, the U.S. Internal Revenue Service or another tax authority could challenge our allocation of income by tax jurisdiction and the amounts paid between our affiliated companies pursuant to our intercompany arrangements and transfer pricing policies, including methodologies for valuing developed technology and amounts paid with respect to our intellectual property development. Similarly, a tax authority could assert that we are subject to tax in a jurisdiction where we believe we have not established a taxable connection, often referred to as a “permanent establishment” under international tax treaties, and such an assertion, if successful, could increase our expected tax liability in one or more jurisdictions. In particular, tax authorities in Central European countries have been aggressive in their interpretation of tax laws and their many ambiguities, as well as in their enforcement and collection activities.
For example, a tax authority may take the position that material income tax liabilities, interest and penalties are payable by us, where there has been a technical violation of contradictory laws and regulations that are relatively new and have not been subject to extensive review or interpretation, in which case we expect that we might contest such assessment. High-profile companies can be particularly vulnerable to aggressive application of unclear requirements. Many companies must negotiate their tax bills with tax inspectors who may demand higher taxes than applicable law appears to provide. Contesting such an assessment may be lengthy and costly and if we were unsuccessful in disputing the assessment, the implications could increase our anticipated effective tax rate, where applicable.
We do not anticipate being treated as a passive foreign investment company, or PFIC, for U.S. federal income tax purposes for the current taxable year, but this conclusion is a factual determination that is made annually and thus may be subject to change. If we were to qualify as a PFIC, this could result in adverse U.S. tax consequences to certain U.S. holders.
Generally, if, for any taxable year, at least 75% of our gross income is passive income, or on average at least 50% of the value of our assets is attributable to assets that produce passive income or are held for the production of passive income, including cash, we would be characterized as a PFIC for U.S. federal income tax purposes. For purposes of these tests, passive income generally includes dividends, interest, and gains from the sale or exchange of investment property and rents and royalties other than rents and royalties which are received from unrelated parties in connection with the active conduct of a trade or business. Our status as a PFIC depends on the composition of our income and the composition and value of our assets (for which purpose the total value of our assets may be determined in part by the market value of our ADSs representing Class A ordinary shares, which are subject to change) from time to time. If we are characterized as a PFIC, U.S. holders of our ADSs may suffer adverse U.S. tax consequences, including having gains realized on the sale of our ADSs treated as ordinary income, rather than capital gain, the loss of the preferential rate applicable to dividends received on our ADSs by individuals who are U.S. holders, and having interest charges apply to distributions by us and the proceeds of sales of ADSs.
Although PFIC status is determined on an annual basis and generally cannot be determined until the end of the taxable year, based on the nature of our current and expected income and the current and expected value and composition of our assets, we believe we were not a PFIC for our 2019 tax year and we do not expect to be a PFIC for our current taxable year. However, our status as a PFIC is a fact-intensive determination made on an annual basis, and we cannot provide any assurances regarding our PFIC status for the current, prior or future taxable years. See “Taxation—U.S.
31
Federal Income Tax Considerations for U.S. Holders—Passive Foreign Investment Company Rules” for a further discussion of the PFIC rules.
Emerging markets are subject to greater risks than more developed markets, and financial turmoil in any emerging market could disrupt our business.
Central European and Latin American countries are generally considered to be emerging markets, which are subject to rapid change and greater legal, economic and political risks than more established markets. Financial problems or an increase in the perceived risks associated with investing in emerging economies could dampen foreign investment in Central Europe and Latin America and adversely affect the economy of the region. Political instability could result in a worsening overall economic situation, including capital flight and slowdown of investment and business activity. Current and future changes in governments of the countries in which we have or develop operations, as well as major policy shifts or lack of consensus between various branches of the government and powerful economic groups, could lead to political instability and disrupt or reverse political, economic and regulatory reforms, which could materially adversely affect our business and operations in those countries. In addition, political and economic relations between certain of the countries in which we operate are complex, and recent conflicts have arisen between certain of their governments. Political, ethnic, religious, historical and other differences have, on occasion, given rise to tensions and, in certain cases, military conflicts among Central European or Latin American countries which can halt normal economic activity and disrupt the economies of neighboring regions. The emergence of new or escalated tensions in Central European or Latin American countries could further exacerbate tensions between such countries and the United Kingdom, the United States and the European Union, which may have a negative effect on their economy, our ability to develop or maintain our operations in those countries and our ability to attract and retain employees, any of which could materially adversely affect our business and operations.
In addition, banking and other financial systems in certain countries in which we have operations are less developed and regulated than in some more developed markets, and legislation relating to banks and bank accounts is subject to varying interpretations and inconsistent application. Banks in these regions often do not meet the banking standards of more developed markets, and the transparency of the banking sector lags behind international standards. Furthermore, in certain countries in which we operate, bank deposits made by corporate entities generally either are not insured or are insured only to specified limits. As a result, the banking sector remains subject to periodic instability. Another banking crisis, or the bankruptcy or insolvency of banks through which we receive or with which we hold funds may result in the loss of our deposits or adversely affect our ability to complete banking transactions in certain countries in which we have operations, which could materially adversely affect our business and financial condition.
Wage inflation and other compensation expense for our IT professionals could adversely affect our financial results.
Wage costs for IT professionals in Central European and Latin American countries are lower than comparable wage costs in more developed countries. However, wage costs in the technology services industry in these countries may increase at a faster rate than in the past and wage inflation for the IT industry may be higher than overall wage inflation within these countries. We may need to increase the levels of employee compensation more rapidly than in the past to remain competitive, and we may not be able to pass on these increased costs to our clients. Unless we are able to continue to increase the efficiency and productivity of our employees as well as the prices we can charge for our services, wage inflation may materially adversely affect our financial condition and results of operations.
We are subject to the U.K. Bribery Act, the U.S. Foreign Corrupt Practices Act and other anti-corruption laws, as well as export control laws, import and customs laws, trade and economic sanctions laws and other laws governing our operations.
Our operations are subject to anti-corruption laws, including the U.K. Bribery Act 2010, or the Bribery Act, the U.S. Foreign Corrupt Practices Act of 1977, as amended, or the FCPA, the U.S. domestic bribery statute contained in 18 U.S.C. §201, the U.S. Travel Act, and other anti-corruption laws that apply in countries where we do business. The Bribery Act, the FCPA and these other laws generally prohibit us and our employees and intermediaries from authorizing, promising, offering, or providing, directly or indirectly, improper or prohibited payments, or anything else of value, to government officials or other persons to obtain or retain business or gain some other business advantage. Under the Bribery Act, we may also be liable for failing to prevent a person associated with us from committing a bribery offense. We operate in a number of jurisdictions that pose a high risk of potential Bribery Act or FCPA violations. In addition,
32
we cannot predict the nature, scope or effect of future regulatory requirements to which our international operations might be subject or the manner in which existing laws might be administered or interpreted.
We are also subject to other laws and regulations governing our international operations, including regulations administered by the governments of the United Kingdom and the United States, and authorities in the European Union, including applicable export control regulations, economic sanctions and embargoes on certain countries and persons, anti-money laundering laws, import and customs requirements and currency exchange regulations, collectively referred to as the Trade Control laws. We may not be completely effective in ensuring our compliance with all such applicable laws, which could result in our being subject to criminal and civil penalties, disgorgement and other sanctions and remedial measures, and legal expenses. Likewise, any investigation of any potential violations of such laws by United Kingdom, United States or other authorities could also have an adverse impact on our reputation, our business, results of operations and financial condition.
Risks Related to Our ADSs and the Trading of Our ADSs
We have identified material weaknesses in our disclosure controls and internal controls over financial reporting. If we fail to remediate the material weaknesses and maintain an effective system of disclosure controls and internal control over financial reporting, our ability to produce timely and accurate financial statements or comply with applicable regulations could be impaired, and the trading price of our ADSs may be negatively impacted.
As a public company, we are required, pursuant to Section 404 of the Sarbanes-Oxley Act, or Section 404, to furnish a report by management on, among other things, the effectiveness of our internal control over financial reporting for the fiscal year ended June 30, 2020. This assessment is required to include disclosure of any material weaknesses identified by our management in our internal control over financial reporting. Effective July 1, 2020, we are no longer an “emerging growth company,” as defined in the JOBS Act. As a result, we are also required to have our independent registered public accounting firm issue an opinion on the effectiveness of our internal control over financial reporting on an annual basis.
As disclosed in Item 15, for the fiscal year ended June 30, 2020, we identified material weaknesses in internal controls related to (i) effective risk assessment processes, (ii) training and knowledge of the COSO 2013 Framework and (iii) information technology general controls (ITGCs), policies and procedures. While we are actively engaged in implementing remedial measures, we cannot assure you that these measures will be effective. We also cannot assure you that there will not be additional material weaknesses or significant deficiencies in our internal control over financial reporting in the future. Any additional or sustained failure to maintain internal control over financial reporting could severely inhibit our ability to accurately report our financial condition or results of operations. If we are unable to remediate the material weaknesses or to conclude in the future that our internal control over financial reporting is effective, or if our independent registered public accounting firm determines we have additional material weaknesses in our internal control over financial reporting, we could lose investor confidence in the accuracy and completeness of our financial reports, the market price of our ADSs could decline, and we could be subject to sanctions or investigations by the New York Stock Exchange, the SEC or other regulatory authorities. Failure to remedy any material weaknesses in our internal control over financial reporting, or to implement or maintain other effective control systems required of public companies, could also restrict our future access to the capital markets. For details of the controls, material weaknesses and our remediation plan, see the section of this annual report entitled “Item 15. Controls and Procedures-A.-Disclosure Controls and Procedures.”
Our share price may be volatile or may decline regardless of our operating performance.
The trading price of our ADSs has fluctuated, and is likely to continue to fluctuate. The trading price of our ADSs depends on a number of factors, many of which are beyond our control and may not be related to our operating performance, including:
• |
actual or anticipated fluctuations in our financial condition and operating results; |
• |
variance in our financial performance from expectations of securities analysts; |
• |
changes in the prices of our services; |
33
• |
changes in our projected operating and actual financial results; |
• |
changes in laws or regulations applicable to our business; |
• |
announcements by us or our competitors of significant business developments, acquisitions or new offerings; |
• |
our involvement in any litigation; |
• |
our sale of our ADSs or other securities in the future; |
• |
changes in senior management or key personnel; |
• |
the trading volume of our ADSs; |
• |
changes in the anticipated future size and growth rate of our market; |
• |
natural disasters, pandemics, including the ongoing COVID-19 pandemic, acts of terrorism and other events beyond our control; and |
• |
general economic, regulatory, political and market conditions. |
Stock markets frequently experience price and volume fluctuations that affect the market prices of equity securities of many companies. These fluctuations have often been unrelated or disproportionate to the operating performance of those companies. Broad market and industry fluctuations, as well as general economic, political, regulatory and market conditions, may negatively impact the market price of our ADSs. In the past, companies that have experienced volatility in the market price of their securities have been subject to securities class action litigation. We may be the target of this type of litigation in the future, which could result in substantial costs and divert our management’s attention.
An active public trading market for our ADSs may not be sustained.
Prior to the completion of our initial public offering, no public market existed for our securities. An active public trading market for our ADSs may not be sustained. The lack of an active market may impair your ability to sell your ADSs at the time you wish to sell them or at a price that you consider reasonable. The lack of an active market may also reduce the fair value of your ADSs. An inactive market may also impair our ability to raise capital to continue to fund operations by selling ADSs and may impair our ability to acquire other companies or technologies by using our ADSs as consideration.
Future sales of our ADSs by existing shareholders could cause the market price of our ADSs to decline.
Sales of a substantial number of our ADSs in the public market by our existing shareholders, or the perception that these sales might occur, could depress the market price of our ADSs and could impair our ability to raise capital through the sale of additional equity securities. We are unable to predict the effect that such sales may have on the prevailing market price of our ADSs.
Our articles of association provides for various selling restrictions, including that (i) each holder of Class B ordinary shares may not dispose of (a) more than 40% of the Class B ordinary shares held by such holder as of July 26, 2018 in the three-year period following July 26, 2018 (including by conversion to Class A ordinary shares) and (b) more than 60% of the Class B ordinary shares held by such holder as of July 26, 2018 in the five-year period following July 26, 2018 (including by conversion to Class A ordinary shares), and (ii) each holder of Class C ordinary shares may not dispose of more than 25% of the Class C ordinary shares held by such holder as of July 26, 2018 in the 18-month period following July 26, 2018 (including by conversion to Class A ordinary shares). As of June 30, 2020, we had 39,731,004 outstanding ordinary shares, which were not subject to lock-ups or selling restrictions. As of January 26, 2020, all of the selling restrictions on our Class C ordinary shares had lapsed, and on July 26, 2020, all of our Class C ordinary shares automatically converted to Class A ordinary shares. Accordingly, as of August 15, 2020, we had 34,082,461 outstanding ordinary shares, which were not subject to lock-ups or selling restrictions.
In addition, as of June 30, 2020 there were outstanding 2,950,068 Class A ordinary shares issuable by us upon exercise of outstanding share options or the vesting of restricted share units, or RSUs. We have registered all of the
34
ADSs representing Class A ordinary shares issuable upon exercise of outstanding options or the vesting of RSUs, and upon exercise of settlement of any options or other equity incentives we may grant in the future, for public resale under the Securities Act. Accordingly, these shares will be able to be freely sold in the public market upon issuance as permitted by any applicable vesting requirements, subject to restrictions on sales of our shares by affiliates.
Shareholder protections found in provisions under the U.K. City Code on Takeovers and Mergers, or the Takeover Code, will not apply if our place of management and control is considered to change to outside the United Kingdom.
The Takeover Code applies to all offers for public limited companies incorporated in England and Wales which have their registered offices in the United Kingdom and which are considered by the Panel on Takeovers and Mergers, or the Takeover Panel, to have their place of central management and control in the United Kingdom.
On July 6, 2018, we re-registered as a public limited company incorporated in England and Wales. Our place of central management and control was at that time, and remains in, the United Kingdom for the purposes of the Takeover Code. Accordingly, we are currently subject to the Takeover Code and, as a result, our shareholders are entitled to the benefit of the various protections provided under the Takeover Code. The Takeover Code provides a framework within which takeovers of companies are regulated and conducted. If, at the time of a takeover offer, the Takeover Panel determines that we do not have our place of central management and control in the United Kingdom, then the Takeover Code would not apply to us and our shareholders would not be entitled to the benefit of the various protections that the Takeover Code affords. In particular, the rules regarding mandatory takeover bids described below would not apply. The following is a brief summary of some of the most important rules of the Takeover Code:
• |
When any person acquires, whether by a series of transactions over a period of time or not, an interest in shares which (taken together with shares already held by that person and an interest in shares held or acquired by persons acting in concert with him or her) carry 30% or more of the voting rights of a company that is subject to the Takeover Code, that person is generally required to make a mandatory offer to all the holders of any class of equity share capital or other class of transferable securities carrying voting rights in that company to acquire the balance of their interests in the company. |
• |
When any person who, together with persons acting in concert with him or her, is interested in shares representing not less than 30% but does not hold more than 50% of the voting rights of a company that is subject to the Takeover Code, and such person, or any person acting in concert with him or her, acquires an additional interest in shares which increases the percentage of shares carrying voting rights in which he or she is interested, then such person is generally required to make a mandatory offer to all the holders of any class of equity share capital or other class of transferable securities carrying voting rights of that company to acquire the balance of their interests in the company. |
• |
A mandatory offer triggered in the circumstances described in the two paragraphs above must be in cash (or be accompanied by a cash alternative) and at not less than the highest price paid within the preceding 12 months to acquire any interest in shares in the company by the person required to make the offer or any person acting in concert with him or her. |
• |
In relation to a voluntary offer (i.e. any offer which is not a mandatory offer), when interests in shares representing 10% or more of the shares of a class have been acquired for cash by an offeror (i.e., a bidder) and any person acting in concert with it in the offer period and the previous 12 months, the offer must be in cash or include a cash alternative for all shareholders of that class at not less than the highest price paid for any interest in shares of that class by the offeror and by any person acting in concert with it in that period. Further, if an offeror acquires for cash any interest in shares during the offer period, a cash alternative must be made available at not less than the highest price paid for any interest in the shares of that class. |
• |
If the offeror or any person acting in concert with it acquires an interest in shares in the offeree company (i.e., the target) at a price higher than the value of the offer, the offer must be increased to not less than the highest price paid for the interest in shares so acquired. |
35
• |
The offeree company must obtain competent advice as to whether the terms of any offer are fair and reasonable and the substance of such advice must be made known to all the shareholders, together with the opinion of the board of directors of the offeree company. |
• |
Special deals with favorable conditions for selected shareholders are not permitted. |
• |
All shareholders must be given the same information. |
• |
Each document published in connection with an offer by or on behalf of the offeror or offeree must state that the directors of the offeror or the offeree, as the case may be, accept responsibility for the information contained therein. |
• |
Profit forecasts, quantified financial benefits statements and asset valuations must be made to specified standards and must be reported on by professional advisers. |
• |
Misleading, inaccurate or unsubstantiated statements made in documents or to the media must be publicly corrected immediately. |
• |
Actions during the course of an offer by the offeree company, which might frustrate the offer, are generally prohibited unless shareholders approve these plans. |
• |
Stringent and detailed requirements are laid down for the disclosure of dealings in relevant securities during an offer. |
Employee representatives or employees of both the offeror and the offeree company and the trustees of the offeree company’s pension scheme must be informed about an offer. In addition, the offeree company’s employee representatives and pension scheme trustees have the right to have a separate opinion on the effects of the offer on employment and pension scheme(s), respectively, appended to the offeree board of directors’ circular or published on a website.
The dual class structure of our ordinary shares has the effect of concentrating voting control for the foreseeable future, which will limit your ability to influence corporate matters.
Our Class B ordinary shares have 10 votes per share, and our Class A ordinary shares, which are the shares underlying the ADSs have one vote per share. Given the greater number of votes per share attributed to our Class B ordinary shares, holders of Class B ordinary shares collectively beneficially hold shares representing approximately 86.4% of the voting rights of our outstanding share capital as of August 15, 2020. Further, John Cotterell, our Chief Executive Officer, beneficially holds Class B ordinary shares representing approximately 39.8% of the voting rights of our outstanding share capital as of August 15, 2020. Consequently, Mr. Cotterell will continue to be able to have a significant influence on corporate matters submitted to a vote of shareholders. Notwithstanding this concentration of control, we do not currently qualify as a “controlled company” under New York Stock Exchange listing rules.
This concentrated control will limit your ability to influence corporate matters for the foreseeable future. This concentrated control could also discourage a potential investor from acquiring our ADSs due to the limited voting power of the Class A ordinary shares underlying the ADSs relative to the Class B ordinary shares and might harm the market price of our ADSs. In addition, Mr. Cotterell has the ability to control the management and major strategic investments of our company as a result of his position as our Chief Executive Officer. As a member of our board of directors, Mr. Cotterell owes statutory and fiduciary duties to us and must act in good faith and in a manner that he considers would be most likely to promote the success of our company for the benefit of our shareholders as a whole. As a shareholder, Mr. Cotterell is entitled to vote his shares in his own interests, which may not always be in the interests of our shareholders generally. For a description of our dual class structure, see “Description of Share Capital and Articles of Association.”
Future transfers by other holders of Class B ordinary shares will generally result in those shares converting on a one-to-one basis to Class A ordinary shares, subject to limited exceptions, such as certain transfers effected for estate planning purposes. The conversion of our Class B ordinary shares into Class A ordinary shares will have the effect, over time, of increasing the relative voting power of those holders of Class B ordinary shares who retain their shares in the long-term.
36
We cannot predict the impact our dual class share structure may have on our ADS price or our business.
We cannot predict whether our dual class share structure, combined with the concentrated control of our shareholders who held our ordinary shares prior to the completion of our initial public offering, including our executive officers, employees and directors and their affiliates, will result in a lower or more volatile market price of our ADSs or in adverse publicity or other adverse consequences. For example, certain index providers have announced restrictions on including companies with multiple-class share structures in certain of their indexes. In July 2017, FTSE Russell announced that it plans to require new constituents of its indexes to have greater than 5% of the company's voting rights in the hands of public shareholders, and S&P Dow Jones announced that it will no longer admit companies with multiple-class share structures to certain of its indexes. Because of our dual class structure, we will likely be excluded from these indexes and we cannot assure you that other stock indexes will not take similar actions. Given the sustained flow of investment funds into passive strategies that seek to track certain indexes, exclusion from stock indexes would likely preclude investment by many of these funds and could make our ADSs less attractive to other investors. As a result, the market price of our ADSs could be adversely affected.
The rights of our shareholders may differ from the rights typically offered to shareholders of a U.S. corporation.
We are incorporated under English law. The rights of holders of ordinary shares and, therefore, certain of the rights of holders of our ADSs, are governed by English law, including the provisions of the Companies Act 2006, or the Companies Act, and by our Articles of Association. These rights differ in certain respects from the rights of shareholders in typical U.S. corporations. See “Item 10.B—Memorandum and Articles of Association” and “Item 16.G—Corporate Governance” in this Annual Report on Form 20-F for a description of the principal differences between the provisions of the Companies Act applicable to us and, for example, the Delaware General Corporation Law relating to shareholders' rights and protections.
Holders of our ADSs have fewer rights than our shareholders and must act through the depositary to exercise their rights.
Holders of our ADSs do not have the same rights as our shareholders and may only exercise their voting rights with respect to the underlying Class A ordinary shares in accordance with the provisions of the deposit agreement. Holders of the ADSs have appointed the depositary or its nominee as their representative to exercise the voting rights attaching to the Class A ordinary shares represented by the ADSs. When a general meeting is convened, if you hold ADSs, you may not receive sufficient notice of a shareholders’ meeting to permit you to withdraw the Class A ordinary shares underlying your ADSs to allow you to vote directly with respect to any specific matter. We will make all commercially reasonable efforts to cause the depositary to extend voting rights to you in a timely manner, but we cannot assure you that you will receive voting materials in time to instruct the depositary to vote, and it is possible that you, or persons who hold their ADSs through brokers, dealers or other third parties, will not have the opportunity to exercise a right to vote. Furthermore, the depositary will not be liable for any failure to carry out any instructions to vote, for the manner in which any vote is cast or for the effect of any such vote. As a result, you may not be able to exercise your right to vote and you may lack recourse if your ADSs are not voted as you request. In addition, in your capacity as an ADS holder, you will not be able to call a shareholders’ meeting. See “Item 12.D—Description of American Depositary Shares.”
Holders of our ADSs may face limitations on transfer and withdrawal of underlying Class A ordinary shares.
Our ADSs, which may be evidenced by ADRs, are transferable on the books of the depositary. However, the depositary may close its books at any time or from time to time when it deems expedient in connection with the performance of its duties. The depositary may refuse to deliver, transfer or register transfers of your ADSs generally when our books or the books of the depositary are closed, or at any time if we or the depositary think it is advisable to do so because of any requirement of law, government or governmental body, or under any provision of the deposit agreement, or for any other reason subject to your right to cancel your ADSs and withdraw the underlying Class A ordinary shares. Temporary delays in the cancellation of your ADSs and withdrawal of the underlying Class A ordinary shares may arise because the depositary has closed its transfer books or we have closed our transfer books, the transfer of ordinary shares is blocked to permit voting at a shareholders’ meeting or we are paying a dividend on our Class A ordinary shares. In addition, you may not be able to cancel your ADSs and withdraw the underlying Class A ordinary shares when you owe money for fees, taxes and similar charges and when it is necessary to prohibit withdrawals in
37
order to comply with any laws or governmental regulations that apply to ADSs or to the withdrawal of Class A ordinary shares or other deposited securities. See “Item 12.D—Description of American Depositary Shares.”
ADS holders may not be entitled to a jury trial with respect to claims arising under the deposit agreement, which could result in less favorable outcomes to the plaintiff(s) in any such action.
The deposit agreement governing the ADSs representing our Class A ordinary shares provides that holders and beneficial owners of ADSs irrevocably waive the right to a trial by jury in any legal proceeding arising out of or relating to the deposit agreement or the ADSs, including in respect of claims under federal securities laws, against us or the depositary to the fullest extent permitted by applicable law. If this jury trial waiver provision is prohibited by applicable law, an action could nevertheless proceed under the terms of the deposit agreement with a jury trial. To our knowledge, the enforceability of a jury trial waiver under the federal securities laws has not been finally adjudicated by a federal court. However, we believe that a jury trial waiver provision is generally enforceable under the laws of the State of New York, which govern the deposit agreement, by a court of the State of New York or a federal court, which have non-exclusive jurisdiction over matters arising under the deposit agreement, applying such law. In determining whether to enforce a jury trial waiver provision, New York courts and federal courts will consider whether the visibility of the jury trial waiver provision within the agreement is sufficiently prominent such that a party has knowingly waived any right to trial by jury. We believe that this is the case with respect to the deposit agreement and the ADSs. In addition, New York courts will not enforce a jury trial waiver provision in order to bar a viable setoff or counterclaim sounding in fraud or one which is based upon a creditor's negligence in failing to liquidate collateral upon a guarantor's demand, or in the case of an intentional tort claim (as opposed to a contract dispute), none of which we believe are applicable in the case of the deposit agreement or the ADSs. No condition, stipulation or provision of the deposit agreement or ADSs serves as a waiver by any holder or beneficial owner of ADSs or by us or the depositary of compliance with any provision of the federal securities laws. If you or any other holder or beneficial owner of ADSs brings a claim against us or the depositary in connection with such matters, you or such other holder or beneficial owner may not be entitled to a jury trial with respect to such claims, which may have the effect of limiting and discouraging lawsuits against us and/or the depositary. If a lawsuit is brought against us and/or the depositary under the deposit agreement, it may be heard only by a judge or justice of the applicable trial court, which would be conducted according to different civil procedures and may result in different outcomes than a trial by jury would have had, including results that could be less favorable to the plaintiff(s) in any such action, depending on, among other things, the nature of the claims, the judge or justice hearing such claims, and the venue of the hearing.
Claims of U.S. civil liabilities may not be enforceable against us.
We are incorporated under English law. Substantially all of our assets are located outside the United States. The majority of our senior management and board of directors reside outside the United States. As a result, it may not be possible for investors to effect service of process within the United States upon such persons or to enforce judgments obtained in U.S. courts against them or us, including judgments predicated upon the civil liability provisions of the U.S. federal securities laws.
The United States and the United Kingdom do not currently have a treaty providing for recognition and enforcement of judgments (other than arbitration awards) in civil and commercial matters. Consequently, a final judgment for payment given by a court in the United States, whether or not predicated solely upon U.S. securities laws, would not automatically be recognized or enforceable in the United Kingdom. In addition, uncertainty exists as to whether U.K. courts would entertain original actions brought in the United Kingdom against us or our directors or senior management predicated upon the securities laws of the United States or any state in the United States. Any final and conclusive monetary judgment for a definite sum obtained against us in U.S. courts would be treated by the courts of the United Kingdom as a cause of action in itself and sued upon as a debt at common law so that no retrial of the issues would be necessary, provided that certain requirements are met. Whether these requirements are met in respect of a judgment based upon the civil liability provisions of the U.S. securities laws, including whether the award of monetary damages under such laws would constitute a penalty, is an issue for the court making such decision. If an English court gives judgment for the sum payable under a U.S. judgment, the English judgment will be enforceable by methods generally available for this purpose. These methods generally permit the English court discretion to prescribe the manner of enforcement.
38
As a result, U.S. investors may not be able to enforce against us or our senior management, board of directors or certain experts named herein who are residents of the United Kingdom or countries other than the United States any judgments obtained in U.S. courts in civil and commercial matters, including judgments under the U.S. federal securities laws.
As a foreign private issuer, we are exempt from a number of rules under the U.S. securities laws and are permitted to file less information with the SEC than U.S. public companies.
We are a “foreign private issuer,” as defined in the SEC rules and regulations and, consequently, we are not subject to all of the disclosure requirements applicable to companies organized within the United States. For example, we are exempt from certain rules under the U.S. Securities Exchange Act of 1934, as amended, or the Exchange Act, that regulate disclosure obligations and procedural requirements related to the solicitation of proxies, consents or authorizations applicable to a security registered under the Exchange Act. In addition, our officers and directors are exempt from the reporting and “short-swing” profit recovery provisions of Section 16 of the Exchange Act and related rules with respect to their purchases and sales of our securities. Further, we are not required to comply with Regulation FD, which restricts the selective disclosure of material information. Moreover, we are not required to file periodic reports and financial statements with the SEC as frequently or as promptly as U.S. public companies. Accordingly, there may be less publicly available information concerning our company than there is for U.S. public companies.
As a foreign private issuer, we file annual reports on Form 20-F within four months of the close of each fiscal year ended June 30 and reports on Form 6-K relating to certain material events promptly after we publicly announce these events. However, because of the above exemptions for foreign private issuers, our shareholders are not afforded the same protections or information generally available to investors holding shares in public companies organized in the United States.
While we are a foreign private issuer, we are not subject to certain New York Stock Exchange corporate governance listing standards applicable to U.S. listed companies.
We are entitled to rely on a provision in the New York Stock Exchange’s corporate governance listing standards that allows us to follow English corporate law and the Companies Act with regard to certain aspects of corporate governance. This allows us to follow certain corporate governance practices that differ in significant respects from the corporate governance requirements applicable to U.S. companies listed on the New York Stock Exchange.
For example, we are exempt from New York Stock Exchange regulations that require a listed U.S. company to (1) have a majority of the board of directors consist of independent directors, (2) require regularly scheduled executive sessions with only independent directors each year and (3) have a remuneration committee or a nominations or corporate governance committee consisting entirely of independent directors.
In accordance with our New York Stock Exchange listing, our audit committee is required to comply with the provisions of Section 301 of the Sarbanes-Oxley Act of 2002, or the Sarbanes-Oxley Act, and Rule 10A-3 of the Exchange Act, both of which are also applicable to New York Stock Exchange-listed U.S. companies. Because we are a foreign private issuer, however, our audit committee is not subject to additional New York Stock Exchange requirements applicable to listed U.S. companies, including an affirmative determination that all members of the audit committee are “independent,” using more stringent criteria than those applicable to us as a foreign private issuer. Furthermore, the New York Stock Exchange’s corporate governance listing standards require listed U.S. companies to, among other things, seek shareholder approval for the implementation of certain equity compensation plans and issuances of ordinary shares, which we are not required to follow as a foreign private issuer.
We may lose our foreign private issuer status, which would then require us to comply with the Exchange Act's domestic reporting regime and cause us to incur significant legal, accounting and other expenses.
As a foreign private issuer, we are not required to comply with all of the periodic disclosure and current reporting requirements of the Exchange Act applicable to U.S. domestic issuers. We may no longer be a foreign private issuer when such status is assessed as of December 31, 2020 (the end of our second fiscal quarter), which would require us to comply with all of the periodic disclosure and current reporting requirements of the Exchange Act applicable to U.S. domestic issuers as of July 1, 2021. In order to maintain our current status as a foreign private issuer, either (a) a majority
39
of our ordinary shares must be either directly or indirectly owned of record by non-residents of the United States or (b)(1) a majority of our executive officers or directors cannot be U.S. citizens or residents, (2) more than 50 percent of our assets must be located outside the United States and (3) our business must be administered principally outside the United States. If we lose our status as a foreign private issuer, we would be required to comply with the Exchange Act reporting and other requirements applicable to U.S. domestic issuers, which are more detailed and extensive than the requirements for foreign private issuers and will require that we prepare our financial statements in accordance with U.S. Generally Accepted Accounting Principles. We may also be required to make changes in our corporate governance practices in accordance with various SEC and rules. The regulatory and compliance costs to us under U.S. securities laws if we are required to comply with the reporting requirements applicable to a U.S. domestic issuer will be significantly higher than the cost we would incur as a foreign private issuer. As a result, we expect that a loss of foreign private issuer status would increase our legal and financial compliance costs and would make some activities highly time consuming and costly.
If securities or industry analysts do not publish research or reports about our business, or publish negative reports about our business, our share price and trading volume could decline.
The trading market for our ADSs depends, in part, on the research and reports that securities or industry analysts publish about us or our business. We do not have any control over these analysts or the content that they publish about us. If our financial performance fails to meet analyst estimates or one or more of the analysts who cover us downgrade our ADSs or change their opinion of our ADSs, our ADS price would likely decline. If one or more of these analysts cease coverage of our company or fail to regularly publish reports on us, we could lose visibility in the financial markets, which could cause our ADS price or trading volume to decline.
We do not intend to pay dividends for the foreseeable future and, as a result, your ability to achieve a return on your investment will depend on appreciation in the price of our ADSs.
We currently intend to retain any future earnings to finance the growth and development of the business and, therefore, we do not anticipate that we will pay any cash dividends on our ordinary shares, including on the Class A ordinary shares underlying our ADSs, in the foreseeable future. Any determination to pay dividends in the future will be at the discretion of our board of directors and will be dependent upon our future financial condition, results of operations and capital requirements, general business conditions and other relevant factors as determined by our board of directors. Accordingly, investors must rely on sales of their ADSs after price appreciation, which may never occur, as the only way to realize any future gains on their investments.
Item 4. Information on the Company
A. History and Development of the Company
Corporate Information
The legal and commercial name of our company is Endava plc. We were originally incorporated in February 2006 as Endava Limited, a private company with limited liability and indefinite life under the laws of England and Wales. In July 2018, we completed a corporate reorganization, pursuant to which all of our shareholders were required to elect to exchange each of the existing ordinary shares in the capital of Endava Limited held by them for the same number of Class B ordinary shares or Class C ordinary shares; provided, that the Endava Limited Guernsey Employee Benefit Trust, or the EBT, exchanged all existing ordinary shares held by it for the same number of Class A ordinary shares. Each Class A ordinary share is entitled to one vote per share and each Class B ordinary share is entitled to ten votes per share. On July 26, 2020, all of our Class C ordinary shares automatically converted to Class A ordinary shares.
On July 6, 2018, we re-registered Endava Limited as a public limited company and our name was changed from Endava Limited to Endava plc. We are registered with the Registrar of Companies in England and Wales under number 5722669, and our registered office is 125 Old Broad Street, London EC2N 1AR, United Kingdom.
Our principal executive office is located at 125 Old Broad Street, London EC2N 1AR, United Kingdom and our telephone number is +44 20 7367 1000. Our agent for service of process in the United States is Endava Inc., located at 757 Third Avenue Suite 1900, New York, NY 10017 and the telephone number for Endava Inc. is +1 (212) 920-7240.
40
Our website address is www.endava.com. Information contained on, or that can be accessed through, our website is not incorporated by reference into this Annual Report on Form 20-F, and you should not consider information on our website to be part of this Annual Report on Form 20-F. The Securities and Exchange Commission, or SEC, maintains a website (http://www.sec.gov) that contains reports, proxy and information statements and other information regarding registrants, such as Endava, that file electronically with the Securities and Exchange Commission.
Our capital expenditures for the years ended June 30, 2020, 2019 and 2018 amounted to £9.7 million, £7.3 million and £5.4 million, respectively. These capital expenditures were related primarily to purchases of property and equipment for our delivery centers and software licenses in Romania, Bulgaria, Moldova, North Macedonia, Serbia and Latin America. We expect our capital expenditures to increase in absolute terms in the near term as we continue to grow our operations. We anticipate our capital expenditures in fiscal 2021 to be financed from cash generated from operations and our cash and cash equivalents. We will continue investing technology services in Europe, Latin America and the United States.
B. Business Overview
Overview
We are a leading next-generation technology services provider and help accelerate disruption by delivering rapid evolution to enterprises. We aid our clients in finding new ways to interact with their customers and users, enabling them to become more engaging, responsive and efficient. Using Distributed Enterprise Agile at scale, we collaborate with our clients, seamlessly integrating with their teams, catalyzing ideation and delivering robust solutions. Our approach to ideation comprises an empathy for user needs, curiosity, creativity and a deep understanding of technologies. From proof of concept, to prototype, to production, we use our engineering expertise to deliver enterprise platforms capable of handling millions of transactions per day. Our people, whom we call Endavans, synthesize creativity, technology and delivery at scale in multi-disciplinary teams, enabling us to support our clients from ideation to production.
Waves of technological change are disrupting the nature of competition in every industry. New technologies have enabled the growth and success of companies that leverage these technologies in every aspect of their businesses, or digital native companies, allowing them to be nimble, innovative, data driven and focused on user experience, often through an Agile development approach. Technology has also increased customer expectations, giving customers the ability to choose not only the products and services that they want, but also where, when and how they want them delivered. Incumbent enterprises must undertake digital transformation of their businesses by leveraging technology in order to meet ever-evolving customer expectations and compete with digital native disruptors. According to International Data Corporation, or IDC, the worldwide market for digital transformation services is expected to grow at a compound annual growth rate of 15.3% through 2023 from approximately $451 billion in 2019.
Technological transformation poses numerous challenges for incumbent enterprises. Incumbent enterprises are often laden with legacy infrastructure and applications that are deeply embedded in core transactional systems, making it difficult to reconcile maintenance of existing infrastructure and applications with a nimble approach to using next-generation technologies. Incumbent enterprises are also often stymied by institutional constraints that impede their ability to solve complex problems and rapidly respond to shifting competitive dynamics, as well as ingrained traditional approaches to development. The Agile methodology stands in stark contrast to the IT-department-driven, legacy approach often used by incumbent enterprises, which is premised on a sequential and siloed structure, involves long development cycles, fails to integrate user feedback and is often more costly. Likewise, internal IT teams at incumbent enterprises often struggle to absorb the rapid pace of technology development and its growing complexity. To effectively harness the power of technology, incumbent enterprises need talent in ideation, strategy, user experience, Agile development and next-generation technologies. While incumbent enterprises have historically looked to traditional information technology, or IT, service providers to undertake technology development projects, these traditional players were built to serve, and remain focused on serving, legacy systems using offshore delivery.
We reimagine the relationship between people and technology and help our clients become digital, experience-driven businesses by assisting them in their journey from idea generation to development and deployment of products, platforms and solutions. Our expertise spans the entire ideation-to-production spectrum. We create value for our clients through creation of Product and Technology Strategies, Intelligent Digital Experiences, and World Class Engineering,
41
delivered through our 24 capabilities, grouped into four key areas: Define, Design, Build and Run & Evolve. We accelerate our clients’ ability to take advantage of new business models and market opportunities by ideating and delivering dynamic platforms and intelligent digital experiences that are designed to fuel rapid, ongoing transformation of our customer’s businesses. By leveraging next-generation technologies, our agile, multi-disciplinary teams provide a combination of Product & Technology Strategies, Intelligent Experiences, and World Class Engineering to help our clients become more engaging, responsive, and efficient.
At the core of our approach is our proprietary Distributed Enterprise Agile scaling framework, known as The Endava Agile Scaling framework, or TEAS. TEAS utilizes common Agile scaling frameworks, but enhances them by balancing the requirements of delivering both quality and speed-to-market, helping our clients release higher-quality products to market faster, respond better to market changes and incorporate customer and user feedback through rapid releases and product iterations. Our deep familiarity with technologies developed over the last decade including mobile connectivity, social media, automation, big data analytics and cloud delivery, as well as next-generation technologies such as Internet of Things, or IoT, artificial intelligence, machine learning, augmented reality, virtual reality and blockchain, allows us to help our clients transform their businesses.
We locate our nearshore delivery centers in countries that not only have abundant IT talent pools, but also offer us an opportunity to be a preferred employer. We provide services from our nearshore delivery centers, located in two European Union countries (Romania and Bulgaria), three other Central European countries (Moldova, North Macedonia, and Serbia), and four countries in Latin America (Argentina, Colombia, Uruguay and Venezuela). We have close-to-client offices in five Western European countries (Denmark, Germany, Ireland, the Netherlands and the United Kingdom) and in the United States. As part of our acquisition of CDS on August 17, 2020, we acquired new nearshore delivery centers in Bosnia and Herzegovina and Slovenia, an additional delivery center in Serbia and additional close-to-client offices in Germany, Ireland and the United States, as well as, a sales office in Austria. As of June 30, 2020, we had 6,624 employees (including directors), approximately 50.8% of whom work in nearshore delivery centers in European Union countries. We provide Endavans with training to develop their technical and soft skills, in an environment where they are continually challenged and given opportunities to grow as professionals, and with tools and resources to innovate.
As of June 30, 2020, we had 416 active clients, which we define as clients who paid us for services over the preceding 12-month period. We have achieved significant growth in recent periods. For the fiscal years ended June 30, 2020, 2019 and 2018, our revenue was £351.0 million, £287.9 million and £217.6 million, respectively, representing a compound annual growth rate of 27.0% over the three year period. We generated 44.3%, 45.0% and 45.3% of our revenue for the three fiscal years ended June 30, 2020, 2019 and 2018, respectively, from clients located in the United Kingdom; we generated 24.5%, 27.5% and 33.7%, of our revenue in each of those fiscal years, respectively, from clients located in Europe; we generated 2.7% of our revenue for the fiscal year ended June 30, 2020 from clients located in Rest of World (RoW), while in the fiscal years ending June 30, 2019 and 2018 the revenue generated from RoW was immaterial; and we generated 28.5% , 27.5%, 21.0% of our revenue for the fiscal years ended June 30, 2020, 2019 and 2018 from clients located in North America. Our revenue growth rate at constant currency, which is a measure that is not calculated and presented in accordance with IFRS, for the fiscal years ended June 30, 2020, 2019 and 2018 was 21.0%, 31.1% and 37.2%, respectively. Over the last five fiscal years, 89.4% of our revenue, on average, each fiscal year came from clients who purchased services from us during the prior fiscal year. Our profit before taxes was £25.3 million, £30.1 million and £24.7 million, for the fiscal years ended June 30, 2020, 2019 and 2018, respectively, and our profit before taxes as a percentage of revenue was 7.2%, 10.5% and 11.3%, respectively, for the same periods. Our adjusted profit before taxes margin, or Adjusted PBT Margin, which is a measure that is not calculated and presented in accordance with IFRS, was 19.5%, 18.0% and 15.4%, respectively, for the fiscal years ended June 30, 2020, 2019 and 2018. See notes 1 and 6 in the section of this Annual Report on Form 20-F titled “Selected Financial Data – Non-IFRS Measures and Other Management Metrics” for a reconciliation of revenue growth rate at constant currency revenue growth rate and for a reconciliation of Adjusted PBT to profit before taxes, respectively, the most directly comparable financial measures calculated and presented in accordance with IFRS.
42
Industry Background
Overview
Waves of technological change are disrupting the nature of competition in every industry. New technologies have enabled the growth and success of digital native companies that leverage these technologies in every aspect of their businesses, allowing them to be nimble, innovative, data driven and focused on the user experience, often through an Agile development approach. Technology has also increased customer expectations, giving them the ability to choose not only the products and services that they want, but also where, when and how they want them delivered. Incumbent enterprises must undertake digital transformation of their businesses by leveraging technology in order to meet ever-evolving customer expectations and compete with digital native disruptors.
Significant Technology Innovation
Technology has gone through significant evolution in the last decade and this trend is expected to continue. The use of mobile connectivity, social media, automation, big data analytics and cloud delivery have become integral to business execution and emerging trends and technologies, including IoT, artificial intelligence, machine learning, augmented reality, virtual reality and blockchain, hold the potential to significantly reshape industries. Because each new generation of technology builds on and advances the technology that came before it, the pace of technological innovation will continue to accelerate, increasing the pace at which enterprises will need to transform.
Empowered Customers and Users
The proliferation of new technologies has empowered customers and users across industries and increased their expectations. These technologies have allowed customers and users to have more information and more choices, thereby changing how they interact with enterprises and their products and services. Other users, such as employees, are bringing these same expectations to the workplace. Empowered customers and users are increasingly discerning and their preferences keep changing as technology evolves. As a result, for enterprises, continually transforming their interactions with all constituencies has become a competitive imperative.
Rise of the Digital Natives
These significant technological changes have enabled the emergence of digital native companies. These companies leverage emerging technologies in every aspect of their businesses and are nimble and innovative, data driven and focused on the user experience. Digital native companies are not encumbered by legacy technology. Over the past decade, they have revolutionized the way technology is used across all functions in an organization, how technology infrastructure is built and maintained and how technology solutions are developed, deployed and continually improved.
Increasing Adoption of the Agile Approach
Due to the influence of digital native companies, the adoption of Agile development across industries has become pervasive. Agile is an iterative and incremental methodology for development where requirements and solutions evolve through collaboration between cross-functional teams. Agile is user driven and focused on continuous delivery of small upgrades, facilitating highly differentiated speeds of innovation and time to market.
Challenges to Transformation
Incumbent enterprises must undertake digital transformation of their businesses by leveraging technology in order to meet ever-evolving customer expectations and compete with digital native disruptors. There are several challenges incumbent enterprises face in achieving technological transformation:
Significant Investment in Legacy Technology
For most incumbent enterprises, reorienting IT operations with new technology is expensive, time-consuming and risks service disruption. Incumbent enterprises are often laden with legacy infrastructure and applications that are difficult and expensive to operate and maintain. They cannot switch off and move away from legacy technology infrastructure investments as the legacy infrastructure is often deeply embedded in the core transactional systems that
43
drive revenue. Incumbent enterprises must find ways to reconcile maintenance of existing infrastructure and applications with a nimble approach to using next-generation technologies.
Barriers to Innovation
Incumbent enterprises are fundamentally built to do what they are already doing and can struggle with innovation. They are often characterized by ingrained processes and cultural norms that do not encourage strategic shifts, with decision makers isolated from the economic consequences of choices. These institutional constraints can impede incumbent enterprises’ ability to solve complex problems and rapidly respond to shifting competitive dynamics. Incumbent enterprises need to learn to “build many” and “fail fast” in order to efficiently allocate resources and optimize their opportunities for success.
Not Built for Agile
Incumbent enterprises must adopt new technologies and rapidly execute on initiatives in order to remain competitive, but are often stymied by ingrained traditional approaches to development. The Agile methodology stands in stark contrast to the IT-department-driven, legacy approach often used by incumbent enterprises, which is premised on a sequential and siloed structure, involves long development cycles, fails to integrate user feedback and is often more costly.
Lack of Required Expertise and Talent
The modern competitive environment requires incumbent enterprises to deliver experiences to customers and users that are intuitive and unobtrusive. This, in turn, requires connectivity across channels of customer and user interaction and successfully harnessing next-generation technology. Internal IT teams at incumbent enterprises often struggle to absorb the rapid pace of technology development and its growing complexity. Incumbent enterprises need user experience strategy and design capability, as well as technology and engineering expertise, to develop effective and frictionless user experiences. Developing this capability and expertise requires the acquisition and retention of talent in ideation, strategy, user experience, Agile development and next-generation technologies. However, the market for employees with expertise in these areas is highly competitive.
Limitations of Traditional IT Service Providers
Incumbent enterprises have historically looked to traditional IT service providers to undertake technology development projects. Traditional IT service providers are built for commoditized development, integration and maintenance engagements, where cost is key. They can deliver on large-scale projects using scaled, cost-effective infrastructure and are generally expert in legacy systems. While some of these traditional IT service providers have invested in capabilities to provide user experience strategy and design, as well as Agile development capabilities, they were built to serve, and remain focused on serving, legacy systems using offshore delivery.
Our Opportunity
According to IDC, the worldwide market for digital transformation services is expected to grow at a compound annual growth rate of of 15.3% through 2023, from $451 billion in 2019. IDC defines digital transformation as the continuous process by which enterprises adapt to or drive disruptive changes in their customers and markets by leveraging digital competencies to innovate new business models, products and services that seamlessly blend digital and physical and business and customer experiences while improving operational efficiencies and organizational performance. Broadly, our target market is defined within categories, identified by IDC, of spending as business services, IT services, Infrastructure-as-a-Service, applications, application development and deployment, personal devices, system infrastructure software and other next-generation software, services, and materials, such as augmented reality, virtual reality, IoT, 3D printing, next-generation security and robotics.
44
The Endava Approach
We are a leading next-generation technology services provider and help accelerate disruption by delivering rapid evolution to enterprises. We aid our clients in finding new ways to interact with their customers and users, enabling them to become more engaging, responsive and efficient. Using Distributed Enterprise Agile at scale, we collaborate with our clients, seamlessly integrating with their teams, catalyzing ideation and delivering robust solutions. Our approach to ideation comprises an empathy for user needs, curiosity, creativity and a deep understanding of technologies. From proof of concept, to prototype, to production, we use our engineering expertise to deliver enterprise platforms capable of handling millions of transactions per day. Our people synthesize creativity, technology and delivery at scale in multi-disciplinary teams, enabling us to support our clients from ideation to production. We offer our clients capabilities in four key areas, which we refer to as: Define, Design, Build and Run & Evolve. The multiplicative impact of different combinations of these capabilities across the delivery of strategies, experiences, and engineering allows us rapidly to create real transformation for our clients.
Our Competitive Strengths
We have distinguished ourselves as a leader in next-generation technology services by leveraging the following competitive strengths:
Ideation through Production
We help our clients become digital, experience-driven businesses by assisting them in their journey from idea generation to development and deployment of products, platforms and solutions. By providing user-centric digital strategies and engineering skills, we enable our clients to become more engaging, responsive and efficient in delivering products and services to their customers and users. We collaborate with our clients, understand their changing technology needs and seamlessly integrate with their teams to develop long-term embedded relationships and drive value. Our expertise spans the entire ideation-to-production spectrum. We create value for our clients through creation of Product and Technology Strategies, Intelligent Digital Experiences, and World Class Engineering, delivered through our 24 capabilities, grouped into four key areas: Define, Design, Build and Run & Evolve.
Proprietary Framework for Distributed Enterprise Agile at Scale
To allow us to deliver Distributed Enterprise Agile at scale, we have developed a proprietary Agile scaling framework, TEAS. Traditional Agile development methodologies have constraints that prevent them from scaling in a truly industrialized way without sacrificing agility. TEAS utilizes common Agile scaling frameworks, but enhances them by balancing the requirements of delivering both quality and speed-to-market. With TEAS, we seek to provide enough guidance to allow teams to start tackling client challenges with confidence, while building in flexibility to adapt to evolving client needs, environments and cultures. TEAS enables us to scale across the spectrum from ideation to production by having product level planning for a group of releases, portfolio level planning for a group of products and an overarching strategy to guide the development of the portfolio. As a result, our teams are able to quickly design, develop and test digital solutions, providing actionable insights into their value and business potential in a short timeframe, while our clients are able to release higher-quality products to market faster, respond better to market changes and incorporate customer and user feedback through rapid releases and product iterations. We believe our dynamic approach to Distributed Enterprise Agile at scale delivers tangible and valuable benefits for our clients.
Expertise in Next-Generation Technologies
We have deep expertise in next-generation technologies that drives our ability to provide solutions for Digital Evolution, Agile Transformation and Automation. Our expertise ranges from technologies developed over the last decade including mobile connectivity, social media, automation, big data analytics and cloud delivery to next-generation technologies such as IoT, artificial intelligence, machine learning, augmented reality, virtual reality and blockchain. Our frameworks, methodologies and tools, including TEAS and our proprietary Chronos software analysis tool for risk assessment of software codes, further enhance our ability to develop and deploy solutions based on these next-generation technologies. For example, we leveraged our expertise in augmented reality to conceive and build a solution that helps customers of a mobile communications company visualize areas where they can obtain network coverage.
45
We believe that technology will continue to evolve and that enterprises must continue to evolve their service offerings in order to thrive in such a dynamic environment. Our company-wide initiatives such as Endava Labs, our innovation think tank, and our Digital Experience Council, our cross-functional, monthly digital exploration session, illustrate the innovative culture important for us to maintain our strong expertise in next-generation technologies. We continue to advance our service offerings and solutions areas to remain at the cutting edge of technological developments.
Strong Domain Expertise
We have deep expertise in industry verticals that are being disrupted by technological change. In the Payments and Financial Services vertical, we have helped accelerate the transformation of leading banks and payment processing companies by building new platforms and solutions such as merchant acquiring platforms, cloud-based payment processing platforms, mobile wallets, downloadable Point-of-Sale, or POS, mobile terminals, Smart POS terminals, real-time payments systems, omni-channel e-commerce gateways and merchant portals with real-time payments analytics. In the Technology, Media and Telecommunications, or TMT, vertical, we have helped clients design and build solutions for the connected home and car, to enhance multi-channel customer experiences and to automate processes, including developing an automated solution to facilitate the purchase of television advertising in the United States.
Employer of Choice in Regions with Deep Pools of Talent
We strive to be one of the leading employers of IT professionals in the regions in which we operate. We provide services from our nearshore delivery centers, located in two European Union countries (Romania and Bulgaria), three other Central European countries (Moldova, North Macedonia and Serbia), and four countries in Latin America (Argentina, Colombia, Uruguay and Venezuela). We have close-to-client offices in five Western European countries (Denmark, Germany, Ireland, the Netherlands and the United Kingdom), and in the United States. As part of our acquisition of CDS on August 17, 2020, we acquired new nearshore delivery centers in Bosnia and Herzegovina and Slovenia, an additional delivery center in Serbia and additional close-to-client offices in Germany, Ireland and the United States, as well as, a sales office in Austria. We locate our nearshore delivery centers in countries that not only have abundant IT talent pools, but also offer us an opportunity to be a preferred employer. As of June 30, 2020, we had 6,624 employees (including directors), approximately 50.8% of whom work in nearshore delivery centers in European Union countries. We locate our nearshore delivery centers in countries that not only have abundant IT talent pools, but also offer us an opportunity to be a preferred employer. For example, a majority of our employees are located in Romania, where we have been identified as a top employer for each of the last five years.
Distinctive Culture and Values
We believe that our people are our most important asset. We provide Endavans with training to develop their technical and soft skills, in an environment where they are continually challenged and given opportunities to grow as professionals, and with tools and resources to innovate. Endava University and “Pass It On” are key elements of our training and development framework. Endava University provides classroom based training and “Pass It On” uses apprenticeship and open sharing so that our people can grow by way of collective experiences and knowledge. Our employees also have career coaches to customize their integration into their respective teams and to help visualize their development and future. Through Endava Labs and regular hackathons, our teams are encouraged to express their creativity in using next-generation technologies to build innovative solutions. We believe that we have built an organization deeply committed to helping people succeed and that our culture fosters our core values of openness, thoughtfulness and adaptability.
Founder Led, Experienced and Motivated Management Team.
Our management team, led by John Cotterell, our founder and chief executive officer, has significant experience in the global technology and services industries. Since our founding in 2000, we have expanded from a single office serving clients principally located in the city of London to a global enterprise serving clients across Europe and North America from nearshore delivery centers located in Central Europe and Latin America. We believe that we have a strong partnership culture. Our most senior 63 employees have an average tenure at Endava of 10 years, which we believe evidences the success of our approach. Additionally, our management team focuses on mentoring our IT professionals at all levels to develop the next generation of leadership.
46
Our Strategy
We are focused on continuing to distinguish ourselves as a leader in next-generation technology services. The key elements of our strategy include:
Expand Relationships with Existing Clients
We are focused on continuing to expand our relationships with existing clients by helping them solve new problems and become more engaging, responsive and efficient. We have a demonstrated track record of expanding our work with clients after an initial engagement. Our ten largest clients together contributed 38.1% and 37.7% of our total revenue in the last two fiscal years, respectively, and the number of clients that have a minimum annual spend of at least £1.0 million has grown from 63 to 65 over the same time period. Expansion of our relationships with existing active clients will remain a key strategy going forward as we continue to leverage our deep domain expertise and knowledge of emerging technology trends in order to drive incremental growth for our business.
Establish New Client Relationships
We believe that we have a significant opportunity to add new clients. We have established ourselves as a leader in delivering end-to-end ideation-to-production services in the Financial Services and Payments and TMT verticals. Clients in the Payments and Financial Services vertical contributed to 52.8%, 52.9% and 56.8% of our total revenue in the 2020, 2019 and 2018 fiscal years, respectively. Clients in the TMT vertical contributed 25.7%, 27.4% and 28.1%, of our total revenue in the 2020, 2019 and 2018 fiscal years, respectively. Clients in our Other vertical contributed 21.5%, 19.7% and 15.1%, of our total revenue in the 2020, 2019 and 2018 fiscal years, respectively. We believe that we continue to have a significant untapped opportunity in these sectors and we plan to leverage this experience to expand our vertical reach. As waves of technological change sweep across industries and increasingly facilitate seamless integration of different aspects of customers and users lives, we believe our experience working within our core client base will also be of particular value in expanding our vertical reach. For example, as customers increasingly demand a frictionless and consistent buying experience and the payments and retail sectors converge, we believe our deep expertise in developing payment systems and e-commerce platforms will allow us to grow our base of retail clients. Similarly, we believe that our expertise in data analytics and augmented and virtual reality will be increasingly relevant in the healthcare industry as technology continues to reshape the practice and provision of medicine. We are also focused on the consumer products, logistics and professional services verticals as key areas for potential growth.
We are likewise focused on geographic expansion, particularly in North America. In the 2020 fiscal year, approximately 28.5% of our revenue came from clients in North America. With our acquisition of Velocity Partners, we increased our sales presence in the United States and added nearshore delivery capacity in Latin America, which we believe will allow us to further penetrate the North American market. In addition, we plan to evaluate other growth markets, including countries in the Asia Pacific region, to expand our client footprint.
Lead Adoption of Next-Generation Technologies
We seek to apply our creative skills and deep digital technical engineering capabilities to enhance our clients’ value to their end customers and users. As a result, we are highly focused on remaining at the forefront of emerging technology trends, including in areas such as IoT, artificial intelligence, machine learning, augmented reality, virtual reality and blockchain. For example, we have developed next-generation technology solutions such as blockchain payment gateways and chatbot-enabled social payments. We are embedded and integrated with our clients, which gives us unique insight into how emerging industry trends can help address their needs. We plan to leverage these insights to continue innovating for our clients.
Expand Scale in Nearshore Delivery
We believe that our proprietary Distributed Enterprise Agile at scale framework requires that we have teams based in locations with similar time zones to those of our clients since our delivery teams are in constant dialogue and interaction with our clients. We focus on being an employer of choice for IT professionals in the regions in which we operate, which include countries with deep and largely untapped creative and engineering talent pools, and on being an employer of choice in local markets. As we continue to expand our relationships with existing clients and attract
47
new clients, we plan to expand our teams at existing delivery centers and open new delivery centers in nearshore locations with an abundance of technical talent.
Selectively Pursue “Tuck-In” Acquisitions
We plan to selectively pursue “tuck-in” acquisitions. Our focus is on augmenting our core capabilities to enhance our expertise in new technologies and verticals and increase our geographic reach, while preserving our corporate culture and sustainably managing our growth. Consistent with these goals, we have completed six acquisitions in the past five fiscal years, all of which have enabled us to accelerate core strategic goals. For example, our acquisition of CDS in 2020 increased our nearshore delivery centers in the Adriatic region and our client base in Europe. Our acquisition of Exozet in December 2019 increased our close-to-client German speaking talent and expanded our credentials in immersive experiences, media management and the automotive and broadcasting sectors. Our acquisition of Intuitus in November 2019 strengthened our digital due diligence and other technology advisory services to private equity clients. Our acquisition of Velocity Partners in 2017 increased our North American client base and added nearshore delivery centers in Latin America.
We have a demonstrated track record of successfully identifying, acquiring and integrating complementary business and plan to leverage this experience as we pursue “tuck-in” acquisitions that help accelerate our strategy.
Our Capabilities
We reimagine the relationship between people and technology.
We accelerate our clients’ ability to take advantage of new business models and market opportunities by ideating and delivering dynamic platforms and intelligent digital experiences that are designed to fuel rapid, ongoing transformation of their businesses.
By leveraging next-generation technologies, our agile, multi-disciplinary teams provide a combination of Product & Technology Strategies, Intelligent Experiences and World-Class Engineering to help our clients become more engaging, responsive, and efficient.
We offer our clients capabilities in four key areas, as depicted below. The multiplicative impact of different combinations of these capabilities across the delivery of strategies, experiences and engineering, allows us rapidly to create real transformation for our clients.
48

DEFINE
Private Equity and Corporate Transaction Advisory
The constantly evolving technology landscape means that both private equity and corporate buyers need to understand if the technology operations of the company being acquired are capable of enabling the buyer’s investment thesis. The Endava Private Equity Group, or PEG, provides technology and digital advisory services in all sectors including Financial Services, Healthcare, Manufacturing, Retail and Consumer, Business and Support Services, and TMT, supporting the full transaction lifecycle.
Technology Strategy
The Endava Technology Strategy capability provides expertise and deep experience in helping clients with complex decision-making process through thorough diagnosis and delivery of executable IT strategies.
Business Analysis
Business Analysis is a dedicated discipline within the Endava organization. We support complex projects by acting as the mediator between the business and the technology teams. We distinguish ourselves through an understanding of our clients’ domains. We have business domain expertise in Payments, Financial Services, Asset and Wealth Management, Insurance, Telecommunications, and Digital Media.
Program Management
We help our clients achieve transformational change by providing expertise in structuring and executing successful change programs and end-to-end delivery throughout the transformation lifecycle. We work with our clients to create the right environment for change, including effective sponsorship, governance and agile ways of working.
Digital Product Strategy
Our Digital Product Strategy services help clients turn their early ideas and business challenges into prototypes and market-ready products. Our objective is to ensure that we are always building the right product, focusing our efforts
49
on capabilities that create the maximum value for the business and the best experience for their users. We help clients with their market positioning and differentiation.
Data & Analytics
We assist organizations in identifying, defining, and embedding the collaborative Data and Analytics that enhance both their productivity and profitability through the power of traditional Business Intelligence, Data Warehousing, Big Data platforms, Analytics and Visualization, or implementation of Data Governance underpinned by Data Strategy.
DESIGN
Architecture
Technology systems must rapidly modernize and evolve to meet these challenges, and architecture is a key enabler to accomplish this by achieving alignment, simplification, and key qualities such as security, scalability, and resilience.
Extended Reality
Extended Reality (XR) covers the spectrum of spatial media from Virtual Reality (VR) to Augmented Reality (AR). Understanding the power of fully immersive interactions, we leverage our expertise in experience design, human factors engineering, advanced 3D technology platforms, and integrations with input and visualization hardware to conceive, design, build, and deliver both the virtual and augmented experiences of the future.
Machine Learning & Artificial Intelligence
Machine Learning & Artificial Intelligence are an emerging strategic area for Endava. In the last several years, Endava has enhanced its capability through Internal Data Lab & R&D exercises, prototypes and POC development. We have applied our expertise in a variety of domains such as healthcare, banking, payments processing, and private equity.
Product Design
At its core, Product Design at Endava translates established product strategies into their requisite design components to create innovative customer experiences and new business capabilities.
User Experience Design
Endava believes in a user-centered approach, which demands continuous user research, interviews, prototyping, testing, and iteration to understand and empathize with users throughout their journeys properly. Beyond the product launch, we believe a regular cadence of measuring, hypothesizing, designing, and deploying to improve KPIs continuously adds value to our clients.
Visual Design
We use visual design to create meaningful experiences. We use building blocks, such as symbols, typography, color scheme, iconography, illustration style, visuals, animations, motion design, photography style, sound design, messaging, and tone of voice, to execute on complex objectives through imagery, film, 3D graphics, and language.
BUILD
Automated Testing
Endava uses agile techniques to include test automation as a standard part of development. We integrate test automation and performance frameworks into the continuous integration/continuous delivery pipeline, so that tests are executed as soon as there is a code drop, providing immediate feedback, reducing project delays, and improving time to market.
50
Cloud Native Software Engineering
We can deliver data platforms, real-time or batch data lakes, and enterprise reporting solutions, or use native machine learning on all major cloud providers, as we are technology-agnostic and offer guidance for choosing the right technology stack depending on the client's business objectives.
Continuous Delivery
Some of the areas we continuously improve include architecting for continuous delivery and automating almost anything, including pipelines with automatic quality gates, deploys, configuration, data migration, automation testing at the right level, infrastructure, and monitoring.
Distributed Agile Delivery
Endava has been successfully delivering large agile development projects for many years, Distributed Agile Delivery refers to the service through which we do scale agile development with scrum teams that are distributed in several locations, sometimes including client teams.
Collaboration technology such as distributed source code management, continuous integration, continuous delivery tools, wikis, video conferencing, and chat platforms all help our high-performance distributed teams be more effective.
Intelligent Automation
We are delivering Intelligent Automation, employing both more traditional techniques like robotic process automation and cutting-edge ones centered around cognitive computing elements like machine learning, natural language understanding and processing and computer vision.
Secure Development
We build security thinking into our secure development lifecycle by investing in our people, tools, and processes, so that these systems are secure by design. This involves cultivating a security-oriented mindset in all team members and ensuring security awareness and focus throughout the software development lifecycle, additionally integrating this thinking with DevOps ways of working to deliver practical DevSecOps where appropriate.
RUN & EVOLVE
Agile Applications Management
This capability focuses on optimizing and improving the value of our client's application estate by mitigating risk and increasing quality and reliability of their applications by keeping the client’s estate up to the latest market standards and enhancing it with new features. We help our clients run their businesses by improving agility, driving continuous improvement and reducing time to market.
Cloud Infrastructure
Our capabilities include cloud migrations and hybrid solutions, and we support our customers in all stages of migration and adoption, from defining business goals and strategy through discovery and delivery into managed cloud operations.
DevSecOps
Complementing Endava’s commitment to an Agile delivery, our teams also adopt a DevOps approach to continuous and cross-functional collaboration between Development and Operations specialists.
Service Delivery
Operational IT ecosystems require services to be designed in a way that enables them to adapt and scale to business demands while meeting assurances and reliability expectations. We do this by understanding the service needs and
51
interactions of the operational teams and recommending and managing industry best practice standards, policies, tools and grades of service.
Smart Desk
The purpose of the Endava Smart Desk is to provide a single point of contact, or SPOC, to all end users through a unified communications hub that ensures appropriate support in a timely manner. This includes the coordination of all End User Services, third parties and internal support teams for an excellent customer experience and seamless collaboration between all customer suppliers.
Telemetry & Monitoring
The purpose of IT infrastructure and application monitoring is to actively diagnose performance and accessibility problems across the entire infrastructure before an outage occurs.
Our Frameworks, Methods and Tools
Our frameworks, methods and tools, including TEAS, enhance our ability to develop and deploy solutions based on next-generation technologies. Developed with a focus on providing innovation, quality and productivity at scale, we believe our frameworks, methods and tools allow us to:
• |
Deliver outcome driven programs to our clients, with faster time-to-market and favorable return on investment; |
• |
Tailor our approach to the needs of our clients and respond flexibly to changing client objectives and market conditions; |
• |
Improve our clients visibility into budgets, status and progress of technology projects; and |
• |
Provide better solutions. |
Our key frameworks, methods and tools include the following:
The Endava Agile Scaling Framework (TEAS)
To allow us to deliver Distributed Enterprise Agile at scale, we have developed a proprietary Agile scaling framework, TEAS. Traditional Agile development methodologies use small multi-disciplinary “scrum teams,” with members in close proximity. However, today most enterprise development projects require large development teams that are often geographically or organizationally dispersed. Collaboration, communication and oversight can break down, making it difficult to scale Agile development methodologies. Further, commonly used Agile scaling frameworks are generally either overly prescriptive, thereby compromising agility, or overly informal, thereby compromising effective oversight.
TEAS utilizes common Agile scaling frameworks, but enhances them by balancing the requirements of delivering both quality and speed-to-market. With TEAS, we seek to provide enough guidance to allow teams to start tackling client challenges with confidence, while building in flexibility to adapt to evolving client needs, environments and cultures. Each of our scrum teams typically consists of six to eight team members with the appropriate mix of technical ability, leadership and project management skills, domain expertise, creative and user experience capabilities and software development and quality assurance expertise. For larger and more complex projects, we employ a “scrum-of-scrums” approach, which is led by representatives from each scrum team, and facilitates an incremental level of collaboration across scrum teams. TEAS enables us to move beyond team-level Agile working to scale product-level planning for a group of releases, portfolio-level planning for a group of products and an overarching strategy to guide the development of the portfolio.
TEAS enables us to provide Distributed Enterprise Agile at scale with the same focus on communication, collaboration and iterative releases that makes smaller-scale Agile development effective. With TEAS, our teams are able to quickly design, develop and test digital solutions, providing actionable insights into their value and business potential in a short timeframe. Our clients are able to release higher-quality products to market faster, respond better to market changes and incorporate customer and user feedback through rapid releases and product iterations. We believe
52
that our TEAS framework is enhanced through advanced software engineering practices involving multi-skilled teams able to employ Development Operations, or DevOps, techniques, such as automated testing, continuous integration, continuous delivery and infrastructure automation.
Chronos
Chronos is our proprietary software analysis tool for risk assessment of software codes. It detects “anti-patterns” in the evolution of a project’s codebase and the behaviors of the team who developed it. “Anti-patterns” are common practices that initially appear to be appropriate solutions, but end up having negative consequences that outweigh any benefits. Chronos supports both quality and productivity improvement by providing deep insight into the evolution of a large codebase. It does so by analyzing the codebase stored in version control systems (Git and SVN) in regards to who changed what, why and when to identify and reverse negative trends in development team behavior.
Chronos offers several benefits to our employees as well as our clients. It allows our clients to identify areas in the code that are higher risk or attract more defects than other areas, giving them an integrated, balanced, holistic view of the risks in, and quality of, their codebase. Chronos also helps new team members get up to speed with a new project quickly. It helps managers oversee risks and proactively ensure skills are balanced effectively across scrum teams. It can increase the value and productivity of due diligence and technical reviews by providing information on the technologies and their evolution, on key people involved with the project and on code and process quality issues.
Testing Toolbox
One of the key challenges associated with rapid technology development is the need to have rigorous, fast and frequent testing, which can only be achieved through high levels of automation. This is particularly challenging when building test automation for Distributed Enterprise Agile at scale and DevOps, where test frameworks need to be light, flexible and easily integrated into the build pipeline. We have developed our testing toolbox in order to enable fast and efficient test execution. Our testing toolbox accelerates the provision of lean automation solutions and contains accelerators for testing web and cross browsers, application programming interfaces, services and microservices, mobile devices, security, accessibility and performance. The testing toolbox helps us reduce the time to implement test automation solutions and allows us the flexibility to extend frameworks in-sprint, without relying on a test tool vendor.
Two key testing automation solutions are part of our testing toolbox: Ensec and our Mobile Testing Framework. EnSec is our security testing accelerator that can be deployed in minutes, either on a stand-alone basis or within the development pipeline, and automatically checks applications for the Open Web Application Security Project vulnerabilities. Our Mobile Testing Framework automates testing of mobile phones and devices hosted in our delivery units and in the cloud. This framework enables multiple devices to be tested in parallel, thereby removing the need for manual regression testing and reducing the time and effort required.
CSAT
Customer Satisfaction Analysis Tool, or CSAT, is our client management tool, which allows us to collect regular client feedback. CSAT relies on surveys, common use testimonials, continuous service improvement monitoring and the collection of social media mentions to gather a robust view of how clients feel about Endava and how we respond to their feedback. CSAT helps us differentiate ourselves in managing customers in a sustainable way.
Our Delivery Model
We believe the development of a scaled global, nearshore delivery model with selective close-to-client capabilities enables us to deliver higher-quality technology services to meet our clients’ needs. Nearshore delivery locations with geographic proximity, cultural affinity and complementary time zones enable increased interaction with our clients, enhance relationships and improve responsiveness for more efficient delivery of our services. As a result, we are able to differentiate ourselves on projects that require a high degree of client collaboration and iteration.
We provide services out of nearshore delivery centers located in two European Union countries (Romania and Bulgaria), three other Central European countries (Moldova, North Macedonia and Serbia), and four countries in Latin America (Argentina, Colombia, Uruguay and Venezuela). We have close-to-client offices in five Western European countries (Denmark, Germany, Ireland, the Netherlands and the United Kingdom) and the United States. As part of our
53
acquisition of CDS on August 17, 2020, we acquired new nearshore delivery centers in Bosnia and Herzegovina and Slovenia, an additional delivery center in Serbia and additional close-to-client offices in Germany, Ireland and the United States, as well as, a sales office in Austria. We locate our nearshore delivery centers in countries that not only have abundant IT talent pools, but also offer us an opportunity to be a preferred employer. As of June 30, 2020, we had 6,624 employees (including directors), approximately 50.8% of whom work in nearshore delivery centers in European Union countries.
Our nearshore delivery model was first established in Central Europe in order to efficiently deliver our solutions to European clients. Our primary delivery centers are located in Romania, where we employed approximately 2,830 employees involved with delivery of our services as of June 30, 2020. As of June 30, 2020, we had 1,048 such employees located in Cluj-Napoca, the second largest city in Romania and 869 such employees located in Bucharest, the capital of Romania. We believe Romania is an ideal location to source IT delivery talent due to its educational infrastructure, large multi-lingual population, advanced technological infrastructure and flexible labor regulation. According to Eurostat, Romania had the highest share of engineers in the European Union in 2014. According to the June 2012 Eurobarometer report, approximately 31% of Romania’s population speaks English. As of June 30, 2020, we also had approximately 1,939 IT professionals across our locations in Bulgaria, North Macedonia, Moldova and Serbia, which are countries that we believe offer many of the same benefits as Romania. To serve our North American clients, we had approximately 823 employees involved with delivery of our services across our seven Latin American delivery centers as of June 30, 2020, the majority of which are located in Argentina (328 employees) and Colombia (398 employees). We believe that the Latin American region as a whole has an abundant talent pool of individuals skilled in IT.
Employees at our close-to-client locations include our sales teams, as well as account management and other client-facing employees, which helps maintain quality and consistency in collaboration with our nearshore delivery teams.
In addition, we are highly focused on the security of our clients’ data and are certified to ISO 27001 standards.
Our Clients
As of June 30, 2020 we had 416 active clients, which we define as clients who spent money with us over the preceding 12-month period. Our clients are primarily enterprises based in the United Kingdom, European Union and United States. Our clients principally operate in the Financial Services and Payments and Technology, Media and Telecommunications verticals. We are also focused on growing our client base in other verticals, such as the consumer products, healthcare, logistics and retail verticals.
During the fiscal years ended June 30, 2020, 2019 and 2018, our 10 largest clients based on revenue accounted for 38.1%, 37.7% and 41.5%, of total revenue, respectively. Our largest client for the fiscal years ended June 30, 2020, 2019 and 2018, Worldpay (UK) Limited, or, together with Worldpay Group Limited and its consolidated subsidiaries, Worldpay, accounted for 10.8% of our revenue in the fiscal year ended June 30, 2018 and less than 10% of our revenue in each of the years ended June 30, 2020 and 2019.
We are focused on building deep, long-term relationships with our clients, which often begin with a discrete project and develop into larger engagements. We target clients to whom we believe we can demonstrate our deep understanding of technological trends and our capability to provide end-to-end ideation-to-production services.
Some of our representative clients by vertical include Beazley, Rabobank, RSA, Jupiter, Pollinate and Worldpay in Payment & Financial Services; Adobe, Backbase, Poly in Technology, Media and Telecommunications; and Maersk and BBC in Other.
Sales and Marketing
Our sales and marketing strategy is focused on driving revenue growth from existing and new clients. We run a single, highly integrated sales and marketing organization that comprises strategy, solutions and offers, marketing, lead generation, sales and account teams. As of June 30, 2020, we had 104 employees on our sales and marketing team located across our offices.
54
We have developed our Endava Sales Academy to cultivate sales talent internally and create a high-performing sales workforce that is culturally aligned with our values. Our Sales Academy begins with candidates joining lead generation teams, where they learn how to identify potential clients and sales techniques. Over the course of approximately three years, candidates progress through this program and can become business development managers.
We announced a strategic partnership with Bain & Company on October 11, 2018. The Bain-Endava partnership brings together deep skills in business and technology strategy, product ideation, technology development and deployment, and organizational change management to help support clients through successful transformations. As an indication of commitment to the partnership, Bain & Company has taken an ownership stake in Endava via our July 2018 initial public offering.
We announced the launch of an Integrated IT Due Diligence Product with Bain & Company in November 2019. With this extended and flexible IT due diligence offering, we address three core areas of current market need: a solid IT and Core technology assessment, a future-back assessment of digital readiness and a robust assessment of the value creation plan through the tech enablers.
We have received various awards, including being:
• |
the recipient of the ANIS Project of the Year award in 2020, along with Pollinate for cutting-edge, bank-grade digital solution which allows Banks to reimagine acquiring and value-added services for SMEs. |
• |
A 5 Star “World Class” certification by the Service Desk Institute (SDI) in 2019. |
• |
featured in the London Stock Exchange Group’s 1000 Companies to Inspire Britain 2019 report, which celebrates the fastest-growing and most dynamic enterprises in the United Kingdom. |
• |
winner of “Brand of the Year” award at the 5th edition of the annual Romanian Business Services Forum & Awards. |
• |
winner of the “Outsourcing Project of the Year” with BT Pay - the first mobile wallet launched by a Romanian Bank, at the 2019 ANIS Gala |
• |
recognized by the Best of the Global Outsourcing 100®, a celebratory list of the best companies in the last 10 years, presented by IAOP. |
• |
recognized by the Financial Times Future 100 UK, list honoring fast growing British companies that are making an impact, either on society or their industry. |
• |
ranked 22nd in the Sunday Times HSBC International Track 200; |
•named as the Company of the Year at the 2018 ANIS Romania awards gala;
•ranked as one of the top 3 U.K. technical agencies in 2017, according to Econsultancy;
•ranked as one of the top 13 U.K. agencies in digital income in each of 2015, 2016 and 2017, according to Econsultancy;
•featured in the International Association of Outsourcing Professionals (IAOP) Global Outsourcing 100 lists in 2015 (Best Leaders in Employee Growth and Best Leaders in Revenue Growth), 2016 (Leaders Category for Top Company for Revenue and Employee Growth and for Programs for Innovation), 2017 (Leaders Category for Top Company for Programs for Innovation) and 2018 (Leaders Category for Top Company for Programs for Innovation and Awards and Certifications);
• |
recognized as employer of the year for outsourcing in Romania at the Romanian Outsourcing Awards for Excellence Gala in 2016; |
• |
the winner, together with Worldpay Group PLC, of Software Outsourcing Project of the Year at the 2017 ANIS gala in Romania. |
55
Competition
We operate in a global and dynamic market and compete with a variety of organizations that offer services similar to those that we offer.
We face competition primarily from:
• |
next-generation IT service providers, such as Globant S.A and EPAM Systems; |
• |
digital agencies and consulting companies, such as McKinsey & Company, Ideo, The Omnicom Group, Sapient Corporation and WPP plc; |
• |
global consulting and traditional IT service companies, such as Accenture PLC, Capgemini SE, Cognizant Technology Solutions Corporation and Tata Consultancy Services Limited; and |
• |
in-house development departments of our clients. |
We believe the principal competitive factors in our business include: ability to innovate; technical expertise and industry knowledge; end-to-end solution offerings; delivery location; price; reputation and track record for high-quality and on-time delivery of work; effective employee recruiting; training and retention; responsiveness to clients’ business needs; scale; and financial stability. We believe that we compete favorably with respect to each of these factors.
Facilities
Our corporate headquarters are located at 125 Broad Street, London EC2N 1AR, United Kingdom, where we lease approximately 1,000 square meters of office space. We provide services from delivery centers located in Argentina, Bulgaria, Colombia, North Macedonia, Moldova, Romania, Serbia, Uruguay and Venezuela and have additional offices in Austria, Denmark, Germany, the Netherlands and the United States. We lease all of our facilities. We believe that our current facilities are suitable and adequate to meet our current needs and for the foreseeable future. Our delivery centers and offices as of June 30, 2020 are shown in the table below:
56
Location |
Type/Use |
Approximate Size(square meters) |
|||
Central Europe: |
|||||
Cluj, Romania |
Delivery center |
11,562 |
|||
Bucharest, Romania |
Delivery center |
10,707 |
|||
Chisinau, Moldova |
Delivery center |
10,607 |
|||
Belgrade, Serbia |
Delivery center |
6,346 |
|||
Iasi, Romania |
Delivery center |
5,901 |
|||
Sofia, Bulgaria |
Delivery center |
4,461 |
|||
Skopje, North Macedonia |
Delivery center |
3,189 |
|||
Timisoara, Romania |
Delivery center |
1,426 |
|||
Pitesti, Romania |
Delivery center |
851 |
|||
Brasov, Romania |
Delivery center |
580 |
|||
Targu Mures, Romania |
Delivery center |
573 |
|||
Western and Northern Europe: |
|||||
Berlin, Germany |
Office premises |
2,035 |
|||
London, United Kingdom |
Office premises |
1,033 |
|||
Frankfurt, Germany |
Office premises |
551 |
|||
Hilversum, Netherlands |
Office premises |
296 |
|||
Edinburgh, United Kingdom |
Office premises |
286 |
|||
Denmark, Copenhagen |
Office premises |
64 |
|||
Vienna, Austria |
Office premises |
9 |
|||
Latin America: |
|||||
Medellin, Colombia |
Delivery center |
5,909 |
|||
Bogota, Colombia |
Delivery center |
3,815 |
|||
Rosario, Argentina |
Delivery center |
1,939 |
|||
Caracas, Venezuela |
Delivery center |
929 |
|||
Rio Negro, Uruguay |
Delivery center |
563 |
|||
Buenos Aires, Argentina |
Delivery center |
515 |
|||
Colonia, Uruguay |
Delivery center |
452 |
|||
Parana, Argentina |
Delivery center |
302 |
|||
North America: |
|||||
New Jersey, USA |
Office premises |
749 |
|||
New York, USA |
Office premises |
478 |
|||
Washington, USA |
Office premises |
397 |
|||
Texas, USA |
Office premises |
200 |
|||
California, USA |
Office premises |
100 |
|||
Our People
As of June 30, 2020, 2019 and 2018, we had 6,624, 5,754 and 4,819 employees (including directors), respectively. We have collective bargaining agreements with our employees in Romania. We believe our employee relations are good and we have not experienced any work stoppages. We vet our employees in accordance with the BS7858 screening standards.
57
At each date shown, we had the following employees (including directors), broken out by department and geography:
As of June 30, |
||||||||
2020 |
2019 |
2018 |
||||||
Employees (including directors) by function: |
||||||||
Employees Involved in Delivery of Our Services |
5,969 |
5,197 |
4,368 |
|||||
Selling, General and Administrative |
655 |
557 |
451 |
|||||
Total |
6,624 |
5,754 |
4,819 |
|||||
Employees (including directors) by geography |
Fiscal Year Ended June 30, |
|||||||
2020 |
2019 |
2018 |
||||||
Western Europe(1)
|
448 |
254 |
232 |
|||||
Central Europe - EU Countries |
3,368 |
3,062 |
2,578 |
|||||
Sub-total: EU Countries (Western & Central Europe) |
3,816 |
3,316 |
2,810 |
|||||
Central Europe - Non-EU Countries |
1,810 |
1,583 |
1,279 |
|||||
Latin America |
895 |
780 |
665 |
|||||
North America |
103 |
75 |
65 |
|||||
Total |
6,624 |
5,754 |
4,819 |
|||||
(1) The increase from 2019 to 2020 in Western Europe headcount includes 25 employees in the United Kingdom acquired in connection with our acquisition of Intuitus in November 2019 and 156 employees in Germany and Austria acquired in connection with our acquisition of Exozet in December 2019.
As a result of our acquisition of CDS on August 17, 2020 our headcount increased by 509 employees.
We believe that our people are our most important asset. We provide Endavans with training to develop their technical and soft skills, in an environment where they are continually challenged and given opportunities to grow as professionals, and with tools and resources to innovate. Endava University and “Pass It On” are key elements of our training and development framework. Endava University provides classroom-based training and “Pass It On” uses apprenticeship and open sharing so that our people can grow by way of collective experiences and knowledge. Our employees also have career coaches to customize their integration into their respective teams and to help visualize their development and future. Through Endava Labs and regular hackathons, our teams are encouraged to express their creativity in using next-generation technologies to build innovative solutions.
We strive to be one of the leading employers of IT professionals in the regions in which we operate. We locate our nearshore delivery centers in countries that not only have abundant IT talent pools, but also offer us an opportunity to be a preferred employer. For example, a majority of our employees are located in Romania, where we have been identified as a top employer for each of the last five years.
We also get involved in initiatives that address social issues and encourage knowledge-sharing beyond our organization in the communities in which we operate. We regularly sponsor technical events and speak at global technical and industry-focused conferences. Our largest initiative consists of internship and graduate programs. By supporting local education, we seek to inspire exploration in engineering and technology.
We believe that we have built an organization deeply committed to helping people succeed and that our culture fosters our core values:
•Openness : We are confident in our abilities, our approach and our people, so we are transparent.
58
•Thoughtfulness : We care deeply about the success of our people, our clients and the countries in which we operate.
•Adaptability : We embrace change and value differences, enabling us to be successful in complex environments.
C. Organizational Structure.
The following diagram illustrates our current corporate structure:
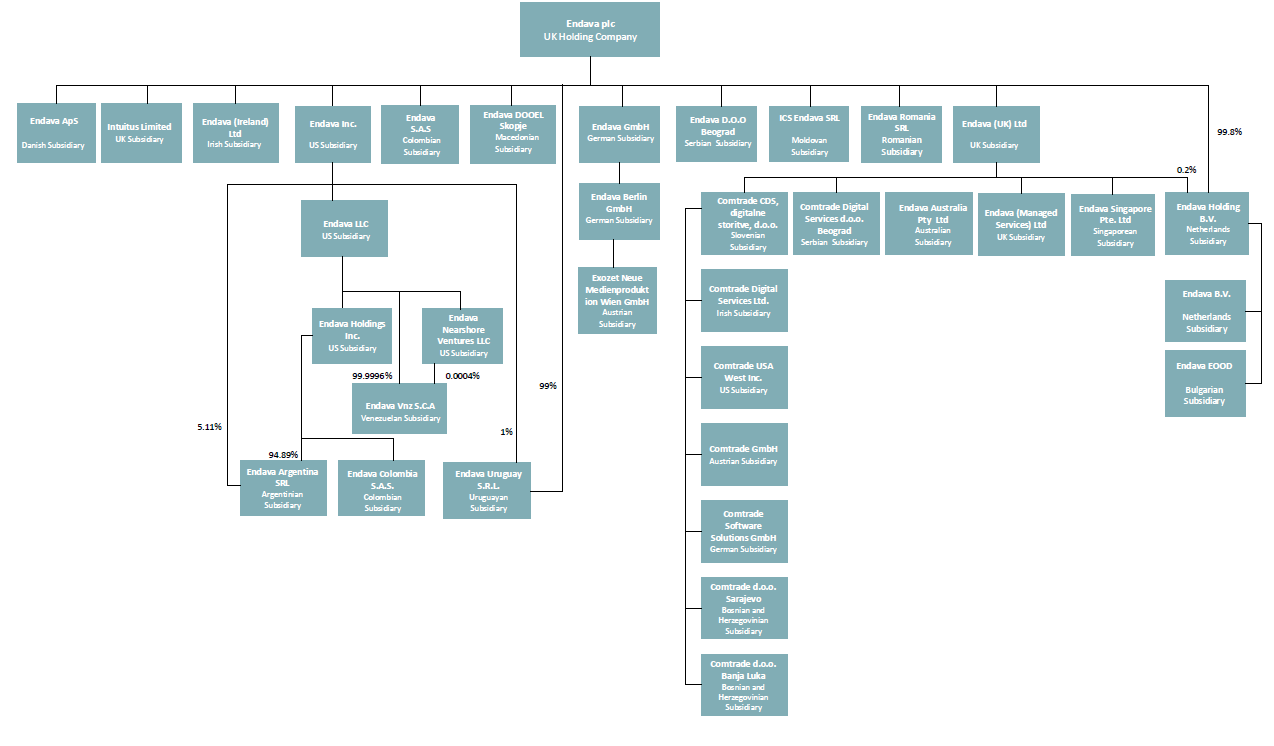
D. Property, Plants and Equipment.
For a discussion of property, plant and equipment, see “Item 4.B—Business Overview—Facilities.”
Item 4A. Unresolved Staff Comments
Not applicable.
Item 5. Operating and Financial Review and Prospects
Overview
We are a leading next-generation technology services provider and help accelerate disruption by delivering rapid evolution to enterprises. We aid our clients in finding new ways to interact with their customers and users, enabling them to become more engaging, responsive and efficient. Using Distributed Enterprise Agile at scale, we collaborate with our clients, seamlessly integrating with their teams, catalyzing ideation and delivering robust solutions. Our approach to ideation comprises an empathy for user needs, curiosity, creativity and a deep understanding of technologies. From proof of concept, to prototype, to production, we use our engineering expertise to deliver enterprise platforms capable of handling millions of transactions per day. Our people, whom we call Endavans, synthesize creativity, technology and delivery at scale in multi-disciplinary teams, enabling us to support our clients from ideation to production.
Since our founding in 2000, we have expanded from a single office serving clients principally located in the city of London to a global enterprise serving clients across Europe and North America from nearshore delivery centers
59
located in Central Europe and Latin America. We provide services from our nearshore delivery centers, located in two European Union countries (Romania and Bulgaria), three other Central European countries (Moldova, North Macedonia, and Serbia), and four countries in Latin America (Argentina, Colombia, Uruguay and Venezuela). We have close-to-client offices in five Western European countries (Denmark, Germany, Ireland, the Netherlands and the United Kingdom), and in the United States. As part of our acquisition of CDS on August 17, 2020, we acquired new nearshore delivery centers in Bosnia and Herzegovina and Slovenia, an additional delivery center in Serbia and additional close-to-client offices in Germany, Ireland and the United States, as well as, a sales office in Austria. As of June 30, 2020, we had 6,624 employees (including directors), approximately 50.8% of whom work in nearshore delivery centers in European Union countries. As of June 30, 2020, 2019 and 2018, we had 6,624, 5,754 and 4,819 employees (including directors), respectively. The breakdown of our employees (including directors) by geography is as follows for the periods presented:
Employees (including directors) by geography |
Fiscal Year Ended June 30, |
|||||||
2020 |
2019 |
2018 |
||||||
Western Europe(1)
|
448 |
254 |
232 |
|||||
Central Europe - EU Countries |
3,368 |
3,062 |
2,578 |
|||||
Sub-total: EU Countries (Western & Central Europe) |
3,816 |
3,316 |
2,810 |
|||||
Central Europe - Non-EU Countries |
1,810 |
1,583 |
1,279 |
|||||
Latin America |
895 |
780 |
665 |
|||||
North America |
103 |
75 |
65 |
|||||
Total |
6,624 |
5,754 |
4,819 |
|||||
________________
(1) |
The increase from 2019 to 2020 in Western Europe headcount includes 25 employees in the United Kingdom acquired in connection with our acquisition of Intuitus in November 2019 and 156 employees in Germany and Austria acquired in connection with our acquisition of Exozet in December 2019. |
As a result of our acquisition of CDS on August 17, 2020 our headcount increased by 509 employees.
As of June 30, 2020, we had 416 active clients, which we define as clients who paid us for services over the preceding 12-month period. Our clients principally operate in the Payments and Financial Services vertical and Technology, Media & Telecommunications, or TMT, vertical. Worldpay was our largest client for each of the last three fiscal years, contributing less than 10% in both 2020 and 2019 and 10.8% in 2018. We served clients in the geographies and key industry verticals, which are Payments and Financial Services, TMT and Other, as follows for the periods presented (by revenue):
Revenue by geography |
Fiscal Year Ended June 30, |
||||||||||
2020 |
2019 |
2018 |
|||||||||
(in thousands) |
|||||||||||
North America |
£ |
100,089 |
£ |
79,231 |
£ |
45,600 |
|||||
Europe |
85,882 |
79,186 |
73,442 |
||||||||
United Kingdom |
155,507 |
129,513 |
98,571 |
||||||||
RoW(1)
|
9,472 |
— |
— |
||||||||
Total |
£ |
350,950 |
£ |
287,930 |
£ |
217,613 |
|||||
60
Revenue by industry vertical |
Fiscal Year Ended June 30, |
||||||||||
2020 |
2019 |
2018 |
|||||||||
(in thousands) |
|||||||||||
Payments and Financial Services |
£ |
185,175 |
£ |
152,179 |
£ |
123,675 |
|||||
TMT |
90,255 |
78,888 |
61,095 |
||||||||
Other |
75,520 |
56,863 |
32,843 |
||||||||
Total |
£ |
350,950 |
£ |
287,930 |
£ |
217,613 |
|||||
We have achieved significant growth in recent periods. For the fiscal years ended June 30, 2020, 2019 and 2018,our revenue was £351.0 million, £287.9 million and £217.6 million, respectively, representing a compound annual growth rate of 27.0% over the three fiscal year period. We generated 44.3%, 45.0%, 45.3% of our revenue for the fiscal years ended June 30, 2020, 2019 and 2018, respectively, from clients located in the United Kingdom; we generated 24.5%, 27.5% and 33.7% of our revenue in each of those fiscal years, respectively, from clients located in Europe; and we generated 28.5%, 27.5% and 21.0% of our revenue in each of those fiscal years, respectively, from clients located in North America. We generated 2.7% of our revenue for the fiscal year ended June 30, 2020 from clients located in Rest of World (RoW); in previous years the revenue generated from RoW was immaterial. Our revenue growth rate at constant currency, which is a measure that is not calculated and presented in accordance with International Financial Reporting Standards, or IFRS, for the fiscal years ended June 30, 2020, 2019 and 2018 was 21.0%, 31.1% and 37.2%, respectively. Over the last five fiscal years, 89.4% of our revenue, on average, each fiscal year came from clients who purchased services from us during the prior fiscal year.
Our profit before taxes was £25.3 million, £30.1 million and £24.7 million for the fiscal years ended June 30, 2020, 2019 and 2018, and our profit before taxes as a percentage of revenue was 7.2%, 10.5% and 11.3% respectively, for the same periods. During the year ended June 30, 2020 we incurred £27.9 million of costs in connection with our non-recurring, discretionary employee bonus. The EBT funded the bonus through sales of our Class A ordinary shares. As previously disclosed, the EBT, whose beneficiaries are our employees, was holding certain Class A ordinary shares for sale in the event it decided to fund a discretionary cash bonus to our employees. Excluding the discretionary EBT bonus, profit before taxes for the fiscal year ended June 30, 2020 was £53.0 million, and profit before taxes as a percentage of revenue, 15.1%. The discretionary EBT bonus, along with other items, is excluded when presenting adjusted profit before taxes.
Our adjusted profit before taxes margin, or Adjusted PBT Margin, which is a measure that is not calculated and presented in accordance with IFRS, was 19.5%, 18.0% and 15.4%, respectively, for the fiscal years ended June 30, 2020, 2019 and 2018. See notes 1 and 6 in the section of this Annual Report on Form 20-F titled “Selected Financial Data—Non-IFRS Measures and Other Management Metrics” for a reconciliation of revenue growth rate to revenue growth rate at constant currency and for a reconciliation of profit before taxes to Adjusted PBT, respectively, the most directly comparable financial measures calculated and presented in accordance with IFRS.
Recent Acquisitions
We have in the past pursued and plan to selectively pursue in the future acquisitions focused on augmenting our core capabilities to enhance our expertise in new technologies and industry verticals and increase our geographic reach, while preserving our corporate culture and sustainably managing our growth.
In December 2017, we acquired Velocity Partners for total consideration of £45.9 million, which consisted of (1) cash consideration in the amount of £33.0 million, of which £4.4 million was held back to secure indemnification obligations, (2) contingent consideration of £11.7 million, which may be paid in the form of equity, cash or a combination of equity and cash, depending on a number of conditions and (3) £1.2 million representing amounts due to the former equity holders of Velocity Partners if we receive certain future tax refunds. The fair value of the aggregate consideration on the acquisition date was estimated at £44.9 million. In addition, in connection with the acquisition, we agreed to pay certain continuing employees of Velocity Partners up to £3.7 million in the form of equity or cash, depending on a number of conditions, as well as equity awards with respect to 30,000 Class A ordinary shares. Velocity Partners was headquartered in the United States and increased our North American client base and added nearshore delivery centers in Latin America.
61
In November 2019, we acquired Intuitus. Located in Edinburgh, UK, the acquisition of Intuitus strengthened our digital due diligence and other technology advisory services to Private Equity clients. See note 15 to our consolidated financial statements appearing elsewhere in this Annual Report on Form 20-F for further information on our acquisition of Intuitus.
In December 2019, we acquired Exozet. Headquartered in Berlin, Germany, Exozet increased our close-to-client German speaking talent and expanded our credentials in immersive experiences, media management and the automotive and broadcasting sectors. See note 15 to our consolidated financial statements appearing elsewhere in this Annual Report on Form 20-F for further information on our acquisition of Exozet.
In August 2020, we completed the acquisition of CDS by acquiring the total issued share capital of Comtrade CDS, digitalne storitve, d.o.o., a company registered in Slovenia and Comtrade Digital Services d.o.o., a company registered in Serbia. The total consideration was €60 million payable in cash, which amount remains subject to post-closing adjustments based on the cash, debt and working capital of CDS as of the closing date. Ten percent of the purchase price will be held back for 24 months and be available to satisfy any warranty or indemnity claims.
Key Factors Affecting Our Performance
We believe that the key factors affecting our performance and results of operations include our ability to:
Expand Relationships with Existing Clients
We are focused on continuing to expand our relationships with existing clients by helping them solve new problems and become more engaging, responsive and efficient. We have a demonstrated track record of expanding our work with clients after an initial engagement. In the 2019 and 2020 fiscal years, the number of clients that have a minimum annual spend with us of at least £1.0 million has grown from 63 to 65, respectively and the average spend of our 10 largest clients was £10.9 million in the 2019 fiscal year and £13.4 million in the 2020 fiscal year. Our ability to increase sales to existing clients will depend on a number of factors, including the level of clients’ satisfaction with our services, changes in clients’ strategic priorities, changes in key client personnel or strategic transactions involving clients, pricing, competition and overall economic conditions.
Add New Clients across Industry Verticals and Geographies
As of June 30, 2020, 2019 and 2018, we had 416, 275 and 258 active clients, respectively. The increase in the number of active clients in the fiscal year 2020 includes 61 acquired in connection with the acquisition of Intuitus and 85 acquired in the connection with the acquisition of Exozet. We believe that we have a significant opportunity to add new clients in our existing core verticals and geographies, and to expand our client base to new verticals and geographies.
We have established ourselves as a leader in delivering end-to-end ideation-to-production services in the Payments and Financial Services and TMT verticals. Clients in the Payments and Financial Services vertical contributed to 52.8% and 52.9% of our total revenue in the 2020 and 2019 fiscal years, respectively. Clients in the TMT vertical contributed 25.7% and 27.4% of our total revenue in the 2020 and 2019 fiscal years, respectively. Clients in other verticals contributed 21.5% and 19.7% of our total revenue in the 2020 and 2019 fiscal years, respectively. We believe that we continue to have a significant untapped opportunity in these sectors and we plan to leverage this experience to expand our vertical reach.
Attract, Retain and Efficiently Utilize Talent
We believe that our people are our most important asset. We grew our average operational headcount by 14.9% in the 2020 fiscal year and 23.9% in the 2019 fiscal year. We provide Endavans with training to develop their technical and soft skills, in an environment where they are continually challenged and given opportunities to grow as professionals, and with tools and resources to innovate. However, there is significant competition for technology professionals in the geographic regions in which our delivery centers are located and we expect that such competition is likely to continue for the foreseeable future. Further, in order to maintain our gross margin, we must maintain favorable utilization rates among our existing IT professionals, which depends on our ability to integrate and train new employees, efficiently transition employees from completed projects to new assignments, forecast demand for our services, deploy employees with appropriate skills and seniority to projects and manage attrition rates.
62
Expand Our Nearshore Delivery Capacity
We believe that Distributed Enterprise Agile at scale requires that we have teams based in locations with similar time zones to those of our clients since our delivery teams are in constant dialogue and interaction with our clients. While we believe that we have sufficient delivery center capacity to address our near-term needs and opportunities, as we continue to expand our relationships with existing clients and attract new clients, we will need to expand our teams at existing delivery centers and open new delivery centers in nearshore locations with an abundance of technical talent. However, we compete for talented individuals not only with other companies in our industry, but also with companies in other industries, and there is a limited pool of individuals who have the skills and training needed to help us grow.
Continue to Innovate
We believe that our creative skills, deep digital technical engineering capabilities and leadership in next-generation technologies have allowed us to grow our business and maintain favorable gross margins. Sustaining our competitive differentiation will depend on our ability to continue to innovate and remain at the forefront of emerging technology trends.
Management Metrics
We regularly monitor a number of financial and operating metrics to evaluate our business, measure our performance, identify trends affecting our business, formulate financial projections and make strategic decisions. Our management metrics may be calculated in a different manner than similarly titled metrics used by other companies.
Fiscal Year Ended June 30, |
|||||||||||
2020 |
2019 |
2018 |
|||||||||
(pounds in thousands) |
|||||||||||
Revenue growth rate at constant currency |
21.0 |
% |
31.1 |
% |
37.2 |
% |
|||||
Average number of employees involved in delivery of our services |
5,633 |
4,902 |
3,957 |
||||||||
Revenue concentration |
38.1 |
% |
37.7 |
% |
41.5 |
% |
|||||
Number of large clients |
65 |
63 |
46 |
||||||||
Adjusted profit before taxes margin |
19.5 |
% |
18.0 |
% |
15.4 |
% |
|||||
Adjusted free cash flow |
£ |
31,446 |
£ |
29,806 |
£ |
28,727 |
|||||
Revenue Growth Rate at Constant Currency
We monitor our revenue growth rate at constant currency. As the impact of foreign currency exchange rates is highly variable and difficult to predict, we believe revenue growth rate at constant currency allows us to better understand the underlying business trends and performance of our ongoing operations on a period-over-period basis. We calculate revenue growth rate at constant currency by translating revenue from entities reporting in foreign currencies into British Pounds using the comparable foreign currency exchange rates from the prior period. For example, the average rates in effect for the fiscal year ended June 30, 2019 were used to convert revenue for the fiscal year ended June 30, 2020 and the revenue for the comparable prior period ended June 30, 2019, rather than the actual exchange rates in effect during the respective period. Revenue growth rate at constant currency is not a measure calculated in accordance with IFRS. See note 1 in the section of this Annual Report on Form 20-F titled “Selected Financial Data—Non-IFRS Measures and Other Management Metrics” for a reconciliation of revenue growth rate at constant currency revenue growth rate, the most directly comparable measure calculated and presented in accordance with IFRS.
Average Number of Employees Involved in Delivery of Our Services
We monitor our average number of operational employees because we believe it gives us visibility into the size of both our revenue-producing base and our most significant cost base, which in turn allows us to better understand changes in our utilization rates and gross margins on a period-over-period basis. We calculate average number of
63
operational employees as the average of our number of full-time employees involved in delivery of our services on the last day of each month in the relevant period.
Revenue Concentration
We monitor our revenue concentration to better understand our dependence on large clients on a period-over-period basis and to monitor our success in diversifying our revenue base. We define revenue concentration as the percent of our total revenue derived from our 10 largest clients by revenue in each period presented.
Number of Large Clients
We monitor our number of large clients to better understand our progress in winning large contracts on a period-over-period basis. We define number of large clients as the number of clients from whom we generated more than £1.0 million of revenue in the prior 12-month period.
Adjusted Profit Before Taxes Margin
We monitor our adjusted profit before taxes margin, or Adjusted PBT Margin, to better understand our ability to manage operational costs, to evaluate our core operating performance and trends and to develop future operating plans. In particular, we believe that the exclusion of certain expenses in calculating Adjusted PBT Margin facilitates comparisons of our operating performance on a period-over-period basis. Our Adjusted PBT Margin is our Adjusted PBT as a percentage of our total revenue. Our Adjusted PBT, is our profit before taxes adjusted to exclude the impact of share-based compensation expense, discretionary EBT bonus, amortization of acquired intangible assets, realized and unrealized foreign currency exchange gains and losses, initial public offering expenses incurred, Sarbanes-Oxley compliance readiness expenses, net gain disposal of subsidiary, fair value movement of contingent consideration, secondary offering expenses incurred and stamp duty on transfer of shares. Share-based compensation expense, amortization of acquired intangible assets, unrealized foreign currency exchange gains and losses and fair value movement of contingent consideration are non-cash expenses. We do not consider these excluded items to be indicative of our core operating performance. Adjusted PBT Margin is not a measure calculated in accordance with IFRS. See note 5 in the section of this Annual Report on Form 20-F titled “Selected Financial Data—Non-IFRS Measures and Other Management Metrics” for a reconciliation of Adjusted PBT to profit before taxes, the most directly comparable financial measure calculated and presented in accordance with IFRS.
Adjusted Free Cash Flow
We monitor our adjusted free cash flow to better understand and evaluate our liquidity position and to develop future operating plans. Our adjusted free cash flow is our net cash provided by (used in) operating activities, plus grant received, less purchases of non-current tangible and intangible assets. For a discussion of grant received, see “—Components of Results of Operations—Cost of Sales” below. Adjusted free cash flow is not a measure calculated in accordance with IFRS. See note 6 in the section of this Annual Report on Form 20-F titled “Selected Financial Data—Non-IFRS Measures and Other Management Metrics” for a reconciliation of adjusted free cash flow to net cash provided by (used in) operating activities, the most directly comparable financial measure calculated and presented in accordance with IFRS.
A. Operating Results.
The key elements of our results of operations include:
Revenue
We generate revenue primarily from the provision of our services and recognize revenue in accordance with IFRS 15, “Revenue from Contracts with Customers”. Revenue is measured at fair value of the consideration received, excluding discounts, rebates, taxes and duties. We enter into master services agreements, or MSAs, with our clients, which provide a framework for services and statements of work to define the scope, timing, pricing terms and performance criteria of each individual engagement under the MSA. Our services are generally performed under time-and-material based contracts (where materials consist of travel and out-of-pocket expenses), fixed-price contracts and managed service contracts.
64
In the 2020, 2019 and 2018 fiscal years, our 10 largest clients contributed, in the aggregate, £133.8 million, or 38.1%, £108.7 million, or 37.7%, and £90.4 million, or 41.5%, of our total revenue, respectively. The following table shows the number of our clients by revenue on a trailing 12-month basis for the periods presented:
Revenue |
Fiscal Year Ended June 30, |
|||||||
2020 |
2019 |
2018 |
||||||
Over £5 Million |
15 |
15 |
8 |
|||||
£2 - £5 Million |
31 |
26 |
22 |
|||||
£1 - £2 Million |
19 |
22 |
16 |
|||||
Less than £1 Million |
351 |
212 |
212 |
|||||
Total(1)
|
416 |
275 |
258 |
|||||
Cost of Sales
Direct cost of sales consists primarily of personnel costs, including salary, bonuses, share-based compensation, benefits and travel expenses for our employees directly involved in delivery of our services, as well as software licenses and other costs that relate directly to the delivery of services. Included in the allocated cost of sales is the portion of depreciation and amortization expense attributable to the portion of our property and equipment and intangible assets utilized in the delivery of services to our clients. Our cost of sales is reported net of any income recognized from research and development credits and government grants arising from past or future operating activities where those activities are related directly to the delivery of services. We expect our cost of sales to remain relatively stable as a percentage of revenue.
In June 2013, we were awarded a grant of Romanian leu, or RON, 41.4 million (£7.94 million) from the Romanian Ministry of Finance for the creation of 500 new jobs in Romania between June 2013 and December 2015, subject to certain conditions, including continuing the newly created jobs for a five year period. To date, we have submitted claims and received £7.5 million under the grant, and there are no further claims to be submitted. Claims are subject to audit by the Romanian authorities and secured until the end of the five-year maintenance period by a letter of credit. We recognize the income from the grant over the five-year period we are required to maintain the positions as an offset to cost of sales. The receipt of a cash payment under the grant is recognized in the statement of cash flows as cash from a financing activity. To the extent the amount we received is greater or less than the amount recognized, the difference is recorded as working capital.
We are also eligible to receive credits from the United Kingdom taxing authorities for qualifying research and development expenditures on an annual basis. The credits are based on a fixed percentage (11% prior to December 31, 2017, 12% from January 1, 2018 to March 31, 2020, and 13% thereafter) of the cost of work that is directed and supervised from the United Kingdom and achieves an advance in technology that was uncertain at the outset of the work. We recognize the income from these credits as an offset to cost of sales. The receipt of credits is recognized in the statement of cash flows as cash from an operating activity.
Gross Profit
Gross profit and gross margin, or gross profit as a percentage of total revenue, has been, and will continue to be, affected by various factors, including wage inflation and the impact of foreign exchange in the countries in which we operate.
Selling, General and Administrative Expenses
Personnel costs, including salaries, bonuses, sales commissions and benefits are the most significant component of selling, general and administrative expenses. Included in selling, general and administrative expenses relating to sales and marketing expense are costs related to marketing programs and travel. Marketing programs consist of advertising, events, corporate communications and brand-building activities. Included in other selling, general and
65
administrative expenses to general and administrative expense are external legal, accounting and other professional fees, as well as acquisition-related transaction costs. Selling, general and administrative expenses also include facilities-related and information technology hardware and software costs. Selling, general and administrative expenses includes share-based compensation expense for employees in our selling, general and administrative functions. Selling, general and administrative expenses also includes allocated operating lease expense and depreciation and amortization, which consists primarily of depreciation of property, plant and equipment, as well as the amortization of software and licenses and intangible assets acquired through acquisitions (client relationships and non-compete agreements).
Net Finance Income/(Expense)
Finance costs consist primarily of interest expense on borrowings and leases, running costs related to our revolving credit facility, unwinding of the discount on acquisition holdbacks and contingent consideration, losses on disposal of available-for-sale financial assets, dividends on preference shares classified as liabilities and reclassifications of amounts previously recognized in other comprehensive income. Borrowing costs that are not directly attributable to the acquisition, construction or production of a qualifying asset are recognized in profit or loss using the effective interest method. Finance income consists of interest income on funds invested. Interest income is recognized as it accrues in profit or loss, using the effective interest method.
Net finance income/(expense) also reflects the net effect of realized and unrealized foreign currency exchange gains and losses.
Gain on Sale of Subsidiary
On June 1, 2019, Endava entered into an agreement to sell Endava Technology SRL, or the Captive, to Worldpay and to terminate the option and transfer agreement. On August 31, 2019 the transaction was completed and the employees of the Captive became employees of Worldpay.
Provision for Income Taxes
We are subject to income taxes in the United Kingdom, Romania, the United States and numerous other jurisdictions. Our provision for income taxes, which is reflected on our statement of comprehensive income as “tax on profit on ordinary activities,” consists primarily of liabilities for taxes due to, or potential claims from, tax authorities in the jurisdictions in which we operate. Calculation of current tax is based on tax rates and tax laws that have been enacted or substantively enacted at the end of the applicable reporting period.
Our effective tax rates differ from the statutory rate applicable to us primarily due to: differences between domestic and foreign jurisdiction tax rates; tax credits and non-taxable items; non-deductible share-based compensation expenses; and other non-deductible expenses. Changes in the geographic mix of revenue can also cause our overall effective tax rate to vary from period to period. Tax expense is recognized in profit or loss based on the sum of deferred tax and current tax not recognized in other comprehensive income or directly in equity
Critical Accounting Policies and Significant Judgments and Estimates
We prepare our consolidated financial statements in accordance with IFRS, which require us to make judgments, estimates and assumptions that affect the amounts reported in those financial statements and accompanying notes. We base our estimates and assumptions on historical experience and other factors that we believe to be reasonable under the circumstances. These estimates and underlying assumptions are reviewed on an ongoing basis. Although we believe that the estimates we use are reasonable, due to the inherent uncertainty involved in making those estimates, actual results reported in future periods could differ from those estimates.
Some of our accounting policies require higher degrees of judgment than others in their application. We believe that the following accounting policies involve a high degree of judgment and complexity. Accordingly, these are the policies we believe are the most critical to aid in fully understanding and evaluating our consolidated financial condition and results of our operations. See note 3 to our consolidated financial statements appearing elsewhere in this Annual Report on Form 20-F for a description of our other significant accounting policies.
66
Business Combinations
Business acquisitions are accounted for using the acquisition method. The results of businesses acquired in a business combination are included in our consolidated financial statements from the date of the acquisition. Purchase accounting results in assets and liabilities of an acquired business being recorded at their estimated fair values on the acquisition date. Any excess consideration over the fair value of assets acquired and liabilities assumed is recognized as goodwill.
We perform valuations of assets acquired and liabilities assumed on each acquisition accounted for as a business combination and allocate the purchase price to the tangible and intangible assets acquired and liabilities assumed based on our best estimate of fair value. In making these determinations, we are required to make estimates and assumptions that affect the recorded amounts, including future revenue growth, client attrition rates, and discount rates impacting the valuation of client relationship intangible assets. To assist us in making these fair value determinations, we may engage third party valuation specialists.
We determine the appropriate useful life of intangible assets by performing an analysis of cash flows based on historical experience of the acquired businesses. Intangible assets are amortized over their estimated useful lives based on the pattern in which the economic benefits associated with the asset are expected to be consumed, which to date has approximated the straight-line method of amortization.
Any contingent consideration payable is measured at fair value at the acquisition date. If the contingent consideration is classified as equity, it is not re-measured and settlement is accounted for within equity. Otherwise, subsequent changes in the fair value of contingent consideration are recognized in profit and loss.
Transaction costs associated with business combinations are expensed as incurred and are included in selling, general and administrative expenses.
Further detailed information in relation to business combinations is included in note 15 to the financial statements.
Recoverability of trade and other receivables
We initially recognize trade and other receivables at fair value, which is usually the original invoiced amount. They are subsequently carried at amortized cost using the effective interest method. The carrying amount of these balances approximates to fair value due to the short maturity of amounts receivable.
Trade receivables are non-interest bearing and are generally on 30 to 90 day terms depending on the geographical territory in which sales are generated. We know that certain debts due to us may not be paid through the default of a small number of our customers. Accordingly, we recognize an expected credit loss allowance, which is deducted from the gross carrying amount of the receivable. The allowance is calculated by reference to credit losses expected to be incurred over the lifetime of the receivable. In estimating a loss allowance we consider historical experience and forward-looking informed credit assessment relating to customer specific trends and conditions alongside other factors such as the current state of the economy and particular industry issues. We consider reasonable and supportable information that is relevant and available without undue cost or effort. Due to the global financial uncertainty arising from the COVID-19 pandemic, management has considered the elevated credit risk on trade receivables. In addition, certain balances (where there was an objective evidence of credit impairment) have been provided for on an individual basis.
Recent Accounting Pronouncements
See note 2 to our consolidated financial statements appearing elsewhere in this Annual Report on Form 20-F for a description of the application of new and revised international financial reporting standards.
67
Results of Operations
The following table sets forth our consolidated statements of comprehensive income data for the periods presented:
Fiscal Year Ended June 30, |
|||||||||||
2020 |
2019 |
2018 |
|||||||||
(in thousands) |
|||||||||||
Consolidated Statements of Comprehensive Income Data: |
|||||||||||
Revenue |
£ |
350,950 |
£ |
287,930 |
£ |
217,613 |
|||||
Cost of sales: |
|||||||||||
Direct cost of sales(1)
|
(233,352 |
) |
(174,152 |
) |
(132,775 |
) |
|||||
Allocated cost of sales |
(17,447 |
) |
(14,951 |
) |
(12,668 |
) |
|||||
Total Cost of sales |
(250,799 |
) |
(189,103 |
) |
(145,443 |
) |
|||||
Gross profit |
100,151 |
98,827 |
72,170 |
||||||||
Selling, general and administrative expenses(1)
|
(78,279 |
) |
(65,857 |
) |
(46,737 |
) |
|||||
Operating profit |
21,872 |
32,970 |
25,433 |
||||||||
Net finance income/(expense) |
1,169 |
(2,870 |
) |
(783 |
) |
||||||
Gain on sales of subsidiary |
2,215 |
— |
— |
||||||||
Profit before tax |
25,256 |
30,100 |
24,650 |
||||||||
Tax on profit on ordinary activities |
(3,846 |
) |
(6,093 |
) |
(5,675 |
) |
|||||
Profit for the year and profit attributable to the equity holders of the Company |
£ |
21,410 |
£ |
24,007 |
£ |
18,975 |
|||||
________________
(1) |
Includes share-based compensation expense as follows: |
Fiscal Year Ended June 30, |
|||||||||||
2020 |
2019 |
2018 |
|||||||||
(in thousands) |
|||||||||||
Direct cost of sales |
£ |
8,941 |
£ |
5,724 |
£ |
1,006 |
|||||
Selling, general and administrative expenses |
6,722 |
6,298 |
499 |
||||||||
Total |
£ |
15,663 |
£ |
12,022 |
£ |
1,505 |
|||||
68
The following table sets forth our consolidated statements of comprehensive income data expressed as a percentage of total revenue:
Fiscal Year Ended June 30, |
||||||||
2020 |
2019 |
2018 |
||||||
Consolidated Statements of Comprehensive Income Data: |
||||||||
Revenue |
100 |
% |
100 |
% |
100 |
% |
||
Cost of sales: |
||||||||
Direct cost of sales |
(66.5 |
)% |
(60.5 |
)% |
(61.0 |
)% |
||
Allocated cost of sales |
(5.0 |
)% |
(5.2 |
)% |
(5.8 |
)% |
||
Total Cost of sales |
(71.5 |
)% |
(65.7 |
)% |
(66.8 |
)% |
||
Gross profit |
28.5 |
% |
34.3 |
% |
33.2 |
% |
||
Selling, general and administrative expenses |
(22.3 |
)% |
(22.9 |
)% |
(21.5 |
)% |
||
Operating profit |
6.2 |
% |
11.5 |
% |
11.7 |
% |
||
Net finance income/(expense) |
0.3 |
% |
(1.0 |
)% |
(0.4 |
)% |
||
Gain on sale of subsidiary |
0.6 |
% |
— |
% |
— |
% |
||
Profit before tax |
7.2 |
% |
10.5 |
% |
11.3 |
% |
||
Tax on profit on ordinary activities |
(1.1 |
)% |
(2.1 |
)% |
(2.6 |
)% |
||
Profit for the year and profit attributable to the equity holders of the Company |
6.1 |
% |
8.3 |
% |
8.7 |
% |
||
Adoption of IFRS 16 Leases
Fiscal year 2020 is the first fiscal year in which the Group has prepared following adoption of IFRS 16 Leases. The application of IFRS 16 has resulted in a material gross up of the Consolidated Balance Sheet and a reclassification of charges previously booked to cost of sales and operating expenses to depreciation and interest expense. The impact on the Consolidated Statement of Comprehensive Income is not significant as included in the allocated cost of sales is the portion of depreciation and amortization expense attributable to the portion of our property and equipment and intangible assets utilized in the delivery of services to our clients, including depreciation of right-of-use assets. The net impact on profit before tax is immaterial and the approach to adopting the new standard has not required comparative information to be restated.
Comparison of the Years Ended June 30, 2020, 2019 and 2018
Revenue
Year Ended June 30, |
% Change |
||||||||||||||||
2020 |
2019 |
2018 |
2020 vs.
2019
|
2019 vs.
2018
|
|||||||||||||
(pounds in thousands) |
|||||||||||||||||
Revenue |
£ |
350,950 |
£ |
287,930 |
£ |
217,613 |
21.9 |
% |
32.3 |
% |
|||||||
2020 Compared to 2019. Revenue for 2020 was £351.0 million, an increase of £63.0 million, or 21.9%, over 2019. In constant currency terms, revenue grew by 21.0% over 2019. We achieved significant growth in revenue across all verticals. Revenue from clients in the Payments and Financial Services vertical increased by £33.0 million, or 21.7%, to £185.2 million in 2020 from £152.2 million in 2019. Revenue from clients in the TMT vertical increased by £11.4 million, or 14.4%, to £90.3 million in 2020 from £78.9 million in 2019. Revenue from clients in our Other vertical also grew significantly, increasing by £18.7 million, or 32.8%, to £75.5 million in 2020 from £56.9 million in 2019. The acquired operations of Intuitus contributed £3.4 million in 2020, particularly within our Other vertical and in the
69
United Kingdom. The acquired operations of Exozet contributed £8.0 million in 2020, particularly within our TMT vertical and in Europe. Revenue also grew across all geographies. Revenue from clients based in Europe increased by £6.7 million, or 8.5%, to £85.9 million in 2020 from £79.2 million in 2019. Revenue from clients based in the United Kingdom increased by £26.0 million, or 20.1%, to £155.5 million in 2020 from £129.5 million in 2019. Revenue from clients based in North America increased by £20.9 million, or 26.3%, to £100.1 million in 2020 from £79.2 million in 2019. We generated 2.7% of our revenue for the fiscal year ended June 30, 2020 from clients located in Rest of World (RoW), while in previous years the revenue generated from RoW was immaterial. Revenue from our top 10 clients in 2020 increased by £25.1 million, or 23.1%, to £133.8 million compared to £108.7 million in revenue from our top 10 clients in 2019.
2019 Compared to 2018. Revenue for 2019 was £287.9 million, an increase of £70.3 million, or 32.3%, over 2018. In constant currency terms, revenue grew by 31.1% over 2018. We achieved significant growth in revenue across all verticals. Revenue from clients in the Payments and Financial Services vertical increased by £28.5 million, or 23.0%, to £152.2 million in 2019 from £123.7 million in 2018. Revenue from clients in the TMT vertical increased by £17.8 million, or 29.1%, to £78.9 million in 2019 from £61.1 million in 2018. Revenue from clients in our Other vertical also grew significantly, increasing by £24.0 million, or 73.1%, to £56.9 million in 2019 from £32.8 million in 2018. Revenue also grew across all geographies. Revenue from clients based in Europe increased by £5.7 million, or 7.8%, to £79.2 million in 2019 from £73.4 million in 2018. Revenue from clients based in the United Kingdom increased by £30.9 million, or 31.4%, to £129.5 million in 2019 from £98.6 million in 2018. Revenue from clients based in North America increased by £33.6 million, or 73.8%, to £79.2 million in 2019 from £45.6 million in 2018. Revenue from our top 10 clients in 2019 increased by £18.3 million, or 20.3%, to £108.7 million compared to £90.4 million in revenue from our top 10 clients in 2018.
Cost of Sales
Year Ended June 30, |
% Change |
||||||||||||||||
2020 |
2019 |
2018 |
2020 vs.
2019
|
2019 vs.
2018
|
|||||||||||||
(pounds in thousands) |
|||||||||||||||||
Cost of sales |
|||||||||||||||||
Direct cost of sales |
£ |
(233,352 |
) |
£ |
(174,152 |
) |
£ |
(132,775 |
) |
34.0 |
% |
31.2 |
% |
||||
Allocated cost of sales |
(17,447 |
) |
(14,951 |
) |
(12,668 |
) |
16.7 |
% |
18.0 |
% |
|||||||
Total Cost of sales |
(250,799 |
) |
(189,103 |
) |
(145,443 |
) |
32.6 |
% |
30.0 |
% |
|||||||
Gross margin |
28.5 |
% |
34.3 |
% |
33.2 |
% |
|||||||||||
2020 Compared to 2019. Total cost of sales increased by £61.7 million, or 32.6%, in 2020 compared to 2019. The increase consisted of a £59.2 million increase in direct cost of sales, as a result of increased personnel costs, which reflected an increase in the average number of employees involved in delivery of our services from 4,902 in 2019 to 5,633 in 2020. Our growth in operational headcount consisted of new employees located in Western Europe, acquired in connection with the acquisition of Intuitus and Exozet, as well as continued organic growth in the number of employees at our existing delivery centers. Cost of sales also includes £25.4 million of costs incurred in connection with our non-recurring, discretionary EBT employee bonus. Grant income decreased by £0.1 million in 2020 compared to 2019 and research and development credits increased by £0.3 million in 2020 compared to 2019. Included in the allocated cost of sales is the portion of depreciation and amortization expense attributable to the portion of our property and equipment and intangible assets utilized in the delivery of services to our clients. This increased by £2.5 million in 2020 compared to 2019, or 16.7% due to the increase in size of our delivery organization. Gross margin decreased to 28.5% in 2020 from 34.3% in 2019. Excluding the non-recurring cost of the discretionary EBT bonus, gross margin would have increased to 35.8% in 2020.
2019 Compared to 2018. Total cost of sales increased by £43.7 million, or 30.0%, in 2019 compared to 2018. The increase consisted of a £41.4 million increase in direct cost of sales, primarily as a result of increased personnel costs, which reflected an increase in the average number of employees involved in delivery of our services from 3,957 in 2018 to 4,902 in 2019. Our growth in operational headcount consisted of continued organic growth in the number of
70
employees at our delivery centers. Grant income decreased by £0.8 million in 2019 compared to 2018 and research and development credits increased by £0.3 million in 2019 compared to 2018. Additionally, allocated cost of sales increased by £2.3 million in 2019 compared to 2018, or 18.0%, primarily as a result of increased property costs and increased headcount. Gross margin increased to 34.3% in 2019 from 33.2% in 2018.
Selling, General and Administrative Expenses
Year Ended June 30, |
% Change |
||||||||||||||||
2020 |
2019 |
2018 |
2020 vs.
2019
|
2019 vs.
2018
|
|||||||||||||
(pounds in thousands) |
|||||||||||||||||
Selling, general and administrative expenses |
£ |
(78,279 |
) |
£ |
(65,857 |
) |
£ |
(46,737 |
) |
18.9 |
% |
40.9 |
% |
||||
% of revenue |
(22.3 |
)% |
(22.9 |
)% |
(21.5 |
)% |
|||||||||||
2020 Compared to 2019. Selling, general and administrative expenses increased by £12.4 million, or 18.9% in 2020 compared to 2019. The increase in total selling, general and administrative expenses is primarily related to an increase of £6.9 million in general and administrative expenses as a result of increased support functions costs in line with growth, increased M&A costs, plus Sarbanes-Oxley compliance expenses. General and administrative expenses also includes £2.5 million of costs incurred in connection with our non-recurring, discretionary EBT employee bonus. Sales and marketing expenses increased by £4.7 million. Depreciation and amortization increased by £2.1 million, or 51.8%, in 2020 compared to 2019, primarily as a result of a £0.6 million increase in amortization of acquired intangible assets acquired. As a percentage of revenue, selling, general and administrative expenses decreased from 22.9% to 22.3%. Excluding the non-recurring cost of the discretionary EBT bonus, as a percentage of revenue, selling, general and administrative expenses would have decreased to 21.6% in 2020. Selling, general and administrative expenses as a percentage of revenue remained flat when excluding non-recurring costs in 2019, which would have been 21.7%.
2019 Compared to 2018. Selling, general and administrative expenses increased by £19.1 million, or 40.9% in 2019 compared to 2018. The increase in total selling, general and administrative expenses is primarily related to an increase of £15.6 million in general and administrative expenses as a result of increased support functions costs involved with public company running costs. General and administrative expenses also includes £3.5 million of costs incurred in connection with our initial and follow on offerings, plus Sarbanes-Oxley compliance expenses. Sales and marketing expenses increased by £2.0 million. Depreciation and amortization increased by £1.0 million, or 33.4%, in 2019 compared to 2018, primarily as a result of a £0.8 million increase in amortization of acquired intangible assets acquired. As a percentage of revenue, selling, general and administrative expenses increased from 21.5% to 22.9%, reflecting increased expenditures in public company operating costs.
Net Finance Income/(Expense)
Year Ended June 30, |
% Change |
||||||||||||||||
2020 |
2019 |
2018 |
2020 vs.
2019
|
2019 vs.
2018
|
|||||||||||||
(pounds in thousands) |
|||||||||||||||||
Net finance income/(expense) |
£ |
1,169 |
£ |
(2,870 |
) |
£ |
(783 |
) |
(140.7 |
)% |
266.5 |
% |
|||||
% of revenue |
0.3 |
% |
(1.0 |
)% |
(0.4 |
)% |
|||||||||||
2020 Compared to 2019. In 2020, we recognized net finance income of £1.2 million, which included a charge to lease interest of £1.1 million related to the first time application in 2020 of IFRS16 accounting treatment and a £2.1 million gain related to changes in foreign exchange rates. In 2019, net finance expense included a £6.0 million cost relating to the fair value movement of contingent consideration and £2.9 million gain related to changes in foreign exchange rates.
71
2019 Compared to 2018. In 2019, we recognized net finance expense of £2.9 million, which included a £6.0 million cost relating to the fair value movement of contingent consideration and £2.9 million gain related to changes in foreign exchange rates. In 2018, we recognized net finance expense of £0.8 million, which included £0.6 million related to interest payable on amounts outstanding under our credit facility.
Gain from Sale of Subsidiary
Year Ended June 30, |
% Change |
||||||||||||||||
2020 |
2019 |
2018 |
2020 vs.
2019
|
2019 vs.
2018
|
|||||||||||||
(pounds in thousands) |
|||||||||||||||||
Gain from sale of subsidiary |
£ |
2,215 |
£ |
— |
£ |
— |
100.0 |
% |
— |
% |
|||||||
% of revenue |
0.6 |
% |
— |
% |
— |
% |
|||||||||||
2020 compared to 2019. On June 1, 2019, Endava entered into an agreement to sell the Captive to Worldpay and to terminate the option and transfer agreement. On August 31, 2019 the transaction was completed and the employees of the Captive became employees of Worldpay. The aggregate selling price of the Captive was £3.6 million and the Group recognized a gain on disposal of subsidiary of £2.2 million.
Provision for Income Tax
Year Ended June 30, |
% Change |
||||||||||||||||
2020 |
2019 |
2018 |
2020 vs.
2019
|
2019 vs.
2018
|
|||||||||||||
(pounds in thousands) |
|||||||||||||||||
Provision for income taxes |
£ |
(3,846 |
) |
£ |
(6,093 |
) |
£ |
(5,675 |
) |
(36.9 |
)% |
7.4 |
% |
||||
2020 Compared to 2019. Provision for income taxes decreased by £2.2 million, or (36.9)%, in 2020 compared to 2019. Our annual effective tax rate for 2020 was 15.2%, compared to an annual effective tax rate of 20.2% for 2019. In 2020, our effective tax rate decreased compared to 2019 primarily due to the non-taxability of the gain on the sale of the Worldpay Captive subsidiary and one-off tax measures introduced by governments in response to the COVID-19 pandemic.
2019 Compared to 2018. Provision for income taxes increased by £0.4 million, or 7.4%, in 2019 compared to 2018. Our annual effective tax rate for 2019 was 20.2%, compared to an annual effective tax rate of 23.0% for 2018. In 2019, our effective tax rate decreased compared to 2018 primarily due to non-deductible expenses arising in 2018 in relation to our initial public offering.
B. Liquidity and Capital Resources.
Capital Resources
To date, we have financed our operations primarily through sales of information technology services, as well as borrowings under our revolving credit facilities and through our initial public offering that we completed in July 2018. As of June 30, 2020, we had £101.3 million in cash and cash equivalents.
In October 2019, we entered into the Facility Agreement. The Facility Agreement is an unsecured revolving credit facility in the amount of £200 million with an initial period of three years, and it replaces the existing £50 million secured facility with HSBC UK Bank Plc. The Facility Agreement also provides for uncommitted accordion options for up to an aggregate of £75 million in additional borrowing. The Facility Agreement is intended to support the Company’s and its subsidiaries' future capital investments and development activities. The Facility Agreement matures on October 12, 2022. Loans under the Facility Agreement bear interest, at our option, at a rate equal to either the LIBOR rate, the EURIBOR rate or the ROBOR rate, plus an applicable margin ranging from 0.8% to 1.50% per annum, based upon the net leverage ratio. Our obligations under the Facility Agreement are guaranteed by some of our subsidiaries.
72
The Facility Agreement contains customary representations and warranties and customary affirmative and negative covenants applicable to the facility parties and our consolidated subsidiaries. Under the terms of the Facility Agreement, we are required to comply with net leverage ratio and interest coverage covenants. The Facility Agreement contains customary events of default. As of June 30, 2020, there was no amount outstanding under the £200 million primary facility apart from £8.7 million utilized for bank guarantees issued by HSBC UK Bank plc and no breach of any covenant.
On completion of our initial public offering, we received £40.2 million net proceeds. A portion of the net proceeds were used to repay all amounts borrowed under the previous revolving credit facility in August 2018.
Future Capital Requirements
We believe that our existing cash and cash equivalents, together with cash generated from our operations, will be sufficient to meet our working capital expenditure requirements for at least the next 12 months. Our future capital requirements will depend on many factors, including our growth rate and any acquisitions we may complete.
Cash Flows
The following table shows a summary of our cash flows for the years ended June 30, 2020, 2019 and 2018:
Year Ended June 30, |
|||||||||||
2020 (£) |
2019 (£) |
2018 (£) |
|||||||||
(in thousands) |
|||||||||||
Cash and cash equivalents at beginning of the year |
£ |
70,172 |
£ |
15,048 |
£ |
23,571 |
|||||
Net cash from operating activities |
40,243 |
35,348 |
33,984 |
||||||||
Net cash used in investing activities |
(29,748 |
) |
(10,051 |
) |
(31,792 |
) |
|||||
Net cash from / (used in) financing activities |
20,878 |
26,355 |
(10,732 |
) |
|||||||
Effects of exchange rates on cash and cash equivalents |
(218 |
) |
3,472 |
17 |
|||||||
Cash and cash equivalents at end of the year |
£ |
101,327 |
£ |
70,172 |
£ |
15,048 |
|||||
Operating Activities
Operating activities provided £40.2 million of cash in the year ended June 30, 2020, primarily from profit before tax of £25.3 million and other non-cash items of £28.6 million, offset by tax paid of £5.9 million and net changes in working capital of £7.8 million. The net changes in working capital were primarily driven by a net increase in trade receivables and accrued income of £11.9 million and an increase in prepayments of £3.2 million, partially offset by an increase in accruals of £4.3 million, an increase in VAT and payroll taxes payable of £2.1 million and an increase in deferred income of £0.8 million.
Operating activities provided £35.3 million of cash in the year ended June 30, 2019, primarily from profit before tax of £30.1 million, a U.K. research and development credit received of £1.3 million and other non-cash items of £21.4 million, offset by tax paid of £5.9 million and net changes in working capital of £11.5 million. The net changes in working capital were primarily driven by a net increase in trade receivables and accrued income of £13.8 million, partially offset by an increase in other creditors of £1.4 million and an increase in accruals of £1.3 million.
Operating activities provided £34.0 million of cash in the year ended June 30, 2018, primarily from profit before tax of £24.7 million, a U.K. research and development credit received of £1.9 million, net changes in working capital of £6.8 million and other non-cash items of £6.2 million, partially offset by tax paid of £5.6 million. The net changes in working capital were primarily driven by an increase in accruals of £16.4 million, partially offset by a net increase in trade receivables and accrued income of £4.0 million, a decrease in other creditors of £3.3 million and an increase in prepayments of £2.3 million.
73
Investing Activities
Investing activities used £29.7 million of cash in the year ended June 30, 2020, including £15.2 million (net of the cash acquired) to fund the acquisition of Exozet, £6.5 million (net of the cash acquired) to fund the acquisition of Intuitus, £1.6 million for settling the holdback amount and tax refund consideration from the acquisition of Velocity Parners, £7.4 million for purchases of property, plant and equipment relating to our delivery centers and £2.5 million for purchases of software and licenses, partially offset by the net proceeds of £2.7 million (net of cash disposed of) from sale of the Captive to Worldpay and £0.5 million interest received on bank deposits.
Investing activities used £10.1 million of cash in the year ended June 30, 2019, including £3.2 million(net of the cash acquired) to fund the acquisition of Velocity Partners, £6.1 million for purchases of property, plant and equipment relating to our delivery centers and £1.3 million for purchases of software and licenses.
Investing activities used £31.8 million of cash in the year ended June 30, 2018, including £26.4 million (net of the cash acquired) to fund the acquisition of Velocity Partners, £3.7 million for purchases of property, plant and equipment relating to our delivery centers and £1.8 million for purchases of software and licenses
Financing Activities
Financing activities provided £20.9 million of cash in the year ended June 30, 2020, including £30.9 million of proceeds from sale of EBT shares, £0.9 million in grants from the Romanian, Serbian and North Macedonian governments and proceeds from sublease £0.7 million, partially offset by £9.9 million repayment of lease liabilities, £1.0 million repayment of borrowings and £0.8 million of interest payments.
Financing activities provided £26.4 million of cash in the year ended June 30, 2019, including £44.8 million net proceeds from our Initial Public Offering and £1.8 million in grants from the Romanian and North Macedonian governments, partially offset by £20.0 million repayment of net borrowings under our credit facility and £0.3 million of interest payments.
Financing activities used £10.7 million of cash in the year ended June 30, 2018, including £10.3 million of net borrowings under our credit facility and £0.6 million of interest payments, partially offset by £0.1 million in grants from the North Macedonian government.
C. Research and Development, Patents and Licenses, etc.
Not applicable.
D. Trend Information.
For a discussion of trends, see “Item 5.A—Operating Results” and “Item 5.B—Liquidity and Capital Resources.”
E. Off-Balance Sheet Arrangements.
We did not have during the periods presented, and we do not currently have, any off-balance sheet financing arrangements or any relationships with unconsolidated entities or financial partnerships, including entities sometimes referred to as structured finance or special purpose entities, that were established for the purpose of facilitating off-balance sheet arrangements or other contractually narrow or limited purposes.
74
F. Tabular Disclosure of Contractual Obligations.
Contractual Obligations and Commitments
The following table summarizes our commitments to settle contractual obligations as of June 30, 2020 and the effect such obligations are expected to have on our liquidity and cash flows:
Less than 1 Year |
1 to 3
Years
|
3 to 5
Years
|
More than 5 Years |
Total |
|||||||||||||||
(in thousands) |
|||||||||||||||||||
Lease liabilities |
£ |
11,132 |
£ |
18,852 |
£ |
11,791 |
£ |
16,168 |
£ |
57,943 |
|||||||||
Short-term leases |
169 |
— |
— |
— |
169 |
||||||||||||||
Leases contracted, but not yet commenced |
799 |
6,040 |
6,005 |
13,936 |
26,780 |
||||||||||||||
Other long-term liabilities |
— |
136 |
— |
— |
136 |
||||||||||||||
Total |
£ |
12,100 |
£ |
25,028 |
£ |
17,796 |
£ |
30,104 |
£ |
85,028 |
|||||||||
As of June 30, 2020, we have property leases that expire at various dates through June 2031.
G. Safe Harbor.
This Annual Report on Form 20-F contains forward-looking statements within the meaning of Section 27A of the Securities Act and Section 21E of the Exchange Act and as defined in the Private Securities Litigation Reform Act of 1995. See “Cautionary Statement Regarding Forward-Looking Statements.”
Item 6. Directors, Senior Management and Employees
75
A. Directors and Senior Management.
MANAGEMENT
Executive Officers and Directors
The following table sets forth certain information with respect to our executive officers and directors, including their ages as of August 15, 2020:
Name |
Age |
Position(s) |
||
Executive Officers |
||||
John Cotterell |
59 |
Chief Executive Officer, Director |
||
Mark Thurston |
56 |
Chief Financial Officer, Director |
||
Rob Machin |
47 |
Chief Operating Officer |
||
Julian Bull |
50 |
Chief Commercial Officer |
||
Rohit Bhoothalingam |
47 |
General Counsel |
||
Non-Employee Directors |
||||
Trevor Smith |
65 |
Chairman of the Board of Directors |
||
Andrew Allan |
64 |
Director |
||
Sulina Connal |
52 |
Director |
||
Ben Druskin |
52 |
Director |
||
Mike Kinton |
73 |
Director |
||
David Pattillo |
60 |
Director |
||
Unless otherwise indicated, the current business addresses for our executive officers and directors is c/o Endava plc, 125 Old Broad Street, London EC2N 1AR, United Kingdom.
Each executive officer serves at the discretion of our board of directors and holds office until his or her successor is duly elected or qualified or until his or her earlier resignation or removal. There are no family relationships among any of our executive officers or directors.
Executive Officers
John Cotterell founded our company and has served as our Chief Executive Officer and as a member of our board of directors since our inception in February 2000. Mr. Cotterell holds a B.Eng. from the University of Bristol and an M.B.A. from the Alliance Manchester Business School. Our board of directors believes that Mr. Cotterell’s leadership of our company since its inception and experience with information technology companies prior to founding our company provide him with the qualifications and skills to serve as a director.
Mark Thurston has served as our Chief Financial Officer and as a member of our board of directors since April 2015. From May 2011 to March 2015, Mr. Thurston served as Group Finance Director at Paragon Education and Skills Ltd. Mr. Thurston holds a Physics degree from Durham University and is a member of the Institute of Chartered Accountants in England and Wales. Our board of directors believes that Mr. Thurston’s perspective and experience as our Chief Financial Officer provide him with the qualifications and skills to serve as a director.
Rob Machin has served as our Chief Operating Officer since July 2017 and previously served as a member of our board of directors from September 2013 to June 2016. Mr. Machin originally joined Endava in 2000 as our Chief Technical Officer. From September 2007 to September 2010, Mr. Machin served as an Executive Director at UBS Investment Bank. Mr. Machin re-joined Endava in 2010 as our U.K. Managing Director. Mr. Machin is a Fellow of the British Computer Society and a Chartered IT Professional. Mr. Machin holds a first class honors degree from Durham University in Mathematics and Philosophy (B.Sc. Nat Sci).
76
Julian Bull has served as our Chief Commercial Officer since July 2016. From April 2001 to June 2016, Mr. Bull served as our Sales and Marketing Director.
Rohit Bhoothalingam was appointed as our General Counsel in March 2019. Prior to joining Endava, he served as the Associate General Counsel for VEON, a Nasdaq and Euronext-listed digital and telecommunications company from October 2016 until August 2018. From December 2008 to December 2014, Mr. Bhoothalingam was the General Counsel at London Mining Plc, a global mining company, and from December 2014 to July 2016, he served as Consulting General Counsel at London Mining Plc. Mr. Bhoothalingam studied law at Cambridge University and holds a Masters in Law from Georgetown University Law Center.
Non-Employee Directors
Trevor Smith has served as a member of our board of directors since June 2013 and our chairman since July 2016. Prior to his retirement, Mr. Smith held various roles at Goldman, Sachs & Co., an investment bank, including Chief Information Officer for the EMEA Region from January 2000 to September 2009 and in a part-time Business Resiliency & Crisis Management and Special Project role from March 2010 until June 2013. Mr. Smith holds a B.Sc. in Economics from UCW Aberystwyth. Our board of directors believes that Mr. Smith’s experience in information technology and delivery of large projects provide him with the qualifications and skills to serve as a director.
Andrew Allan has served as a member of our board of directors since April 2006, having previously served as a member of the board of Brains Direct Ltd, which we acquired in April 2006. He currently serves as Managing Partner at Fairways Corporate Finance, a position he has held since May 2003. Mr. Allan is a qualified Chartered Accountant and a current member of the Institute of Chartered Accountants of Scotland. Mr. Allan holds a Bachelor’s degree in Finance from the University of Strathclyde. Our board of directors believes that Mr. Allan’s business experience provide him with the qualifications and skills to serve as a director.
Sulina Connal has served as a member of our board of directors since September 25, 2019. Since April 2020, she has served as Director of Product Partnerships for News, Web and Publishing for EMEA for Google. Previously, Ms. Connal served as the Director of Mobile and Connectivity Partnerships at Facebook from October 2017 to April 2020. Prior to that, from April 2014 until September 2017, she served as the Senior Vice President of Strategic Partnerships at Orange. Ms. Connal holds an M.A. from the University of Oxford. Our board of directors believes that Ms. Connal’s business experience provides her with the qualifications and skills to serve as a director.
Ben Druskin has served as a member of our board of directors since September 2017. Mr. Druskin retired from Citigroup in August 2017. From 2014 until his retirement, Mr. Druskin served as the Chairman of the Global Technology, Media and Telecom Investment Banking Group. Prior to becoming Chairman, Mr. Druskin was co-head of the Global Technology, Media and Telecom Investment Banking Group. Mr. Druskin has served as a member of the board of directors of Zensar Technologies since November 2017. Mr. Druskin holds a B.A. in Economics from Rutgers College and an M.B.A. in Finance from The Stern School of Business at New York University. Our board of directors believes that Mr. Druskin’s expertise in capital raising and mergers and acquisitions provide him with the qualifications and skills to serve as a director.
Mike Kinton has served as a member of our board of directors since April 2006. Since July 1999, Mr. Kinton has served as Managing Director at Kinton Technology Ltd. Mr. Kinton has served as a member of the board of directors of PaperRound HND Services Ltd, since February 2005 and Prmax Ltd., since March 2007. Mr. Kinton holds an M.A. from the University of Cambridge and a M.S. from London Business School. Our board of directors believes that Mr. Kinton’s experience in the information technology industry, as well as his valuable experience gained from prior and current board service, provides him with the qualifications and skills to serve as a director.
David Pattillo has served as a member of our board of directors since January 2017. From February 2014 to January 2019, Mr. Pattillo served as the Chief Financial Officer and member of the board of directors of ClearStar, Inc. From June 2012 to December 2013, Mr. Pattillo served as Manager of Dapa, LLC. Mr. Pattillo holds a B.S. from Clemson University and an MBA from the University of Georgia – Terry College of Business. Our board of directors believes that Mr. Pattillo’s knowledge of the information technology industry provides him with the qualifications and skills to serve as a director.
77
B. Compensation.
The following discussion provides the amount of compensation paid, and benefits in-kind granted, by us and our subsidiaries to our directors, executive officers and non-employee directors for services in all capacities to us and our subsidiaries for the fiscal year ended June 30, 2020, as well as the amount contributed by us or our subsidiaries into money purchase plans for the fiscal year ended June 30, 2020 to provide pension, retirement or similar benefits to our directors, members of our senior management and non-employee directors.
The following information on Directors’ remuneration has been prepared in accordance with disclosure requirements for the company as a “quoted company” under the Companies Act.
Compensation of Directors
The table below details compensation paid or payable to our directors during the financial year ended June 30, 2020, and in the case of Messrs. Cotterell and Thurston, our executive directors, reflects the compensation paid for services as members of our senior management.
£000s |
Salary and fees |
Benefits(1)
|
Pension |
Bonus(2)
|
Multi-year variable(3),(4),(5)
|
Total |
Total fixed comp |
Total variable compensation |
|||||||||
Executive Directors |
|||||||||||||||||
John Cotterell |
2020 |
350 |
13 |
53 |
331 |
1,997 |
2,744 |
416 |
2,328 |
||||||||
Mark Thurston |
2020 |
225 |
10 |
18 |
147 |
3,147 |
3,547 |
253 |
3,294 |
||||||||
Non-Executive Directors |
|||||||||||||||||
Trevor Smith |
2020 |
60 |
— |
— |
— |
172 |
232 |
60 |
172 |
||||||||
Andrew Allan |
2020 |
55 |
— |
— |
— |
172 |
227 |
55 |
172 |
||||||||
Ben Druskin6
|
2020 |
56 |
— |
— |
— |
172 |
228 |
56 |
172 |
||||||||
Mike Kinton |
2020 |
55 |
— |
— |
— |
172 |
227 |
55 |
172 |
||||||||
David Pattillo6
|
2020 |
61 |
— |
— |
— |
172 |
233 |
61 |
172 |
||||||||
Sulina Connal |
2020 |
42 |
— |
— |
— |
127 |
169 |
42 |
127 |
||||||||
(1) Messrs. Cotterell and Thurston receive a car allowance of £10,000 and £7,500 respectively, and also receive medical insurance,
life assurance and income protection.
(2) Messrs. Cotterell and Thurston received the maximum bonus for the fiscal year ended June 30, 2020 in line with the remuneration policy of £300,000 and £140,000 respectively. The additional bonus amount paid and reflected in the table above is in relation to the one-off special Employee Benefit Trust cash bonus paid to all eligible employees. See “-2020 annual bonus earned” for additional information.
(3) For Mark Thurston and the Non-Executive Directors, the value of LTIP awards vesting based on performance up to June 30, 2020. Performance conditions were satisfied in full. For the purpose of this table, awards have been valued using a three-month average share price up to June 30, 2020 of £35.80.
(4) For the Executive Directors, including the value of EIP awards granted on July 31, 2019, of which 100% qualifies for vesting based on performance up to June 30, 2020. These awards will vest in four equal tranches as described below. For the purpose of this table, awards have been valued using a three-month average share price up to June 30, 2020 of £35.80.
(5) For the Non-Executive Directors, including the value of RSU awards granted on January 30, 2020. For the purpose of this table, awards have been valued using the share price at grant of £35.57.
(6) For the two Non-Executive Directors based in the US, annual fees for 2020 have been converted to GBP using an exchange rate of 1:1.2606, being the average exchange rate over the 2020 financial year.
78
Non-Executive Director Service Agreements
We engage independent directors using standard terms as set out in our template letter of appointment. Independent directors are engaged from the commencement date of the letter of appointment for an initial term, until the conclusion of our next annual general meeting. Under the service agreements, Messrs. Allan and Kinton are entitled to receive an annual fee of £55,000, Mr. Smith is entitled to receive an annual fee of £60,000, Mr. Druskin is entitled to receive an annual fee of $70,000, and Mr. Pattillo is entitled to receive an annual fee of $77,000, in each case inclusive of fees payable for all duties. Our independent directors are generally entitled to receive restricted share units for each term of their engagement, at the remuneration committee’s sole discretion. Following termination of their appointment, independent directors are subject to a six-month non-competition restrictive covenant, a 12-month non-poach restrictive covenant and a 12-month non‑solicitation restrictive covenant and are not eligible to receive benefits upon termination.
Compensation of Executive Officers
For the fiscal year ended June 30, 2020, the aggregate compensation granted, accrued or paid to our non-director, executive officers for services in all capacities was £3.4 million. We do not set aside or accrue amounts to provide pension, retirement or similar benefits to members of our board of directors or executive officers.
Executive Service Agreements
We engage executive officers using standard terms as set out in our executive service agreement. This agreement entitles the executive officer to receive an annual base salary, which is inclusive of any director’s fees payable to the executive officer. This agreement also entitles the executive officer to participate in a bonus scheme, the amount of any such bonus to be determined at the remuneration committee’s sole discretion. This agreement also entitles the executive officer to participate in our equity incentive plans, the amount of such equity participation and any associated performance targets to be determined at the remuneration committee’s sole discretion. We also contribute a certain percentage of the executive officer’s basic salary to a group personal pension scheme. The executive officer is entitled to a number of additional benefits, including death in service life insurance, private health insurance, permanent health insurance and a car allowance.
This agreement may be terminated by either party giving the other either six to 12 months’ notice in writing. We reserve the right to place the executive officer on garden leave at any time after notice has been given by either party, and to pay in lieu of notice. We may terminate the agreement without notice or payment in lieu of notice in certain circumstances as a result of the executive officer’s behavior or conduct, including for example, repeated breach of the service agreement after warning from us, dishonesty, gross misconduct or willful neglect in the discharge of their duties under the service agreement. On termination of this agreement, the executive officer is required to resign from our board of directors.
This agreement contains standard intellectual property and confidentiality provisions, which survive termination. This agreement also contains a power of attorney by which the executive officer appoints each of our directors as attorney with authority to execute documents in relation to the assignment of intellectual property rights, and execute documents to make the executive officer’s resignation from our board of directors effective.
This agreement contains a six-month non-competition restrictive covenant, a 12-month non-poach restrictive covenant and a 12-month non-solicitation restrictive covenant, which may be reduced by any time spent on garden leave.
2020 Annual Bonus
Annual bonuses for 2020 were subject to single performance measure with a revenue underpin, as described below. No bonus is payable unless a threshold level of performance was achieved, and furthermore no bonus was payable unless the Company achieved a threshold level of revenue of £350m. Payout levels are measured on a straight-line basis based on the outcome for Adjusted PBT between threshold and maximum.
79
Threshold |
Maximum |
Actual |
|||||
Adjusted PBT for FY2020 |
(£ in millions) |
£59.5 |
£66.0 |
£68.6 |
|||
Payout |
% of max |
50 |
% |
100 |
% |
100 |
% |
Both the revenue target and maximum PBT target were exceeded during the year, accordingly 100% of the bonus was payable (£300,000 and £140,000 to John Cotterell and Mark Thurston respectively).
For the fiscal year ended June 30, 2020, the aggregate amounts expected to be paid at the end of September 2020 to our non-director, executive officers under the Executive Bonus scheme is £0.4 million.
Outstanding Equity Awards, Grants and Option Exercises
Performance Share Units
Awards of Performance Share Units (PSUs) were made under the EIP to the Executive Directors on July 31, 2019, which were subject to a performance measure as described below. If the performance condition is satisfied, awards vest in four equal tranches commencing October 31, 2020 and each year for three years thereafter.
Participant |
Number of awards |
Share price on date of grant(1)
|
Face value(2)
|
Date of grant |
Date of vesting |
|
John Cotterell |
55,788 |
£29.47 |
£1,644,072 |
July 31, 2019 |
Oct 31, 2020 to Oct 31, 2023 |
|
Mark Thurston |
27,894 |
£29.47 |
£822,036 |
July 31, 2019 |
Oct 31, 2020 to Oct 31, 2023 |
|
(1) Based on the share price of $35.85 converted to GBP on the date of grant.
(2) Based on the share price of $35.85 converted to GBP on the date of grant and multiplied by the number of shares under award.
Although eligible to participate, the Executive Directors did not elect to re-enroll in the Company’s Sharesave plan when it was relaunched in 2019.
PSU awards made on July 31, 2019 under the EIP were subject to a single performance measure with a revenue underpin measured over the 2020 financial year, as described below. No awards would vest unless a threshold level of PBT performance was achieved, and furthermore no awards would vest unless the Company achieved a threshold level of revenue of £350m. Vesting is measured on a straight-line basis between threshold and maximum.
Threshold |
Maximum |
Actual |
|||||
Adjusted PBT for FY2020 |
£m |
£60 |
£66 |
£69 |
|||
Payout |
% of max |
50 |
% |
100 |
% |
100 |
% |
Both the revenue threshold and maximum PBT target were achieved during the year, and accordingly 100% of these awards will vest. The first tranche of the PSU awards will vest on October 31, 2020, with the remaining three tranches vesting on the October 31 in the three following years.
The third tranche of LTIP awards made to Mark Thurston (relating to previously banked awards under the LTIP), accounting for 40% of the total award, vested on July 27, 2020. The remaining award relating to FY2020 performance will vest in early September. The outstanding award for the Non-Executive Directors under the Company’s legacy LTIP granted in August 2017 vested on August 16, 2020.
Restricted Share Units
Awards of Restricted Share Units (RSUs) were made under the EIP to the Non-Executive Directors on January 30, 2020. Awards vest subject to the participant remaining in service to the Company for the duration of the Appointment
80
Period, which is the period of time from the participant’s appointment at the Company’s Annual General Meeting of Shareholders (“AGM”) to the next AGM the following year.
Participant |
Number of awards |
Share price on date of grant(1)
|
Face value(2)
|
Date of grant |
Date of vesting(3)
|
|
Trevor Smith |
3,563 |
£35.57 |
£126,736 |
January 30, 2020 |
December 7, 2020 |
|
Andrew Allan |
3,563 |
£35.57 |
£126,736 |
January 30, 2020 |
December 7, 2020 |
|
Ben Druskin |
3,563 |
£35.57 |
£126,736 |
January 30, 2020 |
December 7, 2020 |
|
Mike Kinton |
3,563 |
£35.57 |
£126,736 |
January 30, 2020 |
December 7, 2020 |
|
David Pattillo |
3,563 |
£35.57 |
£126,736 |
January 30, 2020 |
December 7, 2020 |
|
Sulina Connal |
3,563 |
£35.57 |
£126,736 |
January 30, 2020 |
December 7, 2020 |
|
(1) Based on the share price of $46.30 converted to GBP on the date of grant.
(2) Based on the share price of $46.30 converted to GBP on the date of grant and multiplied by the number of shares under award.
(3) Awards vest on October 31, 2020 or, if later, the date of the 2020 AGM (actual date to be confirmed), and will therefore vest (provisionally) on December 7, 2020.
Executive Directors’ Share Awards Outstanding at the 2020 Financial Year End
Award type |
Held at June 30, 2019 |
Granted in year |
Lapsed in year |
Exercised in year |
Held at June 30, 2020 |
Date of grant |
Exercise price |
Market price on exercise date(1)
|
Date from which exercisable |
Date of expiry |
|||||||
John Cotterell |
|||||||||||||||||
2018 EIP PSU(2)
|
90,000 |
— |
— |
22,500 |
67,500 |
July 26, 2018 |
— |
£32.47 |
(3) |
July 26, 2028 |
|||||||
2019 EIP PSU(4)
|
— |
55,788 |
— |
— |
55,788 |
July 31, 2019 |
— |
— |
(5) |
July 31, 2029 |
|||||||
Mark Thurston |
|||||||||||||||||
LTIP |
100,000 |
— |
— |
40,000 |
60,000 |
July 24, 2015 |
— |
£30.54 & £31.20 |
(6) |
July 26, 2025 |
|||||||
EIP PSU(2)
|
45,000 |
— |
— |
11,250 |
33,750 |
July 26, 2018 |
— |
£32.47 |
(3) |
July 26, 2028 |
|||||||
EIP PSU(4)
|
— |
27,894 |
— |
— |
27,894 |
July 31, 2019 |
— |
— |
(5) |
July 31, 2029 |
|||||||
2018 Sharesave |
377 |
— |
— |
— |
377 |
October 23, 2018 |
£25.87 |
— |
December 1, 2021 |
June 1, 2021 |
|||||||
(1) Converted to GBP using the prevailing exchange rate on the date of exercise.
(2) These awards were subject to a PBT performance condition over the 2019 financial year. The performance condition was met
in full and as such 100% of this award vested.
(3) Awards vest in four equal tranches from October 31, 2019 to October 31, 2022.
(4) These awards were subject to a PBT performance condition over the 2020 financial year as described above. The performance
condition was met in full and as such 100% of this award will be eligible to vest.
(5) Awards vest in four equal tranches from October 31, 2020 to October 31, 2023.
81
(6) 40% of these LTIP awards were based on PBT performance up to the 2019 financial year. Performance criteria were met in full, and accordingly these awards were exercised in July 2020. The final tranche of these awards will vest in full in November based on performance during the 2020 financial year.
Directors’ Current Shareholdings and Interests in Shares
The table below provides details on the Directors' current shareholdings as well as their interests in outstanding share awards as of June 30, 2020.
Unconditionally-owned shares |
Interests in share schemes |
Percentage of salary applicable to share ownership requirement(1)
|
||||||||||
EIP |
LTIP |
SAYE |
Total |
|||||||||
Executive Directors |
||||||||||||
John Cotterell |
9,672,797(2),(3)
|
123,288 |
— |
— |
123,288 |
109,041 |
% |
|||||
Mark Thurston |
19,716 |
61,644 |
60,000(4)
|
377 |
122,021 |
912 |
% |
|||||
Non-Executive Directors |
||||||||||||
Trevor Smith |
65,873 |
3,563 |
1,250(5)
|
— |
4,813 |
— |
||||||
Andrew Allan |
463,950(6)
|
11,063 |
3,750 |
— |
14,813 |
— |
||||||
Ben Druskin |
36,875 |
3,563 |
3,125 |
— |
6,688 |
— |
||||||
Mike Kinton |
1,780,293 |
3,563 |
1,250(5)
|
— |
4,813 |
— |
||||||
David Pattillo |
21,375 |
3,563 |
3,125 |
— |
6,688 |
— |
||||||
Sulina Connal |
— |
3,563 |
— |
— |
3,563 |
— |
||||||
(1) This value includes all unconditionally-owned shares, plus the value of outstanding tranches of prior EIP awards that are subject to service conditions only (on a net of tax basis), valued using the share price at the year end of £39.19. Executive Directors are required to build and maintain a shareholding to the value of 200% of salary within five years of appointment. There is no formal policy or guideline regarding Non-Executive Director shareholdings.
(2) Of which 2,000,000 shares are held in trust.
(3) 151,885 Class A ordinary shares were subsequently sold between July 1, 2020 and September 10, 2020.
(4) 40,000 LTIP awards were subsequently exercised on July 27, 2020.
(5) 1,250 LTIP awards were subsequently exercised on August 17, 2020.
(6) Of which, 101,250 shares are held by Mr Allan's spouse, Elaine Allan.
Equity Compensation Arrangements
We have granted options and equity incentive awards under our (1) Endava Share Option Plan, or the Share Option Plan, (2) Joint Share Ownership Plan, or the JSOP, (3) 2015 Long Term Incentive Plan, or the 2015 Plan, (4) Non-Executive Director Long Term Incentive Plan, or the Non-Executive Director Plan, (5) the 2018 Equity Incentive Plan, or the 2018 Plan, (6) the 2018 Non-Employee Sub Plan, the 2018 Sub Plan, (7) the 2018 Sharesave Plan, the Sharesave Plan and (8) 2018 International Sub-Plan, or International Sharesave Plan. We refer to the Share Option Plan, the JSOP, the 2015 Plan, the Non-Executive Director Plan, the 2018 Plan, the 2018 Sub Plan, the Sharesave Plan and International Sharesave Plan together as the Plans. As of June 30, 2020, there were 2,950,068 Class A ordinary shares available for issuance under the Plans, 551,723 of which are held by the EBT. During the year ended June 30, 2020, the EBT sold 980,000 Class A ordinary shares and used the net proceeds to fund a discretionary bonus to our employees.
Share Option Plan
On May 7, 2014, our board of directors adopted the Share Option Plan and, as a schedule to the Share Option Plan, the Endava Approved Share Option Plan, which is intended to qualify as a “company share option plan” that meets the
82
requirements of Schedule 4 to the Income Tax (Earnings and Pensions) Act 2003, or the CSOP. Options granted under the Share Option Plan have no tax advantages. Options granted under the CSOP are potentially U.K. tax-favored options up to an individual limit of £30,000 calculated by reference to the market value of the shares under option at the date of grant. All of our employees may participate in the Share Option Plan at the discretion of the board of directors. Employees who meet the CSOP legislative requirements may participate in the Share Option Plan at the discretion of the board of directors.
Options granted under the Share Option Plan may have any exercise price, provided that where the exercise of an option is to be satisfied by newly issued shares, the exercise price shall not be less than the nominal value of a share. Options granted under the CSOP must have an exercise price equal to the market value of a share on the date of grant. Options may be granted by the board of directors at any time up to the tenth anniversary of the date of adoption of the Share Option Plan and may not be transferred other than on death to the option holder’s personal representative.
The Share Option Plan replaced the Endava Limited Enterprise Management Incentives Plan, under which we previously granted share option awards to our employees. Following the adoption of the Share Option Plan, we no longer grant awards under the Endava Limited Enterprise Management Incentives Plan.
Awards
Options are exercisable in whole or in part at the times and subject to the vesting schedule set forth in the option agreement.
If a participant dies, a personal representative of the participant may exercise any option granted by the company to the participant to the extent set out in the option agreement for a period of twelve months from the date of death, after which the option shall lapse. If a participant ceases employment with the company due to ill health, injury, disability, retirement, the sale of the participant’s employer company or undertaking out of the company, the participant may exercise any option granted by the company to the extent set out in the option agreement for a period of three months, after which the option shall lapse.
In the event of any increase or variation of the company’s share capital or a rights issue, the board of directors may adjust the number of shares subject to an option and/or the exercise price.
Corporate Transactions
For options granted under the Share Option Plan, if any person obtains control of the company as a result of making a general offer for the whole of the issued ordinary share capital of the company, options may be exercised within 30 days, or such earlier date as the board of directors shall determine, of the change of control or, at the sole discretion of the board of directors, during any period specified by the board of directors ending before the change of control. Alternatively, and with the agreement of the option holder, options may be exchanged for options to acquire shares in the acquiring company.
For options granted under the CSOP, if a person obtains control of the company and in consequence the shares no longer meet the legislative CSOP requirements, options may be exercised no later than 20 days after the change of control. Alternatively, the board of directors may permit the option holders to exercise their options within the period of 20 days prior to the change of control. Alternatively, and with the agreement of the option holder, options may be exchanged for CSOP options over shares in the acquiring company.
If the board of directors considers that a listing of the shares on a stock exchange is likely to occur, the board of directors shall have discretion to permit options to be exercised and to waive any exercise conditions. The board of directors may also require that options may not be exercised until the end of any lock up period or require that some or all of the shares acquired on exercise of these options may not be transferred until the end of any lock up period. Alternatively, the board of directors may require options to continue following a listing of the shares, and the board of directors would have discretion to waive any remaining exercise conditions.
83
Amendment
The board of directors may amend the Share Option Plan save that no amendment shall take effect that would materially affect the liability of any option holder or which would materially affect the value of his subsisting option without the prior written consent of the option holder. Subject to restrictions in the CSOP legislation, the board of directors may similarly amend the CSOP.
Joint Share Ownership Plan (“the JSOP”)
On June 28, 2011, our board of directors adopted the JSOP. Under the JSOP, our executive directors and employees have the ability to acquire shares jointly with the trustees of the EBT, which operates in conjunction with the JSOP. The beneficiaries of the EBT are our employees, including former employees, and executive directors. The trustee of the EBT is Equiom (Guernsey) Limited, or the Trustee, which is an independent trustee. Awards under the JSOP are documented in individual JSOP agreements executed as deeds by the relevant participant, the Trustee and the company.
Awards
Participants in the JSOP hold a restricted beneficial interest in a specified number of shares, or the JSOP Shares. A participant has the right to the future increase in value of those JSOP Shares above an agreed threshold amount. The Trustee is the legal owner of the JSOP Shares. The Trustee and the participant hold their beneficial interests in the JSOP Shares in specified proportions.
Neither the Trustee nor the participant can transfer their interest in the JSOP Shares without the consent of the other. The JSOP Shares can only be transferred or disposed of or dealt with in accordance with the terms of the JSOP agreement.
The JSOP Shares shall include any other shares or securities that may be acquired in addition to, or in place of, such shares as a result of any variation in the share capital of the company, other than as a result of a rights issue. In the event of a rights issue in respect of the JSOP Shares, the Trustee shall notify the participant and they may agree between themselves in writing that the Trustee shall contribute funds (some or all of which may come from the participant) sufficient to take up the rights and the shares received shall not form part of the JSOP Shares, but shall be held by the Trustee for the Trustee and the participant in proportion to the funds contributed by the Trustee and the participant to fund the take up of the rights. In the absence of such agreement, the Trustee shall sell sufficient of the rights (nil paid) to fund the exercise of the balance of the rights.
The participant and the Trustee may agree between themselves how to exercise votes attaching to the JSOP Shares.
Dividends on JSOP Shares are paid and belong to the Trustee unless the Trustee agrees with the company to waive such dividends.
Corporate Transactions
Certain events terminate the joint ownership arrangement with the Trustee, including (a) a sale of the company; (b) following a listing on a recognized stock exchange, such as our initial public offering, when the participant gives a specific notice to the Trustee and the company in respect of the JSOP Shares; (c) the expiry of 25 years from the date of the applicable trust deed; and (d) the participant leaving employment with the company when the market value of the JSOP Shares is less than the threshold amount. We refer to these events as “Trigger Events.”
On the date of a Trigger Event, the Trustee has an option to acquire the beneficial interest belonging to the participant. If the Trustee exercises this option, the Trustee will then either transfer shares of a value equal or pay cash to the participant in an amount equal to the value of the option, calculated according to the terms of the JSOP. On and from the date of any Trigger Event, and if and for so long as the Trustee has not exercised the option referred to above, the Trustee will use reasonable endeavors to sell the JSOP Shares and distribute the net proceeds of sale between the Trustee and the participant in the proportions calculated according to the terms of the JSOP.
84
Amendment
The board of directors, with the consent of the Trustee, may make certain amendments to the JSOP agreement that it considers necessary or appropriate to benefit the administration of the JSOP, to take account of a change in legislation or regulatory law or relevant accounting practice or principles or to obtain or maintain favorable tax, exchange control or regulatory treatment for the participant, the Trustee or any member of the company.
No alteration may be made that would materially increase the liability of the participant, the Trustee or the company or materially increase or decrease the value of the JSOP Shares, without the approval of the person concerned.
2015 Long Term Incentive Plan (“the 2015 Plan”)
On June 30, 2015, our board of directors adopted the 2015 Plan. Awards under the 2015 Plan may be in the form of a conditional right to acquire shares at no cost to the participant, or a Conditional Share Award, or an option to acquire shares with an exercise price which may be zero.
The aggregate number of shares over which 2015 Plan awards can be made is limited to such amounts as agreed by shareholders from time to time. The aggregate number of shares approved by shareholders as at the date of adoption of the 2015 Plan was 1,000,000.
Employees of the company may participate in the 2015 Plan at the discretion of the board of directors. 2015 Plan awards may be granted by the board of directors up to the tenth anniversary of adoption of the 2015 Plan or until the date of a listing of the shares and are not capable of transfer other than on death to the employee’s personal representative.
Awards
Awards under the 2015 Plan are expressed to “bank” (meaning a 2015 Plan award has become eligible to “vest”). “Vest” means an option can be exercised or, for a Conditional Share Award, shares will be transferred. Vesting occurs on or after an “Exit Event,” which includes a sale of all of the shares or all or substantially all of the assets of the company or a listing of the shares on a stock exchange, such as our initial public offering. The board of directors also has power to declare that an Exit Event has occurred such that all of a banked 2015 Plan award, or such proportion as the board of directors shall determine, may vest immediately or on a specified future date, subject to such further conditions as the board of directors may require which may include that an option may lapse if not exercised within a specified period.
Unless otherwise specified by the board of directors at the date 2015 Plan awards are made, 2015 Plan awards bank in five equal tranches based on the satisfaction of performance targets for each financial year, including threshold and target achievement levels.
Between threshold and target achievement levels, the proportion of a tranche that banks is calculated on a straight line basis, with fractional shares rounded down to the nearest whole number. The date of banking is the date the board of directors determines the level of achievement of the applicable performance targets, and the board of directors determines threshold and target achievement levels each year.
The board of directors, in its absolute discretion, may determine that all unbanked 2015 Plan awards bank in full or in part immediately or on a specified future date, subject to such further conditions as the board of directors shall reasonably require.
Upon a variation in the share capital of the company, the number and description of shares subject to 2015 Plan awards and any award/exercise price will be adjusted proportionately.
If the holder of a 2015 Plan award ceases employment with the company, no further banking of his 2015 Plan award will occur and the award will lapse, except that upon death or where the individual is a “Good Leaver,” only his unbanked 2015 Plan award would lapse, and his banked awards would vest and be exercisable during the period of six months after the date of cessation of employment or six months after the date of leaving (if later), or during the period of 12 months on death. “Good Leaver” is defined to include cessation of employment by reason of injury, ill health,
85
disability, retirement, his employing company or undertaking being sold out of the company or cessation of employment in any other circumstances if the board of directors so decides.
Corporate Transactions
Where the Exit Event is a sale of the company, the board of directors may at its discretion determine that all or a proportion of unbanked 2015 Plan awards will bank. Banked 2015 Plan awards will vest on the date of the change of control and the board of directors may impose a condition that any proceeds of disposal of the shares shall be subject to deferral on such terms as are intended to be consistent with the vesting schedule specified in the 2015 Plan award certificate. An option that vests in these circumstances may be exercised within 30 days of the change of control or such longer period as determined by the board of directors and shall lapse at the end of such period unless the board of directors determines otherwise.
The board of directors has power to net settle 2015 Plan awards and 2015 Plan awards may be exchanged for equivalent awards over shares in an acquiring company.
Amendment
The board of directors has power to amend the 2015 Plan, including to adopt sub-plans for the benefit of employees located outside the United Kingdom. Without the prior approval of the company at a general meeting, an amendment may not be made for the benefit of existing or future 2015 Plan award holders relating to the limit on the aggregate number of shares over which 2015 Plan awards may be made or to the 2015 Plan provision regarding amendments.
Non-Executive Director Long Term Incentive Plan (“Non-Executive Director Plan”)
On June 21, 2017, our board of directors adopted the Non-Executive Director Plan. The aggregate number of shares over which Non-Executive Director Plan awards can be made is limited to such amounts as agreed by shareholders from time to time.
The Non-Executive Director Plan is similar to the 2015 Plan described above, except that only non-executive directors of the company may participate, and references to employment are replaced with references to continuous service as a non-executive director of the company.
Awards
Unless otherwise specified by the board of directors at the date Non-Executive Director Plan awards are made, the Non-Executive Director Plan award certificate will provide that Non-Executive Director Plan awards will bank in three equal tranches based on continuous service on the anniversaries of the date of award. Unless otherwise specified by the board of directors at the date the Non-Executive Director Plan awards are made, Non-Executive Director Plan awards will vest as follows:
Date |
Level of vesting |
||
Date of Exit Event |
Banked award x 50% |
(A) |
|
1st anniversary of Exit Event
|
(Cumulative banked awards x 100%) – A |
(B) |
|
If the first anniversary of the Exit Event occurs prior to the date the Non-Executive Director Plan award will become banked, the Non-Executive Director Plan award will continue to bank in accordance with the Non-Executive Director Plan rules, and banked Non-Executive Director Plan awards not previously vested will vest on the date of banking. Cumulative banked Non-Executive Director Plan awards will take account of all Non-Executive Director Plan awards banked on or before the relevant vesting date.
2018 Equity Incentive Plan (“the 2018 Plan”)
The 2018 Plan was adopted by our board of directors on April 16, 2018 and approved by our shareholders on May 3, 2018. The 2018 Plan allows for the grant of equity-based incentive awards to our employees, including employees who also serve as our directors. The material terms of the 2018 Plan are summarized below:
86
Eligibility and Administration
Our employees and directors, who are also our employees, and employees and consultants of our subsidiaries, referred to as service providers are eligible to receive awards under the 2018 Plan. The 2018 Plan is administered by our board of directors, which may delegate its duties and responsibilities to one or more committees of our directors and/or officers (referred to as the plan administrator below), subject to certain limitations imposed under the 2018 Plan, and other applicable laws and stock exchange rules. The plan administrator has the authority to take all actions and make all determinations under the 2018 Plan, to interpret the 2018 Plan and award agreements and to adopt, amend and repeal rules for the administration of the 2018 Plan as it deems advisable. The plan administrator also has the authority to determine which eligible service providers receive awards, grant awards, set the terms and conditions of all awards under the 2018 Plan, including any vesting and vesting acceleration provisions, subject to the conditions and limitations in the 2018 Plan.
Shares Available for Awards
The maximum number of Class A ordinary shares that may be issued under our 2018 Plan as of June 30, 2020 is 6,119,080 which includes Class A ordinary shares reserved for issuance under our 2018 Non-Employee Sub-Plan described below. No more than 16,050,000 Class A ordinary shares may be issued under the 2018 Plan upon the exercise of incentive share options. In addition, the number of Class A ordinary shares reserved for issuance under our 2018 Plan will automatically increase on January 1 of each year, commencing on January 1, 2019 and ending on (and including) January 1, 2028, in an amount equal to 2% of the total number of shares outstanding on December 31 of the preceding calendar year. Our board may act prior to January 1 of a given year to provide that there will be no increase for such year or that the increase for such year will be a lesser number of Class A ordinary shares. Class A ordinary shares issued under the 2018 Plan may be authorized but unissued shares, shares purchased on the open market or treasury shares.
If an award under the 2018 Plan, including the 2018 Non-Employee Sub-Plan, expires, lapses or is terminated, exchanged for cash, surrendered, repurchased, canceled without having been fully exercised or forfeited, any unused shares subject to the award will, as applicable, become or again be available for new grants under the 2018 Plan. Awards granted under the 2018 Plan in substitution for any options or other equity or equity-based awards granted by an entity before the entity’s merger or consolidation with us or our acquisition of the entity’s property or stock will not reduce the number of Class A ordinary shares available for grant under the 2018 Plan, but will count against the maximum number of Class A ordinary shares that may be issued upon the exercise of incentive options.
Awards
The 2018 Plan provides for the grant of options, share appreciation rights, or SARs, restricted shares, restricted share units, or RSUs, performance restricted share units, or PSUs, and other share-based awards. All awards under the 2018 Plan will be set forth in award agreements, which will detail the terms and conditions of awards, including any applicable vesting and payment terms, change of control provisions and post-termination exercise limitations. A brief description of each award type follows.
Options and SARs. Options provide for the purchase of our Class A ordinary shares in the future at an exercise price set on the grant date. SARs entitle their holder, upon exercise, to receive from us an amount equal to the appreciation of the shares subject to the award between the grant date and the exercise date. The plan administrator will determine the number of shares covered by each option and SAR, the exercise price of each option and SAR and the conditions and limitations applicable to the exercise of each option and SAR.
Restricted Shares, RSUs and PSUs. Restricted shares are an award of nontransferable Class A ordinary shares that remain forfeitable unless and until specified conditions are met and which may be subject to a purchase price. RSUs and PSUs are contractual promises to deliver our Class A ordinary shares in the future, which may also remain forfeitable unless and until specified conditions are met. The plan administrator may provide that the delivery of the shares underlying RSUs will be deferred on a mandatory basis or at the election of the participant. The terms and conditions applicable to restricted shares, RSUs and PSUs will be determined by the plan administrator, subject to the conditions and limitations contained in the 2018 Plan.
87
Other Share-Based Awards. Other share-based awards are awards of fully vested Class A ordinary shares and other awards valued wholly or partially by referring to, or otherwise based on, our Class A ordinary shares or other property. Other share-based awards may be granted to participants and may also be available as a payment form in the settlement of other awards, as standalone payments and as payment in lieu of compensation to which a participant is otherwise entitled. The plan administrator will determine the terms and conditions of other share-based awards, which may include any purchase price, performance goal, transfer restrictions and vesting conditions.
Performance Criteria
The plan administrator may select performance criteria for an award to establish performance goals for a performance period.
Certain Transactions
In connection with certain corporate transactions and events affecting our ordinary shares, including a change of control, another similar corporate transaction or event, another unusual or nonrecurring transaction or event affecting us or our financial statements or a change in any applicable laws or accounting principles, the plan administrator has broad discretion to take action under the 2018 Plan to prevent the dilution or enlargement of intended benefits, facilitate the transaction or event or give effect to the change in applicable laws or accounting principles. This includes canceling awards for cash or property, accelerating the vesting of awards, providing for the assumption or substitution of awards by a successor entity, adjusting the number and type of shares subject to outstanding awards and/or with respect to which awards may be granted under the 2018 Plan and replacing or terminating awards under the 2018 Plan. In addition, in the event of certain non-reciprocal transactions with our shareholders, the plan administrator will make equitable adjustments to the 2018 Plan and outstanding awards as it deems appropriate to reflect the transaction.
In the event of a change of control where the successor or acquirer entity does not agree to assume, continue or rollover the awards, the awards will vest in full effective immediately prior to the change of control. Additionally, where a successor or survivor corporation, or a parent or subsidiary, assumes the awards or substitutes them for awards covering their equity securities, with appropriate adjustments, as determined by the plan administrator, and a participant is terminated without cause by us (or our successor or applicable subsidiary thereof) on or within 12 months following the effective date of the change of control, such participant’s awards will immediately vest effective on the date of their termination.
Plan Amendment and Termination
Our board of directors may amend or terminate the 2018 Plan at any time; however, no amendment, other than an amendment that increases the number of shares available under the 2018 Plan, may materially and adversely affect an award outstanding under the 2018 Plan without the consent of the affected participant and shareholder approval will be obtained for any amendment to the extent necessary to comply with applicable laws. Further, the plan administrator cannot, without the approval of our shareholders, amend any outstanding option or SAR to reduce its price per share or cancel any outstanding option or SAR in exchange for cash or another award under the 2018 Plan with an exercise price per share that is less than the exercise price per share of the original option or SAR. The 2018 Plan will remain in effect until the tenth anniversary of its effective date unless earlier terminated by our board of directors. No awards may be granted under the 2018 Plan after its termination.
Transferability and Participant Payments
Except as the plan administrator may determine or provide in an award agreement, awards under the 2018 Plan are generally non-transferrable, except by will or the laws of descent and distribution, or, subject to the plan administrator’s consent, pursuant to a domestic relations order, and are generally exercisable only by the participant. With regard to tax withholding obligations arising in connection with awards under the 2018 Plan, and exercise price obligations arising in connection with the exercise of options under the 2018 Plan, the plan administrator may, in its discretion, accept cash, wire transfer or cheque, our ordinary shares that meet specified conditions, a promissory note, a “market sell order,” such other consideration as the plan administrator deems suitable or any combination of the foregoing.
88
Non-U.S. Participants
The plan administrator may modify awards granted to participants who are non-U.S. nationals or employed outside the United States or establish sub-plans or procedures to address differences in laws, rules, regulations or customs of such foreign jurisdictions with respect to tax, securities, currency, employee benefit or other matters.
2018 Non-Employee Sub Plan
The 2018 Non-Employee Sub Plan was adopted by our board of directors on April 16, 2018 and approved by our shareholders on May 3, 2018. The 2018 Non-Employee Sub Plan governs equity awards granted to our non-employee directors, consultants, advisers and other non-employee service providers. The 2018 Non-Employee Sub Plan was adopted under the 2018 Plan and provides for awards to be made on identical terms to awards made under our 2018 Plan.
2018 Sharesave Plan (“the Sharesave Plan”)
The Sharesave Plan was adopted by our board of directors on April 16, 2018 and approved by our shareholders on May 3, 2018. The Sharesave Plan is a U.K. tax advantaged share option plan and is intended to comply with the requirements of Schedule 3 to the Income Tax (Earnings and Pensions) Act 2003, or Schedule 3. The Sharesave Plan may be extended to award similar benefits to employees outside the U.K. The material terms of the Sharesave Plan are summarized below:
Shares available for options
The maximum number of Class A ordinary shares that may be issued under our Sharesave Plan as of June 30, 2020 is 4,061,837 Class A ordinary shares, which includes Class A ordinary shares reserved for issuance under any overseas plan described below. In addition, the number of Class A ordinary shares reserved for issuance under our Sharesave Plan will automatically increase on January 1 of each year, commencing on January 1, 2019 and ending on (and including) January 1, 2028, in an amount equal to 2% of the total number of shares outstanding on December 31 of the preceding calendar year. Our board of directors may act prior to January 1 of a given year to provide that there will be no increase for such year or that the increase for such year will be a lesser number of Class A ordinary shares.
Eligibility and participation
The Sharesave Plan provides that our employees and full-time directors who are U.K. resident taxpayers are eligible to participate. The board of directors may at its discretion extend participation under the Sharesave Plan to other employees and directors who do not meet these requirements. The Sharesave Plan provides that the board may require employees to have completed a qualifying period of employment (of up to five years) before they may apply for the grant of an option to purchase Class A ordinary shares.
Participation in the Sharesave Plan requires employees to agree to make regular monthly contributions to an approved savings contract of three or five years (or such other period permitted by the governing legislation). Subject to the following limits, the board of directors will determine the maximum amount that an employee may contribute under a savings contract linked to options to purchase Class A ordinary shares granted under the Sharesave Plan. Monthly savings by an employee under the Sharesave Plan and all savings contracts linked to options granted under any Schedule 3 tax-advantaged scheme may not exceed the statutory maximum (currently £500 per month in aggregate).The number of Class A ordinary shares over which an option is granted will be such that the total option price payable for these shares will normally correspond to the proceeds on maturity of the related savings contract.
No options to purchase Class A ordinary shares may be granted under the Sharesave Plan more than 10 years after the Sharesave Plan has been approved by shareholders.
The option price per Class A ordinary share under the Sharesave Plan will be the market value of a Class A ordinary share when options to purchase Class A ordinary shares are granted under the Sharesave Plan less a discount of up to 20%, or such other maximum discount permitted under the governing legislation.
89
Exercise and lapse of options
Options granted under the Sharesave Plan will normally be exercisable for a six-month period from the end of the relevant three or five year savings contract. Any options not exercised within the relevant exercise period will lapse.
An option may be exercised before the end of the relevant savings period, for a limited period, on the death of a participant or on his or her ceasing to hold office or employment with Endava by reason of injury, disability, redundancy, retirement, the sale or transfer out of the group of his or her employing company or business, their employer ceasing to be an associated company or for any other reason (provided in such case the option was granted more than three years previously).
Options are not assignable or transferable.
Certain transactions
Rights to exercise options early for a limited period also arise if another company acquires control of Endava as a result of a takeover or upon a scheme of arrangement or becomes bound or entitled to acquire shares under the compulsory acquisition provisions. An option may be exchanged for an option over shares in the acquiring company if the participant so wishes and the acquiring company agrees.
In the event of any variation in our share capital, the board of directors may make such adjustment as it considers appropriate to the number of Class A ordinary shares under option and/or the price payable on the exercise of an option.
2018 Sharesave Plan amendment
Our board of directors may, at any time, amend the provisions of the Sharesave Plan in any respect, provided that the prior approval of shareholders is obtained for any amendments that are to the material disadvantage of participants in respect of the rules governing eligibility, limits on participation, the overall limits on the issue of shares or the transfer of treasury shares, the basis for determining a participant’s entitlement to, and the terms of, the shares to be acquired and the adjustment of options.
2018 International Sub-Plan
The 2018 International Sub-Plan was adopted by our board of directors on October 24, 2018. The 2018 International Sub Plan is similar to the 2018 Sharesave Plan but modified to take account of local tax, exchange control or securities laws, regulation or practice. Class A ordinary shares made available under the 2018 International Sub Plan will count against the limit on the number of new Class A ordinary shares that may be issued under the 2018 Sharesave Plan.
Insurance and Indemnification
To the extent permitted by the Companies Act, we are empowered to indemnify our directors against any liability they incur by reason of their directorship. We maintain directors’ and officers’ insurance to insure such persons against certain liabilities and have entered into a deed of indemnity with each of our directors and executive officers.
Insofar as indemnification of liabilities arising under the Securities Act may be permitted to our board of directors, executive officers, or persons controlling us pursuant to the foregoing provisions, we have been informed that, in the opinion of the SEC, such indemnification is against public policy as expressed in the Securities Act and is therefore unenforceable.
C. Board Practices
Composition of our Board of Directors
Our board of directors currently consists of eight members. Our board of directors has determined that six of our eight directors, Andrew Allan, Sulina Connal, Ben Druskin, Mike Kinton, David Pattillo and Trevor Smith, do not have a relationship that would interfere with the exercise of independent judgment in carrying out the responsibilities of director and that each of these directors is “independent” as that term is defined under the rules of the New York Stock Exchange. There are no family relationships among any of our directors or senior management.
90
In accordance with our amended and restated articles of association, each of our directors serves for a term of one year and retires from office at every annual general meeting of shareholders. If at any such meeting the place of a retiring director is not filled, the retiring director shall, if willing to act, be deemed to have been reelected. If it is resolved not to fill such vacated office, or a motion for the re-election of such director shall have been put to the meeting and lost, the director shall not be re-elected unless this would result in the number of directors falling below the minimum number of directors required.
Committees of our Board of Directors
Our board of directors has three standing committees: an audit committee, a remuneration committee and a nomination committee.
Audit Committee
The audit committee, which consists of Messrs. Allan, Pattillo and Smith, assists the board of directors in overseeing our accounting and financial reporting processes and the audits of our financial statements. Mr. Pattillo serves as chairman of the committee. The audit committee consists exclusively of members of our board of directors who are financially literate, and Mr. Pattillo is considered an “audit committee financial expert” as defined by applicable SEC rules. Our board of directors has determined that all of the members of the audit committee satisfy the “independence” requirements set forth in Rule 10A-3 under the Exchange Act. The audit committee is governed by a charter that complies with New York Stock Exchange rules.
The audit committee’s responsibilities include:
• |
evaluating and making recommendations to the board of directors regarding the appointment, compensation, retention and oversight of any accounting firm engaged for the purpose of preparing or issuing an audit report or performing other audit services; |
• |
approving the audit services and non-audit services to be provided by our independent auditor; |
• |
evaluating the independent auditor’s qualifications, performance and independence, and presenting its conclusions to the full board of directors on at least an annual basis; |
• |
reviewing and discussing with the executive officers, the board of directors and the independent auditor our financial statements and our financial reporting process; and |
• |
approving or ratifying any related person transaction (as defined by applicable rules and regulations) in accordance with our applicable policies. |
The audit committee meets as often as one or more members of the audit committee deem necessary, but in any event meets at least four times per year. The audit committee meets at least once per year with our independent accountant, without our senior management being present.
Remuneration Committee
The remuneration committee, which consists of Messrs. Allan, Kinton and Smith, assists the board of directors in determining senior management compensation. Mr. Kinton serves as chairman of the committee. Under SEC and New York Stock Exchange rules, there are heightened independence standards for members of the remuneration committee, including a prohibition against the receipt of any compensation from us other than standard board member fees. Although foreign private issuers are not required to meet this heightened standard with respect to all members, we have determined that all members meet this heightened standard.
The remuneration committee’s responsibilities include:
• |
approving, modifying and overseeing our overall compensation strategy and policies; |
• |
reviewing and recommending to the board of directors for approval the type and amount of compensation to be paid or awarded to the members of our board of directors; |
91
• |
sole responsibility for the appointment, selection, retention, termination and oversight of any compensation consultants and other advisors retained by the remuneration committee; |
• |
reviewing, evaluating and approving all compensatory agreements and arrangements, elements of compensation, and performance goals and objectives related to compensation of our senior management, including our chief executive officer; |
• |
reviewing and approving the goals and objectives of our senior management, including our chief executive officer, and evaluating their performance in light of relevant performance goals and objectives; |
• |
having the full power and authority of our board of directors to adopt, amend, terminate and administer our equity awards, pension, and profit sharing plans, bonus plans, benefit plans and similar programs; and |
• |
reviewing and assessing risks arising from our compensation policies and practices. |
Nominating and Corporate Governance Committee
The nominating and corporate governance committee, which consists of Messrs. Allan, Kinton, Druskin and Smith, assists our board of directors in identifying individuals qualified to become members of our board of directors consistent with criteria established by our board of directors and in developing our corporate governance principles. Mr. Smith serves as chairman of the committee.
The nominating and corporate governance committee’s responsibilities include:
• |
identifying and evaluating candidates to serve on our board of directors, including nomination of incumbent directors for reelection; |
• |
reviewing and evaluating the size and composition of our board of directors; |
• |
recommending nominees for election to our board of directors and its corresponding committees; |
• |
overseeing the evaluation and periodically reviewing the performance of the board of directors and management, including committees of the board of directors, and reporting the results of such assessment to the board of directors; |
• |
assisting the board of directors in overseeing our corporate governance functions, including developing, updating and recommending to the board of directors corporate governance principles; and |
• |
periodically reviewing with our chief executive officer the succession plans for our executive officers and making recommendations to our board of directors with respect to the selection of appropriate individuals to succeed to these positions. |
92
D. Employees
As of June 30, 2020, 2019 and 2018, we had 6,624, 5,754 and 4,819 employees (including directors), respectively. We have collective bargaining agreements with our employees in Romania. We believe our employee relations are good and we have not experienced any work stoppages. With respect to the ongoing COVID-19 pandemic, and its impact on our business, our priorities have been the health and well-being of our people and the protection of the jobs and incomes of our people. We rapidly moved to a work-from-home model, with almost 100% of our employees able to work from home, and we took efforts to provide office environments that minimized the risk of exposure for the small number who needed to attend an office. These efforts kept our employees healthy while we executed our business continuity plans, with minimal disruption to productivity.
At each date shown, we had the following employees (including directors), broken out by department and geography:
As of June 30, |
||||||||
2020 |
2019 |
2018 |
||||||
Function: |
||||||||
Employees involved in delivery of our services |
5,969 |
5,197 |
4,368 |
|||||
Selling, general and administrative |
655 |
557 |
451 |
|||||
Total |
6,624 |
5,754 |
4,819 |
|||||
Geography: |
||||||||
Western Europe(1)
|
448 |
254 |
232 |
|||||
Central Europe - EU Countries |
3,368 |
3,062 |
2,578 |
|||||
Sub-total: EU Countries (Western & Central Europe) |
3,816 |
3,316 |
2,810 |
|||||
Central Europe - Non-EU Countries |
1,810 |
1,583 |
1,279 |
|||||
Latin America |
895 |
780 |
665 |
|||||
North America |
103 |
75 |
65 |
|||||
Total |
6,624 |
5,754 |
4,819 |
|||||
E. Share Ownership.
For information regarding the share ownership of our directors and executive officers, see “Item 6.B.—Compensation—Outstanding Equity Awards, Grants and Option Exercises” and “Item 7.A—Major Shareholders.”
Item 7. Major Shareholders and Related Party Transactions
A. Major Shareholders.
The following table sets forth the beneficial ownership of our shares as of August 15, 2020:
• |
each person, or group of affiliated persons, who is known by us to beneficially own 5% or more of our Class A ordinary shares; |
• |
each person, or group of affiliated persons, who is known by us to beneficially own 5% or more of our Class B ordinary shares; |
• |
each person, or group of affiliated persons, who is known by us to beneficially own 5% or more of our Class A ordinary shares and Class B ordinary shares in the aggregate; |
93
• |
each of our executive officers; |
• |
each of our directors; and |
• |
all of our executive officers and directors as a group. |
The percentage ownership and voting power information shown in the table is based upon 34,497,817 Class A ordinary shares and 20,455,733 Class B ordinary shares outstanding as of August 15, 2020.
We have determined beneficial ownership in accordance with the rules of the SEC. These rules generally attribute beneficial ownership of securities to persons who possess sole or shared voting power or investment power with respect to those securities. In addition, the rules include ordinary shares issuable pursuant to the vesting of restricted stock units and the exercise of share options that are either immediately exercisable or exercisable on or before October 14, 2020, which is 60 days after August 15, 2020. These shares are deemed to be outstanding and beneficially owned by the person holding those options for the purpose of computing the percentage ownership of that person, but they are not treated as outstanding for the purpose of computing the percentage ownership of any other person. In addition, the total number of Class A ordinary shares in the table below does not give effect to the potential conversion of any Class B ordinary shares into Class A ordinary shares. See the section entitled “Key Provisions in our Articles of Association-Shares and Rights Attaching to Them-Share Conversion” and “Key Provisions in our Articles of Association-Shares and Rights Attaching to Them-Restrictions on Transfer” in Exhibit 2.3(a) to this Annual Report on Form 20-F (Description of Share Capital) for a discussion of the entitlement of holders of Class B ordinary shares to convert them into Class A ordinary shares and limitations on such entitlement. The information contained in the following table is not necessarily indicative of beneficial ownership for any other purpose, and the inclusion of any shares in the table does not constitute an admission of beneficial ownership of those shares. Unless otherwise indicated, the persons or entities identified in this table have sole voting and investment power with respect to all shares shown as beneficially owned by them, subject to applicable community property laws.
94
Except as otherwise noted below, the address for persons listed in the table is c/o Endava plc, 125 Old Broad Street, London EC2N 1AR, United Kingdom.
Class A Ordinary Shares Beneficially Owned |
Class B Ordinary Shares Beneficially Owned |
Total Voting Power †
|
|||||||||||||||||
Shares |
% |
Shares |
% |
% |
|||||||||||||||
Name of Beneficial Owner | |||||||||||||||||||
5% or Greater Shareholders | |||||||||||||||||||
Alex Day (1)
|
512,941 |
1.5 |
2,051,766 |
10 |
8.8 |
||||||||||||||
Goran Stevanovic (2)
|
— |
— |
1,662,500 |
8.1 |
7.0 |
||||||||||||||
BAMCO Inc./Ronald Baron/Baron Capital Group, Inc. (3)
|
2,036,006 |
5.9 |
— |
— |
* |
||||||||||||||
FMR LLC (4)
|
1,914,830 |
5.6 |
— |
— |
* |
||||||||||||||
T. Rowe Price Associates, Inc. and related entities (5)
|
2,072,716 |
6.0 |
— |
— |
* |
||||||||||||||
Executive Officers and Directors: |
|||||||||||||||||||
John Cotterell (6)
|
172,797 |
* |
9,500,000 |
46.4 |
39.8 |
||||||||||||||
Mark Thurston (7)
|
29,917 |
* |
4,250 |
* |
* |
||||||||||||||
Rohit Bhoothalingam (8)
|
— |
— |
— |
— |
— |
||||||||||||||
Rob Machin (9)
|
56,534 |
* |
336,801 |
1.6 |
1.4 |
||||||||||||||
Julian Bull (10)
|
105,697 |
* |
691,805 |
3.4 |
2.9 |
||||||||||||||
Andrew Allan (11)
|
101,875 |
* |
362,700 |
1.8 |
1.6 |
||||||||||||||
Sulina Connal (12)
|
— |
— |
— |
— |
— |
||||||||||||||
Ben Druskin (13)
|
25,500 |
* |
11,375 |
* |
* |
||||||||||||||
Michael Kinton (14)
|
4,407 |
* |
1,777,793 |
8.7 |
7.4 |
||||||||||||||
David Pattillo (15)
|
10,000 |
* |
11,375 |
* |
* |
||||||||||||||
Trevor Smith (16)
|
9,243 |
* |
61,375 |
* |
* |
||||||||||||||
All current executive officers and directors as a group (10 persons) (17)
|
515,970 |
1.5 |
12,757,474 |
62.4 |
53.6 |
||||||||||||||
________________
* |
Represents beneficial ownership of less than 1%. |
† |
Represents the voting power with respect to all of our Class A ordinary shares and Class B ordinary shares, voting as a single class. Each Class A ordinary share is entitled to one vote per share and each Class B ordinary share is entitled to 10 votes per share. The Class A ordinary shares and Class B ordinary shares will vote together on all matters (including the election of directors) submitted to a vote of shareholders. Excludes any shares issuable upon exercise of vested options within 60 days of August 15, 2020. |
(1) |
Excludes (1) 4,688 Class A ordinary shares issuable under the 2018 Equity Incentive Plan (the “2018 Plan”) and (2) 723 Class A ordinary shares issuable under the 2018 Sharesave Plan (the “Sharesave Plan”), none of which are issuable within 60 days of August 15, 2020. |
(2) |
Excludes (1) 6,842 Class A ordinary shares issuable under the 2018 Plan and (2) 723 Class A ordinary shares issuable under the Sharesave Plan, none of which are issuable within 60 days of August 15, 2020. Does not give effect to the conversion of 665,000 Class B ordinary shares that may be converted by Mr. Stevanovic into Class A Shares within 60 days of August 15, 2020. |
(3) |
Based solely on a Schedule 13G/A filed on July 10, 2020. Consists of ADSs representing Class A ordinary shares held of record by BAMCO Inc., Baron Capital Group, Inc. and Ronald Baron, who have shared voting power and shared dispositive power over the shares. BAMCO Inc. (“BAMCO”) and Baron Capital Management, Inc. (“BCM”) are subsidiaries of Baron Capital Group, Inc. (“BCG”) and Ronald Baron owns a controlling interest in BCG. The principal business address for each of BAMCO, BCM, BCG and Ronald Baron is 767 Fifth Avenue, 49th Floor, New York, NY 10153.
|
(4) |
Based solely on a Schedule 13G/A filed on August 10, 2020 by FMR LLC. Consists of ADSs representing Class A ordinary shares. According to the filing, FMR LLC has (i) sole voting power with respect to 42,817 shares and (ii) sole dispositive power with respect to all the shares. Abigail P. Johnson is Director, Chairman and Chief Executive Officer of FMR LLC, and a member of the Johnson family, who through their ownership of voting common shares and the execution of a shareholders’ |
95
voting agreement with respect to FMR LLC, may be deemed, under the Investment Company Act of 1940, to form a controlling group with respect to FMR LLC. Neither FMR LLC nor Abigail P. Johnson has the sole power to vote or direct the voting of the shares owned directly by the various investment companies registered under the Investment Company Act (“Fidelity Funds”) advised by Fidelity Management & Research Company LLC (“FMR Co. LLC”), a wholly owned subsidiary of FMR LLC, which power resides with the Fidelity Funds’ Boards of Trustees. FMR Co. LLC carries out the voting of the shares under written guidelines established by the Fidelity Funds’ Boards of Trustees. The address of FMR LLC is 245 Summer Street, Boston, Massachusetts, 02210.
(5) |
Based solely on a Schedule 13G/A filed on February 14, 2020. Consists of ADSs representing Class A ordinary shares. According to the filing, T. Rowe Price Associates, Inc. (“Price Associates”) has (i) sole voting power over 409,579 shares and sole dispositive power over (ii) 2,072,716 shares, and T. Rowe Price New Horizons Fund, Inc. (“New Horizons Fund”) has sole voting power over 1,116,614 shares. The address of Price Associates and New Horizons Fund is 100 E. Pratt Street, Baltimore, MD 21202. |
(6) |
Consists of (1) 7,500,000 Class B ordinary shares held directly by Mr. Cotterell and (2) 2,000,000 Class B ordinary shares held in a trust of which Mr. Cotterell is a trustee. Excludes 123,288 Class A ordinary shares issuable under the 2018 Plan, none of which are issuable within 60 days of August 15, 2020. Does not give effect to the conversion of 3,565,115 Class B ordinary shares that may be converted by Mr. Cotterell into Class A ordinary shares within 60 days of August 15, 2020.
|
(7) |
Excludes (1) 20,000 Class A ordinary shares held in trust on behalf of Mr. Thurston by the Endava Limited Guernsey Employee Benefit Trust (the “EBT”) pursuant to the 2015 Long Term Incentive Plan (“the 2015 Plan”), (2) 61,644 Class A ordinary shares issuable under the 2018 Plan and (3) 377 Class A ordinary shares issuable under the Sharesave Plan, none of which are issuable within 60 days of August 15, 2020. See “Management-Equity Compensation Arrangements-Endava Limited 2015 Long Term Incentive Plan” for a description of the 2015 Plan. Does not give effect to the conversion of 1,700 Class B ordinary shares that may be converted by Mr. Thurston into Class A ordinary shares within 60 days of August 15, 2020. |
(8) |
Excludes (1) 16,510 Class A ordinary shares issuable under the 2018 Plan and (2) 564 Class A ordinary shares issuable under the Sharesave Plan, none of which are issuable within 60 days of August 15, 2020. |
(9) |
Excludes (1) 49,315 Class A ordinary shares issuable under the 2018 Plan and (2) 723 Class A ordinary shares issuable under the Sharesave Plan, none of which are issuable within 60 days of August 15, 2020. |
(10) |
Excludes 49,315 Class A ordinary shares issuable under the 2018 Plan, none of which are issuable within 60 days of August 15, 2020. |
(11) |
Excludes (1) 3,125 Class A ordinary shares issuable under the Non-Executive Director Long Term Incentive Plan (the “Non-Executive Director Plan”) and (2) 11,063 Class A ordinary shares issuable under the 2018 Plan, none of which are issuable within 60 days of August 15, 2020. Includes (1) 625 Class A ordinary shares issuable upon exercise of vested options within 60 days of August 15, 2020 and (2) 101,250 Class A ordinary shares held by Mr. Allan's spouse. Does not give effect to the conversion of 115,080 Class B ordinary shares that may be converted by Mr. Allan into Class A ordinary shares within 60 days of August 15, 2020.
|
(12) |
Excludes 3,563 Class A ordinary shares issuable under the 2018 Plan, none of which are issuable within 60 days of August 15, 2020. |
(13) |
Excludes (1) 3,125 Class A ordinary shares issuable under the Non-Executive Director Plan and (2) 3,563 Class A ordinary shares issuable under the 2018 Plan none of which are issuable within 60 days of August 15, 2020. Does not give effect to the conversion of 4,550 Class B ordinary shares that may be converted by Mr. Druskin into Class A ordinary shares within 60 days of August 15, 2020. |
(14) |
Excludes 3,563 Class A ordinary shares issuable under the 2018 Plan, none of which are issuable within 60 days of August 15, 2020. Includes (1) 657 ADSs, (2) 2,500 Class A ordinary shares and (3) 1,250 Class A ordinary shares issuable upon exercise of vested options within 60 days of August 15, 2020. Does not give effect to the conversion of 295,559 Class B ordinary shares that may be converted by Mr. Kinton into Class A ordinary shares within 60 days of August 15, 2020. |
(15) |
Excludes (1) 3,125 Class A ordinary shares issuable under the Non-Executive Director Plan and (2) 3,563 Class A ordinary shares issuable under the 2018 Plan, none of which are issuable within 60 days of August 15, 2020. Does not give effect to the conversion of 4,550 Class B ordinary shares that may be converted by Mr. Pattillo into Class A Shares within 60 days of August 15, 2020. |
(16) |
Excludes 3,563 Class A ordinary shares issuable under the 2018 Plan, none of which are issuable within 60 days of August 15, 2020. Includes (1) 2,655 ADSs, (2) 5,338 Class A ordinary shares and (3) 1,250 Class A ordinary shares issuable upon exercise of vested options within 60 days of August 15, 2020. Does not give effect to the conversion of 24,550 Class B ordinary shares that may be converted by Mr. Smith into Class A ordinary shares within 60 days of August 15, 2020. |
(17) |
Excludes (1) 20,000 Class A ordinary shares held in trust by the Employee Benefit Trust pursuant to the 2015 Plan, (2) 9,375 Class A ordinary shares issuable under the Non-Executive Director Plan, (3) 328,950 Class A ordinary shares issuable under the 2018 Plan, and (4) 1,664 Class A Shares issuable under the Sharesave Plan, none of which are issuable within 60 days of August 15, 2020. Does not give effect to the conversion of 4,011,104 Class B ordinary shares that may be converted by the holders thereof into Class A ordinary shares within 60 days of August 15, 2020. |
96
The significant changes in the percentage ownership held by our principal shareholders since July 1, 2016 are as a result of the transactions described in the final prospectus related to our IPO dated July 26, 2018, filed with the SEC on July 27, 2018 pursuant to Rule 424(b), under the heading “Certain Relationships and Related Party Transactions,” the dilution resulting from, and the end of the lock-up period relating to, our initial public offering and the public offering of our shares by us and certain selling shareholders in April 2019 and conversions of Class B ordinary shares to Class A ordinary shares.
Our Class B ordinary shares have 10 votes per share, and our Class A ordinary shares, which are the shares underlying the ADSs, each have one vote per share.
We are not aware of any arrangement whereby we are directly or indirectly owned or controlled by another corporation, by any foreign government or by any other natural or legal person severally or jointly, not are we aware of any arrangement that may, at a subsequent date, result in a change of control of our company.
Record Holders.
As of August 15, 2020, 54,953,550 of our ordinary shares were issued and outstanding. To our knowledge, approximately 1% of our total outstanding Class A ordinary shares were held by eight record holders in the United States. As of August 15, 2020, to our knowledge, approximately 2% of our outstanding Class B ordinary shares are held by four record holders in the United States. Additionally, approximately 73% of our total outstanding Class A ordinary shares are held by a nominee of the depositary for the ordinary shares underlying our ADSs. The number of beneficial owners of the ADSs in the United States is likely to be much larger than the number of record holders of our ordinary shares in the United States.
B. Related Party Transactions.
Certain Relationships and Related Party Transactions
The following is a summary of transactions since July 1, 2019 to which we have been a participant, and in which any of our then directors, executive officers or holders of more than 5% of any class of our voting securities at the time of such transaction, or any members of their immediate family, had or will have a direct or indirect material interest.
Transactions with the Endava Limited Guernsey Employee Benefit Trust
On June 28, 2011, we established the EBT to operate in conjunction with our JSOP and other incentive arrangements. The beneficiaries of the EBT are our employees, including former employees, and directors. The Trustee is an independent trustee. See “Directors, Senior Management and Employees-Compensation-Joint Share Ownership Plan.” As of June 30, 2020, the EBT held 1.5 % of our Class A ordinary shares. The EBT acquires Class A ordinary shares to be held by the Trustee and the applicable beneficiary of the EBT together as tenants in common pursuant to a trust deed. In connection with each acquisition, the applicable beneficiary pays a per share price to the Trustee in cash. Since July 1, 2019 there were no transactions between our executive officers and directors and holders of more than 5% of any class of our share capital and the EBT.
In addition, from time to time we loan funds to the EBT in connection with administration of the JSOP. These transactions are consolidated in our financial statements.
Share Option Grants and Equity Incentive Awards to Directors and Executive Officers
We have granted share options and equity incentive awards to certain of our directors and executive officers. For more information regarding the share options and awards granted to our directors and named executive officers see “Directors, Senior Management and Employees-Compensation.”
Indemnity Agreements
We have entered into deeds of indemnity with each of our directors and executive officers. See “Directors, Senior Management and Employees-Compensation-Insurance and Indemnification.”
97
Transactions with Google
Since April 2020, one of our directors, Sulina Connal, is employed by Google as Director of Product Partnerships for News, Web and Publishing for EMEA. In the ordinary course of its business, from time to time Endava enters into agreements for cloud service or other solutions provided by Google in connection with services provided by Endava to its clients. All transactions with Google were entered into on an arms-length basis. For the year ended June 30, 2020, the aggregate cost incurred by Endava to Google for such services was £0.2 million.
Transaction with PaperRound
We have entered into a customer relationship with PaperRound HND Service Ltd., a company in which Mike Kinton, a member of our board of directors, holds a controlling interest and serves as a director. All transactions with PaperRound were entered into on an arms-length basis and in the ordinary course of business. We did not generate revenue from PaperRound in the fiscal year ended June 30, 2020.
Related Person Transaction Policy
Our audit committee has the primary responsibility for reviewing and approving or disapproving related party transactions, which are transactions between us and related persons in which we or a related person has or will have a direct or indirect material interest. For purposes of this policy, a related person is defined as a director, executive officer, nominee for director or greater than 5% beneficial owner of any class of our outstanding securities, in each case since the beginning of the most recently completed year, and their immediate family members. Our audit committee charter provides that the audit committee shall review and approve or disapprove any related party transactions.
D. Interests of Experts and Counsel.
Not applicable.
Item 8. Financial Information
A. Consolidated Statements and Other Financial Information.
Consolidated Financial Statements
Our consolidated financial statements are appended as part of this annual report at the end of this annual report, starting at page F-1.
Legal Proceedings
From time to time we may become involved in legal proceedings or be subject to claims arising in the ordinary course of our business. We are currently party to legal proceedings that, if determined adversely to us, could have an adverse effect on our business, results of operations, financial condition or cash flows. Regardless of the outcome, litigation can have an adverse impact on us because of defense and settlement costs, diversion of management resources and other factors.
Dividend Distribution Policy
Our dividends are declared at the discretion of our board of directors. We declared an aggregate of £18.2 million in dividends during the fiscal year ended June 30, 2016. We did not pay any dividends in the fiscal years ended June 30, 2017, June 30, 2018, June 30, 2019 and June 30, 2020 and do not anticipate paying any dividends for the foreseeable future. We intend to retain all available funds and any future earnings for use in the operation and expansion of our business. Payment of cash dividends, if any, in the future will be at the discretion of our board of directors in compliance with applicable legal requirements and will depend on a number of factors, including future earnings, our financial condition, operating results, contractual restrictions, capital requirements, business prospects, our strategic goals and plans to expand our business, applicable law and other factors that our board of directors may deem relevant. In addition, our revolving credit facility limits our ability to pay dividends, with certain exceptions. See “Risk Factors — We do not intend to pay dividends for the foreseeable future and, as a result, your ability to achieve a return on your investment will depend on appreciation in the price of our ADSs.”
98
B. Significant Changes
Since June 30, 2020, the following significant change has occurred:
On August 17, 2020, Endava completed the acquisition of the Comtrade Digital Services business, or CDS, by acquiring the total issued share capital of Comtrade CDS, digitalne storitve, d.o.o., a company registered in Slovenia, or CDS Slovenia and Comtrade Digital Services d.o.o., a company registered in Serbia, or CDS Serbia. CDS Slovenia and CDS Serbia together own and operate (either directly or through subsidiaries) all of the trade and assets that comprise CDS. CDS was formerly a division of Comtrade Group B.V., or Comtrade. CDS is headquartered in Dublin, Ireland, has delivery centers across the Adriatic, and provides strategic software engineering services and solutions to clients in Europe and in the United States.
The acquisition was made pursuant to the terms of a share purchase agreement between Endava (UK) Limited, Comtrade and Comtrade Solutions Management Holdinška Družba d.o.o., dated August 17, 2020.
The total consideration was €60 million payable in cash, which amount remains subject to post-closing adjustments based on the cash, debt and working capital of CDS as of the closing date. Ten percent of the purchase price will be held back for 24 months and be available to satisfy any warranty or indemnity claims. Pursuant to the terms of a transitional services agreement, Comtrade will continue to provide certain services to Endava with respect to CDS for a period of time following completion of the acquisition.
Item 9. The Offer and Listing.
A. Offer and Listing Details.
The ADS have been listed on the New York Stock Exchange under the symbol “DAVA” since July 27, 2018. Prior to that date, there was no public trading market for ADSs or our ordinary shares.
B. Plan of Distribution.
Not applicable
C. Markets.
The ADS have been trading on the New York Stock Exchange under the symbol “DAVA” since July 27, 2018.
D. Selling Shareholders.
Not applicable
E. Dilution.
Not applicable
F. Expenses of the issue.
Not applicable.
Item 10. Additional Information.
A. Share Capital
Not applicable.
B. Memorandum and Articles of Association
The information required by this section, including a summary of certain key provisions of our articles of association, is set forth in Exhibit 2.3(a) (Description of Share Capital) filed as an exhibit to this Annual Report on Form 20-F and is incorporated herein by reference.
99
C. Material Contracts
On August 17, 2020, we entered into a share purpose agreement between Endava (UK) Limited, Comtrade and Comtrade Management. Pursuant to this agreement Endava (UK) Limited agreed to acquire CDS by purchasing the entire share capital of CDS Slovenia and CDS Serbia. For more information on this material contract and our acquisition of CDS see “Item 8.B. Significant Changes” of this Annual Report on 20-F.
We entered into an underwriting agreement among Morgan Stanley & Co. LLC, Citigroup Global Markets Inc., Credit Suisse Securities (USA) LLC and Deutsche Bank Securities Inc. as representatives of the underwriters on April 15, 2019, with respect to the ADSs sold by existing shareholders in a public offering on April 15, 2019. We have agreed to indemnify the underwriters against certain liabilities, including liabilities under the Securities Act.
For additional information on our material contracts, please see “Item 4. Information on the Company,” “Item 5.B. Liquidity and Capital Resources,” “Item 6. Directors, Senior Management and Employees,” and “Item 7.B. Related Party Transactions” of this Annual Report on 20-F.
D. Exchange Controls.
There are no governmental laws, decrees, regulations or other legislation in the United Kingdom that may affect the import or export of capital, including the availability of cash and cash equivalents for use by us, or that may affect the remittance of dividends, interest, or other payments by us to non-resident holders of our ordinary shares or ADSs, other than withholding tax requirements. There is no limitation imposed by English law or our articles of association on the right of non-residents to hold or vote shares.
E. Taxation
U.S. Federal Income Tax Considerations for U.S. Holders
The following discussion describes the material U.S. federal income tax consequences relating to the ownership and disposition of our Class A ordinary shares or ADSs by U.S. Holders (as defined below). This discussion applies to U.S. Holders that purchase our Class A ordinary shares or ADSs and hold such Class A ordinary shares or ADSs as capital assets for tax purposes. This discussion is based on the U.S. Internal Revenue Code of 1986, as amended, or the Code, U.S. Treasury regulations promulgated thereunder and administrative and judicial interpretations thereof, and the income tax treaty between the United Kingdom and the United States, or the Treaty, all as in effect on the date hereof and all of which are subject to change, possibly with retroactive effect. There can be no assurance the Internal Revenue Service, or IRS, or a court will not take a contrary position to that discussed below regarding the tax consequences of the ownership and disposition of our ADSs and Class A ordinary shares. This discussion does not address all of the U.S. federal income tax consequences that may be relevant to specific U.S. Holders in light of their particular circumstances or to U.S. Holders subject to special treatment under U.S. federal income tax law (such as certain financial institutions, insurance companies, dealers or traders in securities or other persons that generally mark their securities to market for U.S. federal income tax purposes, tax-exempt entities or governmental organizations, retirement plans, regulated investment companies, real estate investment trusts, grantor trusts, brokers, dealers or traders in securities, commodities, currencies or notional principal contracts, certain former citizens or long-term residents of the United States, persons who hold our Class A ordinary shares or ADSs as part of a “straddle,” “hedge,” “conversion transaction,” “synthetic security” or integrated investment, persons that have a “functional currency” other than the U.S. dollar, persons who are subject to the tax accounting rules of Section 451(b) of the Code, persons that own directly, indirectly or through attribution 10% or more (by vote or value) of our equity, corporations that accumulate earnings to avoid U.S. federal income tax, partnerships and other pass-through entities, and investors in such pass-through entities). This discussion does not address any U.S. state or local or non-U.S. tax consequences or any U.S. federal estate, gift or alternative minimum tax consequences.
As used in this discussion, the term “U.S. Holder” means a beneficial owner of our Class A ordinary shares or ADSs that is, for U.S. federal income tax purposes, (1) an individual who is a citizen or resident of the United States, (2) a corporation (or entity treated as a corporation for U.S. federal income tax purposes) created or organized in or under the laws of the United States, any state thereof, or the District of Columbia, (3) an estate the income of which is subject to U.S. federal income tax regardless of its source or (4) a trust (x) with respect to which a court within the
100
United States is able to exercise primary supervision over its administration and one or more United States persons have the authority to control all of its substantial decisions or (y) that has elected under applicable U.S. Treasury regulations to be treated as a domestic trust for U.S. federal income tax purposes.
If an entity treated as a partnership for U.S. federal income tax purposes holds our Class A ordinary shares or ADSs, the U.S. federal income tax consequences relating to an investment in such Class A ordinary shares or ADSs will depend upon the status and activities of such entity and the particular partner. Any such entity and a partner in any such entity should consult its own tax advisor regarding the U.S. federal income tax consequences applicable to it (and, as applicable, its partners) of the ownership and disposition of our Class A ordinary shares or ADSs.
U.S. Holders should consult their own tax advisors as to the particular tax consequences applicable to them relating to the ownership and disposition of our Class A ordinary shares or ADSs, including the applicability of U.S. federal, state and local tax laws and non-U.S. tax laws.
The discussion below assumes that the representations contained in the deposit agreement are true and that the obligations in the deposit agreement and any related agreement will be complied with in accordance with their terms. Generally, a holder of an ADS should be treated for U.S. federal income tax purposes as holding the Class A ordinary shares represented by the ADS. Accordingly, no gain or loss will be recognized upon an exchange of ADSs for Class A ordinary shares. The U.S. Treasury has expressed concerns that intermediaries in the chain of ownership between the holder of an ADS and the issuer of the security underlying the ADS may be taking actions that are inconsistent with the holder of the ADS’s beneficial ownership of the underlying security. Accordingly, the creditability of foreign taxes, if any, as described below, could be affected by actions taken by intermediaries in the chain of ownership between the holders of ADSs and us if as a result of such actions the holders of ADSs are not properly treated as beneficial owners of the underlying Class A ordinary shares. These actions would also be inconsistent with the claiming of the reduced rate of tax, described below, applicable to dividends received by certain non-corporate holders.
Passive Foreign Investment Company Rules
In general, a corporation organized outside the United States will be treated as a passive foreign investment company, or PFIC, for any taxable year in which either (1) at least 75% of its gross income is “passive income,” or the PFIC income test, or (2) on average at least 50% of its assets, determined on a quarterly basis, are assets that produce passive income or are held for the production of passive income, or the PFIC asset test. Passive income for this purpose generally includes, among other things, dividends, interest, royalties, rents, and gains from the sale or exchange of property that give rise to passive income. Assets that produce or are held for the production of passive income generally include cash, even if held as working capital or raised in a public offering, marketable securities, and other assets that may produce passive income. Generally, in determining whether a non-U.S. corporation is a PFIC, a proportionate share of the income and assets of each corporation in which it owns, directly or indirectly, at least a 25% interest (by value) is taken into account.
Although PFIC status is determined on an annual basis and generally cannot be determined until the end of the taxable year, based on the nature of our current and expected income and the current and expected value and composition of our assets, we believe we were not a PFIC for our 2019 tax year and we do not expect to be a PFIC for our current taxable year. There can be no assurance that we will not be a PFIC in future taxable years. Even if we determine that we are not a PFIC for a taxable year, there can be no assurance that the Internal Revenue Service, or IRS, will agree with our conclusion and that the IRS would not successfully challenge our position. Because of the uncertainties involved in establishing our PFIC status, our U.S. counsel expresses no opinion regarding our PFIC status.
If we are a PFIC in any taxable year during which a U.S. Holder owns our Class A ordinary shares or ADSs, the U.S. Holder could be liable for additional taxes and interest charges under the “PFIC excess distribution regime” upon (1) a distribution paid during a taxable year that is greater than 125% of the average annual distributions paid in the three preceding taxable years, or, if shorter, the U.S. Holder’s holding period for our Class A ordinary shares or ADSs, and (2) any gain recognized on a sale, exchange or other disposition, including, under certain circumstances, a pledge, of our Class A ordinary shares or ADSs, whether or not we continue to be a PFIC. Under the PFIC excess distribution regime, the tax on such distribution or gain would be determined by allocating the distribution or gain ratably over the U.S. Holder’s holding period for our Class A ordinary shares or ADSs. The amount allocated to the current taxable year (i.e., the year in which the distribution occurs or the gain is recognized) and any year prior to the first taxable year in
101
which we are a PFIC will be taxed as ordinary income earned in the current taxable year. The amount allocated to other taxable years will be taxed at the highest marginal rates in effect for individuals or corporations, as applicable, to ordinary income for each such taxable year, and an interest charge, generally applicable to underpayments of tax, will be added to the tax.
If we are a PFIC for any year during which a U.S. Holder holds our Class A ordinary shares or ADSs, we must generally continue to be treated as a PFIC by that holder for all succeeding years during which the U.S. Holder holds such Class A ordinary shares or ADSs, unless we cease to meet the requirements for PFIC status and the U.S. Holder makes a “deemed sale” election with respect to our Class A ordinary shares or ADSs. If the election is made, the U.S. Holder will be deemed to sell our Class A ordinary shares or ADSs it holds at their fair market value on the last day of the last taxable year in which we qualified as a PFIC, and any gain recognized from such deemed sale would be taxed under the PFIC excess distribution regime. After the deemed sale election, the U.S. Holder’s Class A ordinary shares or ADSs would not be treated as shares of a PFIC unless we subsequently become a PFIC.
If we are a PFIC for any taxable year during which a U.S. Holder holds our Class A ordinary shares or ADSs and one of our non-United States subsidiaries is also a PFIC (i.e., a lower-tier PFIC), such U.S. Holder would be treated as owning a proportionate amount (by value) of the shares of the lower-tier PFIC and would be taxed under the PFIC excess distribution regime on distributions by the lower-tier PFIC and on gain from the disposition of shares of the lower-tier PFIC even though such U.S. Holder would not receive the proceeds of those distributions or dispositions. Any of our non-United States subsidiaries that have elected to be disregarded as entities separate from us or as partnerships for U.S. federal income tax purposes would not be corporations under U.S. federal income tax law and accordingly, cannot be classified as lower-tier PFICs. However, a non-United States subsidiary that has not made the election may be classified as a lower-tier PFIC if we are a PFIC during your holding period and the subsidiary meets the PFIC income test or PFIC asset test.
If we are a PFIC, a U.S. Holder will not be subject to tax under the PFIC excess distribution regime on distributions or gain recognized on our Class A ordinary shares or ADSs if a valid “mark-to-market” election is made by the U.S. Holder for our Class A ordinary shares or ADSs. An electing U.S. Holder generally would take into account as ordinary income each year, the excess of the fair market value of our Class A ordinary shares or ADSs held at the end of such taxable year over the adjusted tax basis of such Class A ordinary shares or ADSs. The U.S. Holder would also take into account, as an ordinary loss each year, the excess of the adjusted tax basis of such Class A ordinary shares or ADSs over their fair market value at the end of the taxable year, but only to the extent of the excess of amounts previously included in income over ordinary losses deducted as a result of the mark-to-market election. The U.S. Holder’s tax basis in our Class A ordinary shares or ADSs would be adjusted annually to reflect any income or loss recognized as a result of the mark-to-market election. Any gain from a sale, exchange or other disposition of our Class A ordinary shares or ADSs in any taxable year in which we are a PFIC would be treated as ordinary income and any loss from such sale, exchange or other disposition would be treated first as ordinary loss (to the extent of any net mark-to-market gains previously included in income) and thereafter as capital loss. If, after having been a PFIC for a taxable year, we cease to be classified as a PFIC because we no longer meet the PFIC income or PFIC asset test, the U.S. Holder would not be required to take into account any latent gain or loss in the manner described above and any gain or loss recognized on the sale or exchange of the Class A ordinary shares or ADSs would be classified as a capital gain or loss.
A mark-to-market election is available to a U.S. Holder only for “marketable stock.” Generally, stock will be considered marketable stock if it is “regularly traded” on a “qualified exchange” within the meaning of applicable U.S. Treasury regulations. A class of stock is regularly traded during any calendar year during which such class of stock is traded, other than in de minimis quantities, on at least 15 days during each calendar quarter.
Our ADSs will be marketable stock as long as they remain listed on the New York Stock Exchange and are regularly traded. A mark-to-market election will not apply to the Class A ordinary shares or ADSs for any taxable year during which we are not a PFIC, but will remain in effect with respect to any subsequent taxable year in which we become a PFIC. Such election will not apply to any of our non-U.S. subsidiaries. Accordingly, a U.S. Holder may continue to be subject to tax under the PFIC excess distribution regime with respect to any lower-tier PFICs notwithstanding the U.S. Holder’s mark-to-market election for our Class A ordinary shares or ADSs.
102
The tax consequences that would apply if we are a PFIC would also be different from those described above if a U.S. Holder were able to make a valid qualified electing fund, or “QEF,” election. As we do not expect to provide U.S. Holders with the information necessary for a U.S. Holder to make a QEF election, a U.S. holder should assume that a QEF election will not be available.
The U.S. federal income tax rules relating to PFICs are very complex. U.S. Holders are strongly urged to consult their own tax advisors with respect to the impact of PFIC status on the ownership and disposition of our Class A ordinary shares or ADSs, the consequences to them of an investment in a PFIC, any elections available with respect to the Class A ordinary shares or ADSs and the IRS information reporting obligations with respect to the purchase, ownership and disposition of Class A ordinary shares or ADSs of a PFIC.
Distributions
Subject to the discussion above under “— Passive Foreign Investment Company Rules,” a U.S. Holder that receives a distribution with respect to our Class A ordinary shares or ADSs generally will be required to include the gross amount of such distribution in gross income as a dividend when actually or constructively received by the U.S. Holder (or in the case of ADSs, the depositary) to the extent of the U.S. Holder’s pro rata share of our current and/or accumulated earnings and profits (as determined under U.S. federal income tax principles). To the extent a distribution received by a U.S. Holder is not a dividend because it exceeds the U.S. Holder’s pro rata share of our current and accumulated earnings and profits, it will be treated first as a tax-free return of capital and reduce (but not below zero) the adjusted tax basis of the U.S. Holder’s Class A ordinary shares or ADSs. To the extent the distribution exceeds the adjusted tax basis of the U.S. Holder’s Class A ordinary shares or ADSs, the remainder will be taxed as capital gain. Because we may not account for our earnings and profits in accordance with U.S. federal income tax principles, U.S. Holders should expect all distributions to be reported to them as dividends. The amount of a dividend will include any amounts withheld by the Company in respect of United Kingdom taxes.
Distributions on our Class A ordinary shares or ADSs that are treated as dividends generally will constitute income from sources outside the United States for foreign tax credit purposes and generally will constitute passive category income for foreign tax credit purposes. Subject to applicable limitations, some of which vary depending upon the U.S. Holder’s particular circumstances, and subject to the discussion above regarding concerns expressed by the U.S. Treasury, any United Kingdom income taxes withheld from dividends on Class A ordinary shares or ADSs at a rate not exceeding the rate provided by the Treaty will be creditable against the U.S. Holder’s U.S. federal income tax liability. The rules governing foreign tax credits are complex and U.S. Holders should consult their tax advisers regarding the creditability of foreign taxes in their particular circumstances. In lieu of claiming a foreign tax credit, U.S. Holders may, at their election, deduct foreign taxes, including any United Kingdom income tax, in computing their taxable income, subject to generally applicable limitations under U.S. law. An election to deduct foreign taxes instead of claiming foreign tax credits applies to all foreign taxes paid or accrued in the taxable year.
Distributions paid on our Class A ordinary shares or ADSs will not be eligible for the “dividends received’’ deduction generally allowed to corporate shareholders with respect to dividends received from U.S. corporations under the Code. Subject to the discussion above regarding concerns expressed by the U.S. Treasury, dividends paid by a “qualified foreign corporation’’ to non-corporate U.S. Holders are eligible for taxation at a reduced capital gains rate rather than the marginal tax rates generally applicable to ordinary income provided that a holding period requirement (more than 60 days of ownership, without protection from the risk of loss, during the 121-day period beginning 60 days before the ex-dividend date) and certain other requirements are met. Each U.S. Holder is advised to consult its tax advisors regarding the availability of the reduced tax rate on dividends to its particular circumstances. However, if we are a PFIC for the taxable year in which the dividend is paid or the preceding taxable year (see discussion above under “— Passive Foreign Investment Company Rules’’), we will not be treated as a qualified foreign corporation, and therefore the reduced capital gains tax rate described above will not apply.
A non-United States corporation (other than a corporation that is classified as a PFIC for the taxable year in which the dividend is paid or the preceding taxable year) generally will be considered to be a qualified foreign corporation with respect to any dividend it pays on Class A ordinary shares or ADSs that are readily tradable on an established securities market in the United States.
103
The amount of any dividend income that is paid in British Pounds will be the U.S. dollar amount calculated by reference to the exchange rate in effect on the date of receipt, regardless of whether the payment is in fact converted into U.S. dollars. If the dividend is converted into U.S. dollars on the date of receipt (actual or constructive), a U.S. Holder should not be required to recognize foreign currency gain or loss in respect of the dividend income. A U.S. Holder may have foreign currency gain or loss if the dividend is converted into U.S. dollars after the date of receipt (actual or constructive).
Sale, Exchange or Other Taxable Disposition of Our Class A Ordinary Shares or ADSs
Subject to the discussion above under “— Passive Foreign Investment Company Rules,’’ a U.S. Holder generally will recognize capital gain or loss for U.S. federal income tax purposes upon the sale, exchange or other disposition of our Class A ordinary shares or ADSs in an amount equal to the difference, if any, between the amount realized (i.e., the amount of cash plus the fair market value of any property received) on the sale, exchange or other disposition and such U.S. Holder’s adjusted tax basis in the Class A ordinary shares or ADSs. Such capital gain or loss generally will be long-term capital gain taxable at a reduced rate for non-corporate U.S. Holders or long-term capital loss if, on the date of sale, exchange or other disposition, the Class A ordinary shares or ADSs were held by the U.S. Holder for more than one year. Any capital gain of a non-corporate U.S. Holder that is not long-term capital gain is taxed at ordinary income rates. The deductibility of capital losses is subject to limitations. Any gain or loss recognized from the sale or other disposition of our Class A ordinary shares or ADSs will generally be gain or loss from sources within the United States for U.S. foreign tax credit purposes.
Medicare Tax
Certain U.S. Holders that are individuals, estates or trusts and whose income exceeds certain thresholds generally are subject to a 3.8% tax on all or a portion of their net investment income, which may include their gross dividend income and net gains from the disposition of our Class A ordinary shares or ADSs. If you are a U.S. Holder that is an individual, estate or trust, you are encouraged to consult your tax advisors regarding the applicability of this tax to your income and gains in respect of your investment in our Class A ordinary shares or ADSs.
Information Reporting and Backup Withholding
U.S. Holders may be required to file certain U.S. information reporting returns with the IRS with respect to an investment in our Class A ordinary shares or ADSs, including, among others, IRS Form 8938 (Statement of Specified Foreign Financial Assets). In addition, each U.S. Holder who is a shareholder of a PFIC must file an annual report containing certain information. Substantial penalties may be imposed upon a U.S. Holder that fails to comply with the required information reporting.
Dividends on and proceeds from the sale or other disposition of our Class A ordinary shares or ADSs generally have to be reported to the IRS unless the U.S. Holder establishes a basis for exemption. Backup withholding may apply to amounts subject to reporting if the holder (1) fails to provide an accurate U.S. taxpayer identification number or otherwise establish a basis for exemption, or (2) is described in certain other categories of persons. However, U.S. Holders that are corporations generally are excluded from these information reporting and backup withholding tax rules.
Backup withholding is not an additional tax. Any amounts withheld under the backup withholding rules generally will be allowed as a refund or a credit against a U.S. Holder’s U.S. federal income tax liability if the required information is furnished by the U.S. Holder on a timely basis to the IRS.
U.S. Holders should consult their own tax advisors regarding the backup withholding tax and information reporting rules.
EACH U.S. HOLDER IS URGED TO CONSULT ITS OWN TAX ADVISOR ABOUT THE TAX CONSEQUENCES TO IT OF AN INVESTMENT IN OUR CLASS A ORDINARY SHARES OR ADSs IN LIGHT OF THE INVESTOR’S OWN CIRCUMSTANCES, INCLUDING THE APPLICABILITY OF U.S. FEDERAL, STATE AND LOCAL TAX LAWS AND NON-U.S. TAX LAWS.
104
U.K. Taxation
The following is intended as a general guide to current U.K. tax law and HM Revenue & Customs, or HMRC, practice applying as at the date of this Annual Report on Form 20-F (both of which are subject to change at any time, possibly with retrospective effect) relating to the holding of ADSs. It does not constitute legal or tax advice and does not purport to be a complete analysis of all U.K. tax considerations relating to the holding of ADSs, or all of the circumstances in which holders of ADSs may benefit from an exemption or relief from U.K. taxation. It is written on the basis that the company does not (and will not) directly or indirectly derive 75% or more of its qualifying asset value from U.K. land, and that the company is and remains solely resident in the United Kingdom for tax purposes and will therefore be subject to the U.K. tax regime and not the U.S. tax regime save as set out above under “U.S. Federal Income Tax Considerations for U.S. Holders.”
Except to the extent that the position of non-U.K. resident persons is expressly referred to, this guide relates only to persons who are resident (and, in the case of individuals, domiciled or deemed domiciled) for tax purposes solely in the United Kingdom and do not have a permanent establishment, branch, agency (or equivalent) or fixed base in any other jurisdiction with which the holding of the ADSs is connected, or U.K. Holders, who are absolute beneficial owners of the ADSs (where the ADSs are not held through an Individual Savings Account or a Self-Invested Personal Pension) and who hold the ADSs as investments.
This guide may not relate to certain classes of U.K. Holders, such as (but not limited to):
• |
persons who are connected with the company; |
• |
financial institutions; |
• |
insurance companies; |
• |
charities or tax-exempt organizations; |
• |
collective investment schemes; |
• |
pension schemes; |
• |
market makers, intermediaries, brokers or dealers in securities; |
• |
persons who have (or are deemed to have) acquired their ADSs by virtue of an office or employment or who are or have been officers or employees of the company or any of its affiliates; and |
• |
individuals who are subject to U.K. taxation on a remittance basis. |
The decision of the First-tier Tribunal (Tax Chamber) in HSBC Holdings PLC and The Bank of New York Mellon Corporation v HMRC (2012) cast some doubt on whether a holder of a depositary receipt is the beneficial owner of the underlying shares. However, based on published HMRC guidance we would expect that HMRC will regard a holder of ADSs as holding the beneficial interest in the underlying shares and therefore these paragraphs assume that a holder of ADSs is the beneficial owner of the underlying Class A ordinary shares and any dividends paid in respect of the underlying Class A ordinary shares (where the dividends are regarded for U.K. purposes as that person’s own income) for U.K. direct tax purposes.
THESE PARAGRAPHS ARE A SUMMARY OF CERTAIN U.K. TAX CONSIDERATIONS AND ARE INTENDED AS A GENERAL GUIDE ONLY. IT IS RECOMMENDED THAT ALL HOLDERS OF ADSs OBTAIN ADVICE AS TO THE CONSEQUENCES OF THE ACQUISITION, OWNERSHIP AND DISPOSAL OF THE ADSs IN THEIR OWN SPECIFIC CIRCUMSTANCES FROM THEIR OWN TAX ADVISORS. IN PARTICULAR, NON-U.K. RESIDENT OR DOMICILED PERSONS ARE ADVISED TO CONSIDER THE POTENTIAL IMPACT OF ANY RELEVANT DOUBLE TAXATION AGREEMENTS.
105
Dividends
Withholding Tax
Dividends paid by the company will not be subject to any withholding or deduction for or on account of U.K. tax.
Income Tax
An individual U.K. Holder may, depending on his or her particular circumstances, be subject to U.K. tax on dividends received from the company. An individual holder of ADSs who is not resident for tax purposes in the United Kingdom should not be chargeable to U.K. income tax on dividends received from the company unless he or she carries on (whether solely or in partnership) a trade, profession or vocation in the United Kingdom through a branch or agency to which the ADSs are attributable. There are certain exceptions for trading in the United Kingdom through independent agents, such as some brokers and investment managers.
All dividends received by an individual U.K. Holder from us or from other sources will form part of that U.K. Holder’s total income for income tax purposes and will constitute the top slice of that income. A nil rate of income tax will apply to the first £2,000 of taxable dividend income received by the individual U.K. Holder in a tax year. Income within the nil rate band will be taken into account in determining whether income in excess of the £2,000 tax-free allowances falls within the basic rate, higher rate or additional rate tax bands.
Dividend income in excess of the tax-free allowance will (subject to the availability of any income tax personal allowance) be taxed at 7.5 per cent to the extent that the excess amount falls within the basic rate tax band, 32.5 per cent to the extent that the excess amount falls within the higher rate tax band and 38.1 per cent to the extent that the excess amount falls within the additional rate tax band.
Corporation Tax
A corporate holder of ADSs who is not resident for tax purposes in the United Kingdom should not be chargeable to U.K. corporation tax on dividends received from the company unless it carries on (whether solely or in partnership) a trade in the United Kingdom through a permanent establishment to which the ADSs are attributable.
Corporate U.K. Holders should not be subject to U.K. corporation tax on any dividend received from the company so long as the dividends qualify for exemption, which should be the case, although certain conditions must be met. If the conditions for the exemption are not satisfied, or such U.K. Holder elects for an otherwise exempt dividend to be taxable, U.K. corporation tax will be chargeable on the amount of any dividends (at the current rate of 19%).
Chargeable Gains
A disposal or deemed disposal of ADSs by a U.K. Holder may, depending on the U.K. Holder’s circumstances and subject to any available exemptions or reliefs (such as the annual exemption), give rise to a chargeable gain or an allowable loss for the purposes of U.K. capital gains tax and corporation tax on chargeable gains.
If an individual U.K. Holder who is subject to U.K. income tax at either the higher or the additional rate is liable to U.K. capital gains tax on the disposal of ADSs, the current applicable rate will be 20%. For an individual U.K. Holder who is subject to U.K. income tax at the basic rate and liable to U.K. capital gains tax on such disposal, the current applicable rate would be 10%, save to the extent that any capital gains when aggregated with the U.K. Holder’s other taxable income and gains in the relevant tax year exceed the unused basic rate tax band. In that case, the rate currently applicable to the excess would be 20%.
If a corporate U.K. Holder becomes liable to U.K. corporation tax on the disposal (or deemed disposal) of ADSs, the main rate of U.K. corporation tax (currently 19%) would apply.
A holder of ADSs which is not resident for tax purposes in the United Kingdom should not normally be liable to U.K. capital gains tax or corporation tax on chargeable gains on a disposal (or deemed disposal) of ADSs unless the person is carrying on (whether solely or in partnership) a trade, profession or vocation in the United Kingdom through a branch or agency (or, in the case of a corporate holder of ADSs, through a permanent establishment to which the
106
ADSs are attributable. However, an individual holder of ADSs who has ceased to be resident for tax purposes in the United Kingdom for a period of less than five years and who disposes of ADSs during that period may be liable on his or her return to the United Kingdom to U.K. tax on any capital gain realized (subject to any available exemption or relief).
Stamp Duty and Stamp Duty Reserve Tax
The discussion below relates to the holders of our Class A ordinary shares or ADSs wherever resident, however it should be noted that special rules may apply to certain persons such as market makers, brokers, dealers or intermediaries.
Issues of Shares
No U.K. stamp duty or stamp duty reserve tax, or SDRT, is payable on the issue of the underlying Class A ordinary shares in the company.
Transfers of Shares
An unconditional agreement to transfer Class A ordinary shares in certificated form will normally give rise to a charge to SDRT at the rate of 0.5% of the amount or value of the consideration payable for the transfer. The purchaser of the shares is liable for the SDRT. Transfers of Class A ordinary shares in certificated form are generally also subject to stamp duty at the rate of 0.5% of the amount or value of the consideration given for the transfer (rounded up to the next £5.00). Stamp duty is normally paid by the purchaser. The charge to SDRT will be canceled or, if already paid, repaid (generally with interest), where a transfer instrument has been duly stamped within six years of the charge arising (either by paying the stamp duty or by claiming an appropriate relief) or if the instrument is otherwise exempt from stamp duty.
An unconditional agreement to transfer Class A ordinary shares to, or to a nominee or agent for, a person whose business is or includes the issue of depositary receipts or the provision of clearance services will generally be subject to SDRT (or, where the transfer is effected by a written instrument, stamp duty) at a higher rate of 1.5% of the amount or value of the consideration given for the transfer unless the clearance service has made and maintained an election under section 97A of the U.K. Finance Act 1986, or a section 97A election. It is understood that HMRC regards the facilities of DTC as a clearance service for these purposes and we are not aware of any section 97A election having been made by DTC.
Based on current published HMRC practice and recent case law, no SDRT is generally payable where the transfer of Class A ordinary shares to a clearance service or depositary receipt system is an integral part of an issue of share capital.
Any stamp duty or SDRT payable on a transfer of Class A ordinary shares to a depositary receipt system or clearance service will in practice generally be paid by the participants in the clearance service or depositary receipt system. Any stamp duty or SDRT payable on the transfer to a clearance service or depositary receipt system of Class A ordinary shares that will be represented by ADSs to be sold by the selling shareholders will ultimately be borne by the selling shareholders.
Issue or Transfers of ADSs
No U.K. stamp duty or SDRT should be required to be paid on the issue of an ADS. No stamp duty or SDRT will be payable on the transfer of (including an agreement to transfer) ADSs through the facilities of DTC.
F. Dividends and paying agents.
Not applicable.
G. Statement by Experts
Not applicable.
107
H. Documents on display.
We are subject to the information reporting requirements of the Exchange Act applicable to foreign private issuers. Accordingly, we are required to file reports and other information with the Securities and Exchange Commission, or SEC, including annual reports on Form 20-F and reports on Form 6-K. Those reports may be inspected without charge at the locations described below. As a foreign private issuer, we are exempt from the rules under the Exchange Act related to the furnishing and content of proxy statements, and our officers, directors and principal shareholders are exempt from the reporting and short swing profit recovery provisions contained in Section 16 of the Exchange Act. In addition, we are not required under the Exchange Act to file periodic reports and financial statements with the SEC as frequently or as promptly as United States companies whose securities are registered under the Exchange Act. Nevertheless, we will file with the U.S. Securities and Exchange Commission an Annual Report on Form 20-F containing financial statements that have been examined and reported on, with and opinion expressed by an independent registered public accounting firm, and we intend to submit quarterly interim consolidated financial data to the SEC under cover of the SEC’s Form 6-K.
We also maintain a website at http://www.endava.com. We intend to post our Annual Report on Form 20-F on our website promptly following it being filed with the SEC. Information contained in, or accessible through, our website is not a part of this Annual Report on Form 20-F, and the inclusion of our website address in this Annual Report on Form 20-F is solely as an inactive textual reference.
The SEC maintains a website (http://www.sec.gov) that contains reports, proxy and information statements and other information regarding registrants, such as Endava, that file electronically with the Securities and Exchange Commission.
With respect to references made in this Annual Report on Form 20-F to any contract or other document of Endava, such references are not necessarily complete and you should refer to the exhibits attached or incorporated by reference to this Annual Report on Form 20-F for copies of the actual contract or document.
I. Subsidiary Information
Not applicable.
Item 11. Quantitative and Qualitative Disclosures About Market Risk.
Qualitative and Quantitative Disclosures about Market Risk
We are exposed to market risks in the ordinary course of our business. Market risk represents the risk of loss that may impact our financial position due to adverse changes in financial market prices and rates. Our market risk exposure is primarily the result of fluctuations in foreign exchange rates as well as, to a lesser extent, interest rates and inflation.
Foreign Currency Exchange Rate Risk
We conduct business in multiple countries and currencies, which exposes us to risks associated with fluctuations in currency exchange rates. Our reporting currency is the British Pound, but we transact business in other currencies as well, principally the Euro, U.S. Dollar and the RON. Any necessary foreign currency transactions, principally re-translation of monetary items such as short-term inter-company balances and borrowings, are effected using the exchange rates prevailing on the dates of the transactions and are recognized in the statement of comprehensive income. In addition, the assets and liabilities of each of our subsidiaries are translated into British Pounds at exchange rates in effect at each balance sheet date and operations accounts are translated using the average exchange rate for the relevant period. Foreign currency translation adjustments are accounted for as a component of comprehensive income and reflected in the foreign exchange translation reserve and in comprehensive income on the statement of changes in equity.
In the fiscal year ended June 30, 2020, 42.9% of our sales were denominated in the British Pound, 29.4% of our sales were denominated in U.S. dollars, 26.1% were denominated in Euros and the balance was in other currencies. Conversely, during the same time period, 60.6% of our expenses were denominated in Euros (or in currencies that largely follow the Euro, including the RON) and 13.6% in U.S. dollars. As a result, strengthening of the Euro relative
108
to the British Pound and weakening of the U.S. dollar relative to the British Pound present the most significant risks to us. Any significant fluctuations in currency exchange rates may have a material impact on our business.
Prior to June 30, 2016, we entered into forward contracts to fix the exchange rate for inter-company transactions between the British Pound and the RON, with changes in the fair value of these forward contracts being recognized in profit or loss.
We have not engaged in the hedging of foreign currency transactions since the start of fiscal year 2017, although we may choose to do so in the future.
Interest Rate Risk
We had cash and cash equivalents of £101.3 million as of June 30, 2020, which consisted of readily available bank deposits in various currencies, principally Euro, U.S. Dollar, British Pound and RON. These investments earn interest at variable rates and, as a result, decreases in market interest rates would generally result in decreased interest income.
We also have a revolving credit facility that bears interest based on LIBOR and EURIBOR plus a variable margin. Changes in the applicable rate result in fluctuations in the required cash flows to service this debt. For example, a 1% (one hundred basis points) increase in the applicable market interest rate would result in an additional £2.0 million in interest expense if the maximum borrowable amount under the revolving credit facility were outstanding for the entire fiscal year.
We do not enter into investments for trading or speculative purposes and have not used any derivative financial instruments to manage our interest rate risk exposure.
Inflation Risk
A large proportion of our services are delivered from locations in Central Europe and Latin America. Consequently, we are exposed to the risks associated with economies that are undergoing rapid growth with evolving controls and regulations, which can drive inflationary pressure. Although we do not believe that inflation has had a material impact on our financial position or results of operations to date, a high rate of inflation in the future may have an adverse effect on our ability to maintain current levels of gross margin and selling, general and administrative expenses as a percentage of sales if the selling prices of our services do not increase in line with increases in costs.
Concentration of Credit and Other Risk
During the fiscal years ended June 30, 2020, 2019 and 2018, our 10 largest clients based on revenue accounted for 38.1%, 37.7%, and 41.5% of our total revenue, respectively. Worldpay was our largest client for each of the last three fiscal years, contributing less than 10% in both 2020 and 2019, and 10.8% in 2018.
Credit losses and write-offs of trade receivable balances have historically not been material to our consolidated financial statements.
See note 31 to our consolidated financial statements appearing elsewhere in this Annual Report on Form 20-F for more details on financial instruments risk.
Item 12. Description of Securities Other than Equity Securities.
A. Debt Securities.
Not applicable.
B. Warrants and Rights.
Not applicable.
C. Other Securities.
Not applicable.
109
D. American Depositary Shares.
Certain of the information required by this section is set forth in Exhibit 2.3(b) (Description of American Depositary Shares) filed as an exhibit to this Annual Report on Form 20-F and is incorporated herein by reference.
Citibank, N.A., as depositary, registers and delivers American Depositary Shares, also referred to as ADSs. Each ADS represents the right to receive, and to exercise the beneficial ownership interests in, one Class A ordinary share that is on deposit with the Citibank, N.A., London Branch, located at 25 Canada Square, Canary Wharf, London E14 5LB, United Kingdom, the custodian for the depositary.
Each ADS also represents the right to receive, and to exercise the beneficial interests in, any other property received by the depositary or the custodian on behalf of the owner of the ADS but that has not been distributed to the owners of ADSs because of legal restrictions or practical considerations. The depositary’s corporate trust office at which the ADSs are administered is located at 388 Greenwich Street, New York, New York 10013.
A deposit agreement among us, the depositary and the ADS holders sets out the ADS holder rights as well as the rights and obligations of the depositary. New York law governs the deposit agreement and the ADRs. A copy of the Agreement is incorporated by reference as an exhibit to this Annual Report on Form 20-F.
Fees and Expenses
Pursuant to the terms of the deposit agreement, the holders of ADSs will be required to pay the following fees:
Service |
Fees |
|
Issuance of ADSs (e.g., an issuance of ADS upon a deposit of Class A ordinary shares or upon a change in the ADS(s)-to-Class A ordinary shares ratio), excluding ADS issuances as a result of distributions of Class A ordinary shares |
Up to $0.05 per ADS issued |
|
Cancellation of ADSs (e.g., a cancellation of ADSs for delivery of deposited property or upon a change in the ADS(s)-to-Class A ordinary shares ratio, or for any other reason) |
Up to $0.05 per ADS cancelled |
|
Distribution of cash dividends or other cash distributions (e.g., upon a sale of rights and other entitlements) |
Up to $0.05 per ADS held |
|
Distribution of ADSs pursuant to (i) share dividends or other free share distributions, or (ii) exercise of rights to purchase additional ADSs |
Up to $0.05 per ADS held |
|
Distribution of securities other than ADSs or rights to purchase additional ADSs (e.g., upon a spin-off) |
Up to $0.05 per ADS held |
|
ADS Services |
Up to $0.05 per ADS held on the applicable record date(s) established by the depositary |
|
ADS holders will also be responsible to pay certain charges such as:
• |
taxes (including applicable interest and penalties) and other governmental charges; |
• |
the registration fees as may from time to time be in effect for the registration of Class A ordinary shares on the share register and applicable to transfers of Class A ordinary shares to or from the name of the custodian, the depositary, or any nominees upon the making of deposits and withdrawals, respectively; |
• |
certain cable, telex, and facsimile transmission and delivery expenses; |
• |
the expenses and charges incurred by the depositary in the conversion of foreign currency; |
• |
the fees and expenses incurred by the depositary in connection with compliance with exchange control regulations and other regulatory requirements applicable to Class A ordinary shares, ADSs, and ADRs; and the fees and expenses incurred by the depositary, the custodian, or any nominee in connection with the servicing or delivery of deposited property. |
110
ADS fees and charges payable upon (i) the issuance of ADSs, and (ii) the cancellation of ADSs are charged to the person for whom the ADSs are issued (in the case of ADS issuances) and to the person for whom ADSs are cancelled (in the case of ADS cancellations). In the case of ADSs issued by the depositary into DTC, the ADS issuance and cancellation fees and charges may be deducted from distributions made through DTC, and may be charged to the DTC participant(s) receiving the ADSs being issued or the DTC participant(s) holding the ADSs being cancelled, as the case may be, on behalf of the beneficial owner(s) and will be charged by the DTC participant(s) to the account of the applicable beneficial owner(s) in accordance with the procedures and practices of the DTC participants as in effect at the time. ADS fees and charges in respect of distributions and the ADS service fee are charged to the holders as of the applicable ADS record date. In the case of distributions of cash, the amount of the applicable ADS fees and charges is deducted from the funds being distributed. In the case of (i) distributions other than cash and (ii) the ADS service fee, holders as of the ADS record date will be invoiced for the amount of the ADS fees and charges and such ADS fees and charges may be deducted from distributions made to holders of ADSs. For ADSs held through DTC, the ADS fees and charges for distributions other than cash and the ADS service fee may be deducted from distributions made through DTC, and may be charged to the DTC participants in accordance with the procedures and practices prescribed by DTC and the DTC participants in turn charge the amount of such ADS fees and charges to the beneficial owners for whom they hold ADSs.
In the event of refusal to pay the depositary fees, the depositary may, under the terms of the deposit agreement, refuse the requested service until payment is received or may set off the amount of the depositary fees from any distribution to be made to the ADS holder. Certain depositary fees and charges (such as the ADS services fee) may become payable shortly after the closing of the ADS offering. Note that the fees and charges you may be required to pay may vary over time and may be changed by us and by the depositary. You will receive prior notice of such changes. The depositary may reimburse us for certain expenses incurred by us in respect of the ADR program, by making available a portion of the ADS fees charged in respect of the ADR program or otherwise, upon such terms and conditions as we and the depositary agree from time to time.
PART II
Item 13. Defaults, Dividend Arrearages and Delinquencies.
Not applicable.
Item 14. Material Modifications to the Rights of Security Holders and Use of Proceeds.
Initial Public Offering
In July 2018, we sold 7,291,000 ADSs, each representing one Class A ordinary share, nominal value £0.02 per ordinary share, in our initial public offering at a public offering price of $20.00 per share, for aggregate gross proceeds to us of approximately $145.8 million. The net offering proceeds to us, after deducting underwriting discounts and commissions totaling approximately $9.7 million, offering expenses totaling approximately $7.5 million and onward payments to selling shareholders of $75.6 million, were approximately $53.0 million. The offering commenced on June 29, 2018 and did not terminate before all of the securities registered in the registration statement were sold. The effective date of the registration statement, File No. 333-226010, for our initial public offering of ADSs was July 26, 2018. Morgan Stanley & Co. LLC, Citigroup Global Markets Inc., Credit Suisse Securities (USA) LLC and Deutsche Bank Securities Inc. acted as joint book-running managers of the offering and as representatives of the underwriters.
None of the net proceeds of our initial public offering were paid directly or indirectly to any director, officer, general partner of ours or to their associates, persons owning 10% or more of any class of our equity securities, or to any of our affiliates. As of June 30, 2020, we had consumed all of the net proceeds from the IPO, primarily to pay down outstanding amounts under the Facility Agreement (approximately $26.0 million) and for working capital and general corporate purposes.
Item 15. Controls and Procedures.
Evaluation of Disclosure Controls and Procedures
111
Our disclosure controls and procedures are designed to provide reasonable assurance of achieving the desired control objectives. Our management, including our chief executive officer and chief financial officer, recognizes that any control system, no matter how well designed and operated, is based upon certain judgments and assumptions and cannot provide absolute assurance that its objectives will be met. Similarly, an evaluation of controls cannot provide absolute assurance that misstatements due to error or fraud will not occur or that all control issues and instances of fraud, if any, have been detected.
Our management, with the participation of our chief executive officer and chief financial officer, evaluated the effectiveness of our disclosure controls and procedures (as defined in Rules 13a-15(e) and 15d-15(e) under the Exchange Act) as of June 30, 2020. Based on this evaluation, management concluded that our disclosure controls and procedures were not effective as of June 30, 2020 due to material weaknesses in internal control over financial reporting, as described below. Notwithstanding such material weaknesses in internal control over financial reporting, our management concluded that our consolidated financial statements in this Annual Report on Form 20-F present fairly, in all material respects, the Company’s financial position, results of operations and cash flows as of the dates, and for the periods presented, in conformity with IFRS.
Management's Annual Report on Internal Control Over Financial Reporting
Our management is responsible for establishing and maintaining adequate internal controls over financial reporting (as defined in Rules 13a-15(f) and 15d-15(f) under the Exchange Act) and for the assessment of the effectiveness of our internal control over financial reporting. Our internal control over financial reporting is designed to provide reasonable assurance regarding the reliability of financial reporting and the preparation of consolidated financial statements for external purposes in accordance with IFRS. Our internal control over financial reporting includes those policies and procedures that (i) pertain to the maintenance of records that, in reasonable detail, accurately and fairly reflect transactions and dispositions of assets, (ii) provide reasonable assurance that transactions are recorded as necessary to permit preparation of consolidated financial statements in accordance with generally accepted accounting principles, (iii) provide reasonable assurance that receipts and expenditures are being made only in accordance with authorizations of management and directors, and (iv) provide reasonable assurance regarding prevention or timely detection of unauthorized acquisition, use or disposition of assets that could have a material effect on the consolidated financial statements.
Material weakness in Internal Control over Financial Reporting
Because of the inherent limitations of control systems, internal control over financial reporting, no matter how well designed and operated, may not prevent or detect misstatements. In addition, projections of any evaluation as to the effectiveness of such controls in future periods are subject to the risk that controls may become inadequate because of changes in conditions, or that the degree of compliance with the policies or procedures may deteriorate.
A material weakness is a deficiency, or a combination of deficiencies, in internal control over financial reporting, such that there is a reasonable possibility that a material misstatement of our annual or interim financial statements will not be prevented or detected on a timely basis.
Management, with the participation of our chief executive officer and chief financial officer, assessed our internal control over financial reporting based upon the framework in Internal Control - Integrated Framework (2013) issued by the Committee of Sponsoring Organizations of the Treadway Commission (COSO). Based on this assessment, our management concluded that the material weaknesses in our internal control over financial reporting described below existed as of June 30, 2020 and,therefore, that our internal control over financial reporting was not effective as of June 30, 2020.
In accordance with guidance issued by the Securities and Exchange Commission, management’s assessment of our internal control over financial reporting did not include the internal controls of Intuitus Limited and Exozet GmbH, which were acquired in November and December 2019, respectively. The total amount of Intuitus Limited and Exozet GmbH assets and revenues in our consolidated financial statements for the year ended June 30, 2020 constituted £10.8 million or 3% of total assets and £11.4 million or 3% of revenue, respectively.
During management’s assessment of our internal control over financial reporting, management identified the following control deficiencies:
• |
we did not conduct an effective risk assessment process that successfully identified and assessed risks of misstatement to ensure controls were designed and implemented to respond to those risks in certain business processes; |
• |
we did not have adequate training and knowledge of the COSO 2013 Framework and its application to our internal control over financial reporting; and |
112
• |
we did not (i) establish effective information technology general controls (ITGCs), related to change management and user access over certain information technology (IT) systems, databases and applications that support our financial reporting processes, and (ii) have effective policies and procedures through which ITGCs are deployed across the organization. Additionally, automated process-level and manual controls dependent upon the completeness and accuracy of information derived from these IT systems were rendered ineffective because they are affected by the lack of ITGCs. |
As a consequence, we also did not have effective process level control activities over:
• |
our revenue recognition process related to the review of the performance obligations related to contract renewals of existing customers and the review of the completeness and accuracy of invoice adjustments made monthly to certain contracts. In addition, the validation and evidencing of the completeness and accuracy of relevant data used in calculating our allowance for credit losses relating to trade receivables and accrued income was insufficient. |
• |
our business combination process related to the review of customer attrition rates used to value customer relationship intangible assets, including the completeness and accuracy of data used in the measurement of customer attrition rates. |
• |
our payroll process related to the validation and evidencing of the completeness and accuracy of data used in payroll calculations. |
The control deficiencies described above did not result in any identified misstatements to our consolidated financial statements as of and for the year ended June 30, 2020. These control deficiencies create a reasonable possibility that a material misstatement to the consolidated financial statements will not be prevented or detected on a timely basis, and therefore we conclude that the deficiencies represent material weaknesses in internal control over financial reporting and our internal control over financial reporting is not effective as of June 30, 2020.
Remediation
Management has implemented and continues to implement measures designed to ensure that the control deficiencies contributing to the material weaknesses are remediated, such that these controls are designed, implemented, and operating effectively.
The remediation actions include: (i) implementing IT tools to allow a complete list of system changes to be logged for certain IT systems impacting financial reporting; (ii) use of IT workflow tools to simplify our change management and user access controls for ease of operation; (iii) developing enhanced training packages addressing ITGCs and policies, including educating control owners concerning the principles and requirements of each control; (iv) enhancing revenue recognition, allowance for credit losses, business combination and payroll process controls to better mitigate risks of misstatement; (v) providing certain staff with additional training on the appropriate validation and evidencing of source data inputs; (vi) strengthening our compliance functions with additional experienced hires to assist in our risk assessment process and the design and implementation of controls responsive to those risks. We will regularly provide a report on the remediation measures to the Audit Committee.
Management intends to implement the above remediation actions during the fiscal year ending June 30, 2021. We believe that these actions will remediate the material weaknesses described above. However, as we implement these remediation efforts, we may determine that additional steps may be necessary to remediate the material weaknesses, or we may identify other material weaknesses or control deficiencies. We cannot provide assurance that these remediation efforts will be successful or that our internal control over financial reporting will be effective in accomplishing all control objectives all of the time. The control deficiencies will not be considered remediated, however, until the applicable controls operate for a sufficient period of time and management has concluded, through testing, that these controls are operating effectively.
Attestation Report of the Registered Public Accounting Firm
Our independent registered public accounting firm, KPMG LLP, who audited the consolidated financial statements included in this annual report, has expressed an adverse report on the operating effectiveness of the Company’s internal control over financial reporting. KPMG LLP’s report is included below.
113
Report of Independent Registered Public Accounting Firm
To the Shareholders and Board of Directors
Endava plc
Opinion on Internal Control Over Financial Reporting
We have audited Endava plc, and subsidiaries’ (the Company) internal control over financial reporting as of June 30, 2020, based on criteria established in Internal Control - Integrated Framework (2013) issued by the Committee of Sponsoring Organizations of the Treadway Commission. In our opinion, because of the effect of the material weaknesses, described below, on the achievement of the objectives of the control criteria, the Company has not maintained effective internal control over financial reporting as of June 30, 2020, based on criteria established in Internal Control - Integrated Framework (2013) issued by the Committee of Sponsoring Organizations of the Treadway Commission.
We also have audited, in accordance with the standards of the Public Company Accounting Oversight Board (United States) (PCAOB), the consolidated balance sheets of the Company as of June 30, 2020 and 2019, the related consolidated statements of comprehensive income, changes in equity, and cash flows for each of the years in the three-year period ended June 30, 2020 and the related notes collectively, the consolidated financial statements, and our report dated September 15, 2020 expressed an unqualified opinion on those consolidated financial statements.
A material weakness is a deficiency, or a combination of deficiencies, in internal control over financial reporting, such that there is a reasonable possibility that a material misstatement of the company’s annual or interim financial statements will not be prevented or detected on a timely basis. Material weaknesses related to IT General Controls, Risk Assessment, and Adequate Training and Knowledge have been identified and included in management’s assessment. The material weaknesses were considered in determining the nature, timing, and extent of audit tests applied in our audit of the 2020 consolidated financial statements, and this report does not affect our report on those consolidated financial statements.
The Company acquired Intuitus Limited and Exozet GmbH during 2019, and management excluded from its assessment of the effectiveness of the Company’s internal control over financial reporting as of June 30, 2020, Intuitus Limited and Exozet GmbH’s internal control over financial reporting associated with total assets of £10.8 million or 3% and total revenues of £11.4 million or 3%, included in the consolidated financial statements of the Company as of and for the year ended June 30, 2020. Our audit of internal control over financial reporting of the Company also excluded an evaluation of the internal control over financial reporting of Intuitus Limited and Exozet GmbH.
Basis for Opinion
The Company’s management is responsible for maintaining effective internal control over financial reporting and for its assessment of the effectiveness of internal control over financial reporting, included in the accompanying Management’s Annual Report on Internal Control over Financial Reporting as of June 30, 2020. Our responsibility is to express an opinion on the Company’s internal control over financial reporting based on our audit. We are a public accounting firm registered with the PCAOB and are required to be independent with respect to the Company in accordance with the U.S. federal securities laws and the applicable rules and regulations of the Securities and Exchange Commission and the PCAOB.
We conducted our audit in accordance with the standards of the PCAOB. Those standards require that we plan and perform the audit to obtain reasonable assurance about whether effective internal control over financial reporting was maintained in all material respects. Our audit of internal control over financial reporting included obtaining an understanding of internal control over financial reporting, assessing the risk that a material weakness exists, and testing and evaluating the design and operating effectiveness of internal control based on the assessed risk. Our audit also included performing such other procedures as we considered necessary in the circumstances. We believe that our audit provides a reasonable basis for our opinion.
Definition and Limitations of Internal Control Over Financial Reporting
A company’s internal control over financial reporting is a process designed to provide reasonable assurance regarding the reliability of financial reporting and the preparation of financial statements for external purposes in accordance with generally accepted accounting principles. A company’s internal control over financial reporting includes those policies and procedures that (1) pertain to the maintenance of records that, in reasonable detail, accurately and fairly reflect the transactions and dispositions of the assets of the company; (2) provide reasonable assurance that transactions are recorded as necessary to permit preparation of financial statements in accordance with generally accepted accounting principles, and that receipts and expenditures of the company are being made only in accordance with authorizations of management and directors of
114
the company; and (3) provide reasonable assurance regarding prevention or timely detection of unauthorized acquisition, use, or disposition of the company’s assets that could have a material effect on the financial statements.
Because of its inherent limitations, internal control over financial reporting may not prevent or detect misstatements. Also, projections of any evaluation of effectiveness to future periods are subject to the risk that controls may become inadequate because of changes in conditions, or that the degree of compliance with the policies or procedures may deteriorate.
/s/ KPMG LLP
London, United Kingdom
September 15, 2020
Changes in Internal Control over Financial Reporting
Except for the material weakness identified above, there were no changes in our internal control over financial reporting that occurred during the period covered by this annual report that have materially affected, or that are reasonably likely to materially affect, our internal control over financial reporting.
Item 16. Reserved
Not applicable.
Item 16A. Audit Committee Financial Expert.
Our Board has determined that Mr. Pattillo is an audit committee financial expert as defined in Item 16A(b) of Form 20-F. Mr. Pattillo is independent as such term is defined in Rule 10A-3 under the Exchange Act and under the listing standards of the New York Stock Exchange.
Item 16B. Code of Business Conduct and Ethics.
We have adopted a Code of Business Conduct and Ethics, or the Code of Conduct, that is applicable to all of the directors, executives, employees and independent contractors of Endava and our subsidiaries. A copy of the Code of Conduct is available on our website at www.endava.com. The audit committee of our board of directors is responsible for overseeing the Code of Conduct and must approve any waivers of the Code of Conduct for directors, executives, employees and independent contractors. We expect that any amendments to the Code of Conduct, or any waivers of its requirements, will be disclosed on our website.
Item 16C. Principal Accountant Fees and Services.
KPMG LLP has served as our independent registered public accounting firm for fiscal years 2016, 2017, 2018, 2019 and 2020. Our accountants fees for professional services in fiscal years 2020 and 2019 are:
Year Ended June 30, |
|||||||
2020 |
2019 |
||||||
(pounds in thousands) |
|||||||
Audit Fees(1)
|
£ |
1,775 |
£ |
836 |
|||
Audit-Related Fees(2)
|
— |
186 |
|||||
Tax fees(3)
|
— |
— |
|||||
All Other fees(4)
|
— |
— |
|||||
Total |
£ |
1,775 |
£ |
1,022 |
|||
(1) “Audit Fees” are the aggregate fees for the audit of our annual financial statements. This category also includes services that generally the independent accountant provides, such as consents and assistance with and review of documents filed with the SEC.
(2) “Audit-Related Fees” are the aggregate fees for assurance and related services that are reasonably related to the performance of the audit and are not reported under Audit Fees.
(3) “Tax Fees” are the aggregate fees for professional services rendered by the principal accountant for tax compliance, tax advice and tax planning related services.
115
(4) “All Other Fees” are any additional amounts for products and services provided by the principal accountant. There were no “Tax Fees” during 2019 or 2020.
Our audit committee reviews and pre-approves the scope and the cost of audit services related to us and permissible non-audit services performed by the independent auditors, other than those for de minimis services which are approved by the audit committee prior to the completion of the audit. All of the services related to us provided by KPMG LLP during the last fiscal year have been pre-approved by the audit committee.
Item 16D. Exemptions from the Listing Standards for Audit Committees.
Not applicable.
Item 16E. Purchases of Equity Securities by the Issuer
Not applicable.
Item 16F. Change in Registrant’s Certifying Accountant.
Not applicable.
Item 16G. Corporate Governance.
As a “foreign private issuer,” as defined by the SEC, we are permitted to follow home country corporate governance practices, instead of certain corporate governance practices required by the New York Stock Exchange for U.S. domestic issuers. While we intend to follow most New York Stock Exchange corporate governance listing standards, we follow U.K. corporate governance practices in lieu of New York Stock Exchange corporate governance listing standards as follows:
• |
Exemption from quorum requirements applicable to meetings of shareholders. Such quorum requirements are not required under English law; |
• |
Exemption from the New York Stock Exchange corporate governance listing standards applicable to domestic issuers requiring disclosure within four business days of any determination to grant a waiver of the code of business conduct and ethics to directors and officers. Although we will require board approval of any such waiver, we may choose not to disclose the waiver in the manner set forth in the New York Stock Exchange corporate governance listing standards, as permitted by the foreign private issuer exemption; and |
• |
Exemption from the requirement to obtain shareholder approval for certain issuances of securities, including shareholder approval of share option plans. |
We intend to take all actions necessary for us to maintain compliance as a foreign private issuer under the applicable corporate governance requirements of the Sarbanes-Oxley Act of 2002, the rules adopted by the SEC and the New York Stock Exchange corporate governance rules and listing standards.
Because we are a foreign private issuer, our directors and senior management are not subject to short-swing profit and insider trading reporting obligations under Section 16 of the Exchange Act. They are, however, subject to the obligations to report changes in share ownership under Section 13 of the Exchange Act and related SEC rules.
Item 16H. Mine Safety Disclosure.
Not applicable.
PART III
Item 17. Financial Statements.
See pages F-1 through F-65 of this Annual Report on Form 20-F.
Item 18. Financial Statements.
Not applicable.
116
Item 19. Exhibits.
The following exhibits are filed as part of this Annual Report on Form 20-F.
|
Exhibit
Number
|
Description of Document |
|
1.1
|
Articles of Association of Endava plc, as amended (incorporated by reference to Exhibit 3.1 to our Registration Statement on Form F-1 (File No. 333-226010), filed with the Commission on June 29, 2018 (the “F-1 Registration Statement”))
|
|
2.1 |
||
2.2 |
||
2.3(a)* |
||
2.3(b)* |
Description of American Depositary Shares (incorporated by reference to Exhibit 2.3(b) of our Annual Report on Form 20-F for the year ended June 30, 2019 (File. No. 00138607), filed with the Commission on September 25, 2019 (the “2019 20-F”)). |
|
4.1+
|
Endava Share Option Plan (incorporated by reference to Exhibit 10.1 to our F-1 Registration Statement)
|
|
4.2+
|
Endava Joint Share Ownership Plan (incorporated by reference to Exhibit 10.2 to our F-1 Registration Statement)
|
|
4.3+
|
Endava Limited 2015 Long Term Incentive Plan (incorporated by reference to Exhibit 10.3 to our F-1 Registration Statement)
|
|
4.4+
|
Endava Limited 2017 Non-Executive Director Long Term Incentive Plan (incorporated by reference to Exhibit 10.4 to our F-1 Registration Statement)
|
|
4.5+
|
Endava plc 2018 Equity Incentive Plan (incorporated by reference to Exhibit 10.5 to our F-1 Registration Statement)
|
|
4.6+
|
Endava plc 2018 Sharesave Plan (incorporated by reference to Exhibit 10.6 to our F-1 Registration Statement)
|
|
4.7*+ |
Endava plc 2018 International Sub Plan (incorporated by reference to Exhibit 4.7 of our 2019 20-F). |
|
4.8 |
Form of Deed of Indemnity for Directors and Officers (incorporated by reference to Exhibit 10.8 to our F-1 Registration Statement)
|
|
4.9 |
Lease Agreement by and among Gide Loyrette Nouel LLP, Endava (UK) Limited and Endava Limited, dated as of July 8, 2014, for the East Premises (incorporated by reference to Exhibit 10.9 to our F-1 Registration Statement)
|
|
4.10 |
Lease Agreement by and among Gide Loyrette Nouel LLP, Endava (UK) Limited and Endava Limited, dated as of July 8, 2014, for the West Premises (incorporated by reference to Exhibit 10.10 to our F-1 Registration Statement)
|
|
4.11 |
Multicurrency Revolving Facility Agreement dated October 12, 2019, among Endava plc, the Original Borrowers, the Original Guarantors, the Mandated Lead Arrangers, the Original Lenders and HSBC Bank PLC, as agent (incorporated by reference to Exhibit 99.2 to our Current Report on Form 6-K (File No. 001-38607) filed with the Commission on October 15, 2019.
|
|
4.12 |
||
8.1* |
||
12.1* |
||
12.2* |
||
117
13.1** |
||
15.1* |
||
101.INS* |
XBRL Instance Document |
|
101.SCH* |
XBRL Taxonomy Extension Schema Document |
|
101.CAL* |
XBRL Taxonomy Extension Calculation Linkbase Document |
|
101.DEF* |
XBRL Taxonomy Extension Definition Linkbase Document |
|
101.LAB* |
XBRL Taxonomy Extension Label Linkbase Document |
|
101.PRE* |
XBRL Taxonomy Extension Presentation Linkbase Document |
|
104 |
Cover page interactive data file (formatted as Inline XBRL and contained in Exhibit 101) |
|
________________
* |
Filed herewith. |
** |
Furnished herewith. |
+ |
Indicates management contract or compensatory plan. |
118
INDEX TO CONSOLIDATED FINANCIAL STATEMENTS | |
Page |
|
ENDAVA PLC | |
For the Years Ended June 30, 2020, 2019 and 2018 |
|
F-1
Report of Independent Registered Public Accounting Firm
To the Stockholders and Board of Directors
Endava plc
Opinion on the Consolidated Financial Statements
We have audited the accompanying consolidated balance sheets of Endava plc and subsidiaries (the Company) as of June 30, 2020 and 2019, the related consolidated statements of comprehensive income, and changes in equity, and cash flows for each of the years in the three‑year period ended June 30, 2020, and the related notes (collectively, the consolidated financial statements). In our opinion, the consolidated financial statements present fairly, in all material respects, the financial position of the Company as of June 30, 2020 and 2019, and the results of its operations and its cash flows for each of the years in the three‑year period ended June 30, 2020, in conformity with International Financial Reporting Standards as issued by the International Accounting Standards Board.
We also have audited, in accordance with the standards of the Public Company Accounting Oversight Board (United States) (PCAOB), the Company’s internal control over financial reporting as of June 30, 2020, based on criteria established in Internal Control - Integrated Framework (2013) issued by the Committee of Sponsoring Organizations of the Treadway Commission, and our report dated September 15, 2020 expressed an adverse opinion on the effectiveness of the Company’s internal control over financial reporting.
Change in Accounting Principle
As discussed in Note 2 to the consolidated financial statements, the Company has changed its method of accounting for Leases as of July 1, 2019 due to the adoption of IFRS 16.
Basis for Opinion
These consolidated financial statements are the responsibility of the Company’s management. Our responsibility is to express an opinion on these consolidated financial statements based on our audits. We are a public accounting firm registered with the PCAOB and are required to be independent with respect to the Company in accordance with the U.S. federal securities laws and the applicable rules and regulations of the Securities and Exchange Commission and the PCAOB.
We conducted our audits in accordance with the standards of the PCAOB. Those standards require that we plan and perform the audit to obtain reasonable assurance about whether the consolidated financial statements are free of material misstatement, whether due to error or fraud. Our audits included performing procedures to assess the risks of material misstatement of the consolidated financial statements, whether due to error or fraud, and performing procedures that respond to those risks. Such procedures included examining, on a test basis, evidence regarding the amounts and disclosures in the consolidated financial statements. Our audits also included evaluating the accounting principles used and significant estimates made by management, as well as evaluating the overall presentation of the consolidated financial statements. We believe that our audits provide a reasonable basis for our opinion.
Critical Audit Matters
The critical audit matters communicated below are matters arising from the current period audit of the consolidated financial statements that were communicated or required to be communicated to the audit committee and that: (1) relate to accounts or disclosures that are material to the consolidated financial statements and (2) involved our especially challenging, subjective, or complex judgments. The communication of critical audit matters does not alter in any way our opinion on the consolidated financial statements, taken as a whole, and we are not, by communicating the critical audit matters below, providing separate opinions on the critical audit matters or on the accounts or disclosures to which they relate.
F-2
Evaluation of the fair value of customer relationship intangible assets acquired through business combinations
As discussed in Note 15 to the consolidation financial statements, during the year ended June 30, 2020, the Company consummated two business combinations for aggregate consideration of £32 million. These acquisitions resulted in the recognition of customer relationship intangible assets totalling £9.1 million.
We identified the evaluation of the fair value of customer relationship intangible assets acquired through business combinations as a critical audit matter because evaluating the fair value involved a high degree of subjective auditor judgment related to use of certain assumptions in the valuation models. The key assumptions used within the valuation models included expected future revenue growth, customer attrition rate, and the discount rates applied. Changes in these assumptions could have a significant impact on the fair value of the customer relationship intangible assets.
The primary procedures we performed to address this critical audit matter included the following:
We evaluated the expected future revenue growth used by the Company by comparing the assumptions used to the historical performance of acquired entities, and to the revenue growth rates of peer companies. We assessed the customer attrition rate based on historical data of acquired entities. We also involved a valuation professional with specialised skills and knowledge who assisted in evaluating:
a. |
expected future revenue growth used by the Company to value the customer relationship intangible asset as compared to industry and macro-economic trend data; and; |
b. |
the discount rates applied by comparing them to an independently developed range using publicly available market data for comparable entities. |
Valuation of the allowance for credit losses related to trade receivables and accrued income
As discussed in Note 19 to the consolidated financial statements, the Company maintains a credit loss allowance (the allowance) of £3.6 million in respect of trade receivables and accrued income totalling £72.8 million as of June, 30 2020. The allowance is recorded based on the Company’s historical, observable default rates and is adjusted by a forward-looking estimate that includes consideration of macro-economic, customer segment, and customer specific trends and conditions.
We identified the evaluation of the allowance for credit losses related to trade receivables and accrued income as a critical audit matter. There was a high degree of subjective auditor judgement in assessing the assumptions used to determine the probability of the Company’s collection of receivables, specifically the nature of any customer dispute and consideration of economic conditions that may affect the ability of customers to pay billed and unbilled fees.
The primary procedures we performed to address this critical audit matter included the following:
For certain customers, we inquired of relevant Company personnel to evaluate the rationale for establishing the allowance for trade receivables and accrued income. We obtained and inspected the Company’s economic conditions analysis by sector compared to economic outlook market reports to evaluate the risk factors applied by the Company in determining which customers were at risk of default. We obtained and inspected relevant underlying documentation, including customer correspondance, historical collection trends, age of trade receivables, and realisation analyses to assess the Company’s estimated allowance for customers at risk of default.
/s/ KPMG LLP |
We have served as the Company’s auditor since 2016. |
London, United Kingdom |
September 15, 2020 |
F-3
CONSOLIDATED STATEMENT OF COMPREHENSIVE INCOME
For the years ended 30 June 2020, 2019 and 2018
Note |
2020 |
2019 |
2018 |
|||||||||||
|
£’000
|
£’000
|
£’000
|
||||||||||||
Revenue |
5 |
350,950 |
287,930 |
217,613 |
||||||||||
Cost of sales |
||||||||||||||
Direct cost of sales |
(233,352 |
) |
(174,152 |
) |
(132,775 |
) |
||||||||
Allocated cost of sales |
(17,447 |
) |
(14,951 |
) |
(12,668 |
) |
||||||||
Total cost of sales |
(250,799 |
) |
(189,103 |
) |
(145,443 |
) |
||||||||
Gross profit |
100,151 |
98,827 |
72,170 |
|||||||||||
Selling, general and administrative expenses |
(78,279 |
) |
(65,857 |
) |
(46,737 |
) |
||||||||
Operating profit |
6 |
21,872 |
32,970 |
25,433 |
||||||||||
Finance expense |
9 |
(1,940 |
) |
(6,299 |
) |
(818 |
) |
|||||||
Finance income |
10 |
3,109 |
3,429 |
35 |
||||||||||
Net finance income/(expense) |
1,169 |
(2,870 |
) |
(783 |
) |
|||||||||
Gain on sale of subsidiary |
6 |
2,215 |
— |
— |
||||||||||
Profit before tax |
25,256 |
30,100 |
24,650 |
|||||||||||
Tax on profit on ordinary activities |
11 |
(3,846 |
) |
(6,093 |
) |
(5,675 |
) |
|||||||
Profit for the year and profit attributable to the equity holders of the Company |
21,410 |
24,007 |
18,975 |
|||||||||||
Other comprehensive income |
||||||||||||||
Items that may be reclassified subsequently to profit or loss: |
||||||||||||||
Exchange differences on translating foreign operations |
(2,240 |
) |
(5,987 |
) |
(409 |
) |
||||||||
Total comprehensive income for the year attributable to the equity holders of the Company |
19,170 |
18,020 |
18,566 |
|||||||||||
Earnings per share (EPS): |
13 |
|||||||||||||
Basic EPS |
£ |
0.40 |
£ |
0.48 |
£ |
0.42 |
||||||||
Diluted EPS |
£ |
0.38 |
£ |
0.44 |
£ |
0.38 |
||||||||
Weighted average number of shares outstanding - basic |
53,423,575 |
50,116,979 |
45,100,165 |
|||||||||||
Weighted average number of shares outstanding - diluted |
56,065,080 |
55,026,223 |
50,426,216 |
|||||||||||
The notes hereto form an integral part of these consolidated financial statements.
F-4
CONSOLIDATED BALANCE SHEET
As of 30 June 2020 and 2019
Note |
2020 £’000 |
2019
£’000
(Restated) (1)
|
||||||
Assets - Non current |
||||||||
Goodwill |
14 |
56,885 |
36,760 |
|||||
Intangible assets |
16 |
38,751 |
28,910 |
|||||
Property, plant and equipment |
17 |
12,747 |
10,579 |
|||||
Lease right-of-use assets |
23 |
51,134 |
— |
|||||
Deferred tax assets |
12 |
13,340 |
9,550 |
|||||
Financial assets |
23 |
639 |
— |
|||||
Total |
173,496 |
85,799 |
||||||
Assets - Current |
||||||||
Trade and other receivables |
19 |
82,614 |
65,917 |
|||||
Corporation tax receivable |
2,922 |
790 |
||||||
Financial assets |
23 |
584 |
— |
|||||
Cash and cash equivalents |
101,327 |
70,172 |
||||||
Total |
187,447 |
136,879 |
||||||
Total assets |
360,943 |
222,678 |
||||||
Liabilities - Current |
||||||||
Lease liabilities |
23 |
11,132 |
21 |
|||||
Trade and other payables |
20 |
58,599 |
48,502 |
|||||
Corporation tax payable |
1,449 |
2,920 |
||||||
Contingent consideration |
15 |
1,442 |
1,244 |
|||||
Deferred consideration |
15 |
3,764 |
1,516 |
|||||
Total |
76,386 |
54,203 |
||||||
Liabilities - Non-current |
||||||||
Lease liabilities |
23 |
42,233 |
— |
|||||
Deferred tax liabilities |
12 |
5,861 |
2,033 |
|||||
Other liabilities |
136 |
113 |
||||||
Total |
48,230 |
2,146 |
||||||
Equity |
||||||||
Share capital |
24 |
1,099 |
1,089 |
|||||
Share premium |
27 |
221 |
128 |
|||||
Merger relief reserve |
25,527 |
21,573 |
||||||
Retained earnings |
27 |
214,638 |
146,963 |
|||||
Other reserves |
27 |
(3,817 |
) |
(1,577 |
) |
|||
Investment in own shares |
27 |
(1,341 |
) |
(1,847 |
) |
|||
Total |
236,327 |
166,329 |
||||||
Total liabilities and equity |
360,943 |
222,678 |
||||||
The notes hereto form an integral part of these consolidated financial statements.
(1) See note 3C for additional details
F-5
CONSOLIDATED STATEMENT OF CHANGES IN EQUITY
For the years ended 30 June 2020, 2019 and 2018
Share capital £’000 |
Share premium £’000 |
Merger relief reserve £’000 |
Investment in own shares £’000 |
Retained earnings £’000 |
Capital redemption reserve £’000 |
Foreign exchange translation reserve £’000 |
Total £’000 |
|||||||||||||||||||||||
Balance at 30 June 2017 |
996 |
2,678 |
4,430 |
(2,275 |
) |
38,072 |
161 |
4,658 |
48,720 |
|||||||||||||||||||||
Equity-settled share-based payment transactions |
— |
— |
— |
— |
2,213 |
— |
— |
2,213 |
||||||||||||||||||||||
Transaction with owners |
— |
— |
— |
— |
2,213 |
— |
— |
2,213 |
||||||||||||||||||||||
Profit for the year |
— |
— |
— |
— |
18,975 |
— |
— |
18,975 |
||||||||||||||||||||||
Other comprehensive income |
— |
— |
— |
— |
— |
— |
(409 |
) |
(409 |
) |
||||||||||||||||||||
Total comprehensive income for the year |
— |
— |
— |
— |
18,975 |
— |
(409 |
) |
18,566 |
|||||||||||||||||||||
Balance at 30 June 2018 as previously reported |
996 |
2,678 |
4,430 |
(2,275 |
) |
59,260 |
161 |
4,249 |
69,499 |
|||||||||||||||||||||
Hyperinflation adjustment |
65 |
65 |
||||||||||||||||||||||||||||
Balance at 30 June 2018 as restated |
996 |
2,678 |
4,430 |
(2,275 |
) |
59,325 |
161 |
4,249 |
69,564 |
|||||||||||||||||||||
Equity-settled share-based payment transactions |
— |
— |
— |
— |
15,392 |
— |
— |
15,392 |
||||||||||||||||||||||
Cancellation of share premium |
— |
(48,614 |
) |
— |
— |
48,614 |
— |
— |
— |
|||||||||||||||||||||
Issuance of new shares |
65 |
45,936 |
— |
— |
— |
— |
— |
46,001 |
||||||||||||||||||||||
Issuance of shares related to acquisition (restated) (1)
|
23 |
— |
17,143 |
— |
— |
17,166 |
||||||||||||||||||||||||
Exercise of options |
5 |
128 |
— |
428 |
(428 |
) |
— |
— |
133 |
|||||||||||||||||||||
Hyperinflation adjustment |
— |
— |
— |
— |
53 |
— |
— |
53 |
||||||||||||||||||||||
Transaction with owners (restated) (1)
|
93 |
— |
(2,550 |
) |
— |
17,143 |
— |
428 |
— |
63,631 |
— |
— |
— |
— |
— |
78,745 |
||||||||||||||
Profit for the year |
— |
— |
— |
— |
24,007 |
— |
— |
24,007 |
||||||||||||||||||||||
Other comprehensive income (2)
|
— |
— |
— |
— |
— |
— |
(5,987 |
) |
(5,987 |
) |
||||||||||||||||||||
Total comprehensive income for the year |
— |
— |
— |
— |
— |
— |
— |
— |
24,007 |
— |
— |
— |
(5,987 |
) |
— |
18,020 |
||||||||||||||
Balance at 30 June 2019 (restated) (1)
|
1,089 |
— |
128 |
— |
21,573 |
— |
(1,847 |
) |
— |
146,963 |
— |
161 |
— |
(1,738 |
) |
— |
166,329 |
|||||||||||||
Equity-settled share-based payment transactions |
— |
— |
— |
— |
15,966 |
— |
— |
15,966 |
||||||||||||||||||||||
Issuance of shares related to acquisition |
2 |
— |
3,954 |
— |
— |
— |
— |
3,956 |
||||||||||||||||||||||
Sales of shares (EBT) |
— |
— |
— |
207 |
30,710 |
— |
— |
30,917 |
||||||||||||||||||||||
Exercise of options |
8 |
93 |
— |
299 |
(385 |
) |
— |
— |
15 |
|||||||||||||||||||||
Hyperinflation adjustment |
— |
— |
— |
— |
(26 |
) |
— |
— |
(26 |
) |
||||||||||||||||||||
Transaction with owners |
10 |
— |
93 |
— |
3,954 |
— |
506 |
— |
46,265 |
— |
— |
— |
— |
50,828 |
||||||||||||||||
Profit for the year |
— |
— |
— |
— |
21,410 |
— |
— |
21,410 |
||||||||||||||||||||||
Other comprehensive income |
— |
— |
— |
— |
— |
— |
(2,240 |
) |
(2,240 |
) |
||||||||||||||||||||
Total comprehensive income for the year |
— |
— |
— |
— |
— |
— |
— |
— |
21,410 |
— |
— |
(2,240 |
) |
— |
19,170 |
|||||||||||||||
Balance at 30 June 2020 |
1,099 |
221 |
25,527 |
(1,341 |
) |
214,638 |
161 |
(3,978 |
) |
236,327 |
||||||||||||||||||||
The notes hereto form an integral part of these consolidated financial statements. (1) See note 3C for additional details; (2) See note 14 for additional details.
F-6
CONSOLIDATED STATEMENT OF CASH FLOWS
For the years ended 30 June 2020, 2019 and 2018
Note |
2020 £’000 |
2019 £’000 |
2018 £’000 |
|||||||||||
Operating activities |
||||||||||||||
Profit for the year |
£ |
21,410 |
£ |
24,007 |
£ |
18,975 |
||||||||
Income tax charge |
3,846 |
6,093 |
5,675 |
|||||||||||
Non-cash adjustments |
28 |
28,622 |
21,390 |
6,249 |
||||||||||
Tax paid |
(5,876 |
) |
(5,904 |
) |
(5,608 |
) |
||||||||
UK research and development credit received |
— |
1,278 |
1,854 |
|||||||||||
Net changes in working capital |
28 |
(7,759 |
) |
(11,516 |
) |
6,839 |
||||||||
Net cash from operating activities |
40,243 |
35,348 |
33,984 |
|||||||||||
Investing activities |
||||||||||||||
Purchase of non-current assets (tangibles and intangibles) |
(9,880 |
) |
(7,383 |
) |
(5,483 |
) |
||||||||
Proceeds from disposal of non-current assets |
195 |
57 |
79 |
|||||||||||
Acquisition of business / subsidiaries, consideration in cash |
(26,595 |
) |
(3,201 |
) |
(28,765 |
) |
||||||||
Proceeds from sale of subsidiary net of cash disposed of |
2,744 |
— |
— |
|||||||||||
Cash and cash equivalents acquired with subsidiaries |
3,289 |
— |
2,342 |
|||||||||||
Interest received |
499 |
476 |
35 |
|||||||||||
Net cash used in investing activities |
(29,748 |
) |
(10,051 |
) |
(31,792 |
) |
||||||||
Financing activities |
||||||||||||||
Proceeds from borrowings |
— |
3,500 |
26,462 |
|||||||||||
Proceeds from sublease |
668 |
— |
— |
|||||||||||
Repayment of borrowings |
(956 |
) |
(23,547 |
) |
(36,768 |
) |
||||||||
Repayment of lease liabilities |
(9,903 |
) |
— |
— |
||||||||||
Grant received |
888 |
1,784 |
147 |
|||||||||||
Interest paid |
(829 |
) |
(343 |
) |
(573 |
) |
||||||||
Net proceeds from initial public offering |
— |
44,828 |
— |
|||||||||||
Proceeds from sale of shares |
30,917 |
— |
— |
|||||||||||
Proceeds from exercise of options |
93 |
133 |
— |
|||||||||||
Net cash from/(used in) financing activities |
20,878 |
26,355 |
(10,732 |
) |
||||||||||
Net change in cash and cash equivalents |
31,373 |
51,652 |
(8,540 |
) |
||||||||||
Cash and cash equivalents at the beginning of the year |
70,172 |
15,048 |
23,571 |
|||||||||||
Net foreign exchange differences |
(218 |
) |
3,472 |
17 |
||||||||||
Cash and cash equivalents at the end of the year |
£ |
101,327 |
£ |
70,172 |
£ |
15,048 |
||||||||
The notes hereto form an integral part of these consolidated financial statements.
F-7
NOTES TO CONSOLIDATED FINANCIAL STATEMENTS
1. |
General Information |
Reporting Entity
Endava plc (the “Company” and, together with its subsidiaries, the “Group” and each a “Group Entity”) is domiciled in London, United Kingdom. The address of the Company’s registered office is 125 Old Broad Street, London, EC2N 1AR. The Group’s expertise spans the entire ideation-to-production spectrum, creating value for our clients through creation of Product and Technology Strategies, Intelligent Digital Experiences, and World Class Engineering, delivered through our 24 capabilities, grouped into four key areas: Define, Design, Build and Run & Evolve.
These consolidated financial statements do not constitute the company's statutory accounts for the years ended 30 June 2020, 2019 or 2018.
2. |
Application Of New and Revised International Financial Reporting Standards (“IFRS”) |
The Group has applied the requirements of IFRS 16 ‘Leases’ from 1 July 2019. This has had a material impact on the financial statements, as further explained below.
A number of other new standards, interpretations and amendments to existing standards were also effective for the Group from 1 July 2019 but they do not have a material effect on the financial statements.
Due to the transition methods chosen by the Group in applying these standards, interpretations and amendments to existing standards, comparative information throughout these financial statements has not been restated to reflect the new requirements.
IFRS 16 - ‘Leases’
IFRS 16 replaces IAS 17 ‘Leases’ and related interpretations. The standard requires lessees to recognise right-of-use assets and lease liabilities for all leases meeting the lease definition set out by the standard unless certain exemptions are available. Accounting for lessors is largely unchanged.
The Group has adopted IFRS 16 using the modified retrospective basis of adoption with the date of initial application of 1 July 2019. Under this basis, the cumulative effect of initially applying the standard is applied as an adjustment to the opening balance of retained earnings as at 1 July 2019. Prior year comparatives have not been restated for the effect of IFRS 16 and are presented as historically disclosed under IAS 17.
The majority of the Group’s lease portfolio relates to property leases of offices and delivery centres. The Group also previously leased certain items of office equipment.
The Group previously classified leases as operating or finance leases based on its assessment of whether the lease transferred significantly all of the risks and rewards incidental to ownership of the underlying asset to the Group. Under IFRS 16, the Group recognises right-of-use assets and lease liabilities for all leases except for short-term leases and leases of low value assets.
Previously, the Group classified its property leases as operating leases under IAS 17. Leased property was not capitalised and the lease payments were recognised as rent expense in the statement of comprehensive income on a straight-line basis over the lease term. Any prepaid or accrued rent were recognised under prepayments and accruals, respectively.
On transition, for these leases, lease liabilities were measured at the present value of the remaining lease payments, discounted at an appropriate incremental borrowing rate as at 1 July 2019. Right-of-use assets were measured at an amount equal to the lease liability, adjusted by the amount of any prepayments or accruals relating to leases.
On transition, the Group elected not to reassess whether a contract is, or contains, a lease, instead relying on the assessment already made applying IAS 17 ‘Leases’ and IFRIC 4 ‘Determining whether an Arrangement contains a Lease’. In addition, the Group elected to use the following practical expedients and recognition exemptions available when applying IFRS 16 to leases previously classified as operating leases under IAS 17:
F-8
• |
the recognition exemption for lease contracts that, at their commencement date, have a lease term of 12 months or less and do not contain a purchase option (short-term leases); |
• |
accounting for leases ending within 12 months of the date of transition as short-term leases; |
• |
the recognition exemption for lease contracts for which the underlying asset value is of low value (low-value assets); |
• |
to use hindsight in determining the lease term where contracts contained options to extend or terminate the lease; |
• |
exclusion of initial direct costs from the measurement of the right-of-use asset recognised on initial adoption of the standard; |
• |
adjustment of the right-of-use asset on transition by the amount of any previously recognised onerous lease provision, as an alternative to performing an impairment review; and |
• |
where appropriate, arrangements containing both lease and non-lease components being accounted for as though they comprise a single-lease component. |
The Group also previously leased certain items of office equipment. These leases were classified as finance leases under IAS 17. The lease term of all such assets ended within 12 months of the date of initial application of IFRS 16, and therefore the Group did not recognise right-of-use assets in relation to these leases.
At transition, the Group did not have any arrangements in which it acted as a lessor.
Impact on financial statements
On transition to IFRS 16, the Group recognised additional right-of-use assets of £40.2 million, and additional lease liabilities of £40.2 million.
The impact on the Consolidated Balance Sheet on transition is summarised below.
30 June 2019 £’000 |
IFRS 16 impact £’000 |
1 July 2019 £’000 |
||||
Assets - Non current |
||||||
Right-of-use assets |
— |
40,222 |
40,222 |
|||
Assets - Current |
||||||
Prepayments |
5,734 |
(781 |
) |
4,953 |
||
Liabilities - Current |
||||||
Lease liabilities |
(21 |
) |
(8,625 |
) |
(8,646 |
) |
Accruals |
(33,326 |
) |
732 |
(32,594 |
) |
|
Liabilities - Non current |
||||||
Lease liabilities |
— |
(31,548 |
) |
(31,548 |
) |
|
The lease liability brought onto the balance sheet at transition of £40 million was measured by discounting the remaining lease payments using the incremental borrowing rate applicable to each lease at the date of initial application. The weighted average incremental borrowing rate applied was 2.75%.
The reconciliation of operating lease commitments disclosed at 30 June 2019 to lease liabilities recognised at 1 July 2019 is summarised below:
F-9
1 July 2019 £’000 |
||
Operating lease commitments disclosed as at 30 June 2019 |
58,473 |
|
Effect of discounting under the specific incremental borrowing rate |
(3,937 |
) |
Adjustment as a result of different treatment of extension options |
5,417 |
|
Short-term leases recognised as an expense on a straight-line basis |
(435 |
) |
Adjustment for leases contracted but not yet commenced |
(10,142 |
) |
Adjustment for service charges included in operating lease commitments, not included in lease liability under IFRS 16 |
(9,203 |
) |
Additional lease liabilities recognised as a result of IFRS 16 |
40,173 |
|
Existing finance leases |
21 |
|
Total lease liabilities recognised as at 1 July 2019 |
40,194 |
|
We have presented right-of-use assets and the current and non-current elements of lease liabilities on the face of the Consolidated Balance Sheet. Additionally, to support the additional lessee accounting disclosure requirements introduced by IFRS 16 we have added a dedicated note (note 23) which explains movements in the right-of-use assets during the year, along with other relevant disclosures.
There is no overall impact on the Group’s cash and cash equivalents, however the Consolidated Statement of Cash Flows has been revised to present the element of cash lease payments attributable to lease interest expense and the element attributable to repayment of lease liabilities within cash flows from financing activities.
New and amended accounting standards that have been issued but are not yet effective
The following new or amended standards and interpretations are applicable in future periods but are not expected to have a significant impact on the Group’s consolidated financial statements and related disclosures.
Effective for annual periods beginning on or after January 2020:
• |
Amendments to References to the Conceptual Framework in IFRS Standards |
• |
Amendments to IFRS 3: Definition of a Business |
• |
Amendments to IAS 1 and IAS 8: Definition of Material |
• |
Amendments to IFRS 9, IAS 39 and IFRS 7: Interest Rate Benchmark Reform |
Effective for annual periods beginning on or after June 2020:
• |
Amendments to IFRS 16: COVID 19-Related Rent Concessions |
Effective for annual periods beginning on or after January 2022:
• |
Amendments to IFRS 1, IFRS 9 and IAS 41: Annual Improvements to IFRS Standards 2018-2020 |
• |
Amendments to IFRS 3: Reference to the Conceptual Framework |
• |
Amendments to IAS 1: Classification of Liabilities as Current or Non-Current |
• |
Amendments to IAS 16: Property, Plant and Equipment: Proceeds before Intended Use |
• |
Amendments to IAS 37: Onerous Contracts - Cost of Fulfilling a Contract |
Effective for annual periods beginning on or after January 2023:
• |
IFRS 17 - Insurance Contracts |
F-10
3. |
Significant Accounting Policies |
A. |
Statement of Compliance |
The consolidated financial statements have been prepared in accordance with International Financial Reporting Standards (“IFRSs”) as issued by the International Accounting Standards Board (“IASB”) and which were in effect at 30 June 2020.
The consolidated financial statements were authorised for issue by the Board on 15 September 2020.
B. |
Basis of Preparation |
The consolidated financial statements have been prepared on a historical cost convention, except where IFRS requires or permits fair value measurement.
The principal accounting policies adopted by the Group in the preparation of the consolidated financial statements are set out below.
C. Restatement for reclassification of share premium to merger relief reserve
During 2020 fiscal year, following a review of the share premium account, the Directors have determined that share premium of £17,143,000, which arose during the year ended 30 June 2019 upon settlement of the contingent equity consideration for the acquisition of Velocity Partners, should have been classified as merger relief reserve. The impact of this restatement at 30 June 2019 is to decrease share premium by £17,143,000 to £128,000 with a corresponding increase to the merger relief reserve by £17,143,000 to £21,573,000. There is no impact on total equity, on profit or earnings per share in the current year or any earlier periods.
D. Functional and Presentation Currency
The consolidated financial statements are presented in British Pound Sterling (“Sterling”), which is the Company’s functional currency. All financial information presented in Sterling has been rounded to the nearest thousand, except when otherwise indicated.
E. Cost of Sales
The Group divides cost of sales into two categories: direct cost of sales and allocated cost of sales. Direct cost of sales consists primarily of personnel costs, including salary, bonuses, share-based compensation, benefits and travel expenses for the Group’s employees directly involved in delivery of the Group’s services, as well as software licenses and other costs that relate directly to the delivery of services. Allocated cost of sales consists of the portion of depreciation and amortisation expense and property costs related to delivery of the Group’s services.
F. Use of Estimates and Judgments
The preparation of consolidated financial statements in conformity with IFRS requires management to make judgments, estimates and assumptions that affect the application of accounting policies and the reported amounts for assets, liabilities, income and expenses. Actual result may differ from these estimates.
Estimates and underlying assumptions are reviewed on an ongoing basis. Revisions to accounting estimates are recognised in the period in which the estimates are revised and in any future periods affected.
The key areas involving estimates and judgments that have the most significant effect on the amounts recognised in the Consolidated Financial Statements, are as follows:
Business Combinations
Business acquisitions are accounted for using the acquisition method. The results of businesses acquired in a business combination are included in our consolidated financial statements from the date of the acquisition. Purchase accounting results in assets and liabilities of an acquired business being recorded at their estimated fair values on the
F-11
acquisition date. Any excess consideration over the fair value of assets acquired and liabilities assumed is recognised as goodwill.
We perform valuations of assets acquired and liabilities assumed on each acquisition accounted for as a business combination and allocate the purchase price to the tangible and intangible assets acquired and liabilities assumed based on our best estimate of fair value. In making these determinations, we are required to make estimates and assumptions that affect the recorded amounts, including future revenue growth, client attrition rates, and discount rates impacting the valuation of client relationship intangible assets. To assist us in making these fair value determinations, we may engage third party valuation specialists.
We determine the appropriate useful life of intangible assets by performing an analysis of cash flows based on historical experience of the acquired businesses. Intangible assets are amortised over their estimated useful lives based on the pattern in which the economic benefits associated with the asset are expected to be consumed, which to date has approximated the straight-line method of amortisation.
Any contingent consideration payable is measured at fair value at the acquisition date. If the contingent consideration is classified as equity, it is not re-measured and settlement is accounted for within equity. Otherwise, subsequent changes in the fair value of contingent consideration are recognised in profit and loss. At 30 June 2018, the Group held a financial liability measured at fair value of £11.3 million which was considered a major source of estimation uncertainty. During fiscal year ended 30 June 2019, the liability was settled through issuance of new shares, resulting in a fair value adjustment of £5.8 million. The valuation methodology, key assumptions and narrative sensitivity are disclosed in notes 15 and 21.
Transaction costs associated with business combinations are expensed as incurred and are included in selling, general and administrative expenses.
Other than contingent consideration as of 30 June 2018, there are no assumptions made about the future and other sources of estimation uncertainty at the balance sheet date that have a significant risk of resulting in a material adjustment to the carrying amounts of assets and liabilities acquired within the next financial year.
Further detailed information in relation to business combinations is included in note 15 to the financial statements.
Recoverability of trade and other receivables
We initially recognise trade and other receivables at fair value, which is usually the original invoiced amount. They are subsequently carried at amortised cost using the effective interest method. The carrying amount of these balances approximates to fair value due to the short maturity of amounts receivable.
Trade receivables are non-interest bearing and are generally on 30 to 90 day terms depending on the geographical territory in which sales are generated. We know that certain debts due to us may not be paid through the default of a small number of our customers. Accordingly, we recognise an expected credit loss allowance, which is deducted from the gross carrying amount of the receivable. The allowance is calculated by reference to credit losses expected to be incurred over the lifetime of the receivable. In estimating a loss allowance we consider historical experience and forward-looking informed credit assessment relating to customer specific trends and conditions alongside other factors such as the current state of the economy and particular industry issues. We consider reasonable and supportable information that is relevant and available without undue cost or effort. Due to the global financial uncertainty arising from the COVID-19 pandemic, management has considered the elevated credit risk on trade receivables. In addition, certain balances (where there was an objective evidence of credit impairment) have been provided for on an individual basis.
G. Going concern
The COVID-19 outbreak since early 2020, which has resulted in the implementation of travel restrictions, quarantines and extended shutdowns of certain businesses globally, has brought about additional uncertainties in the Group’s operating environment. The ongoing impact of COVID-19 has resulted in many countries around the world imposing lockdowns, shelter-in-place orders, quarantines, restrictions on travel and mass gatherings, including the
F-12
cancellation of trade shows and other events, and the extended shutdown of non-essential businesses that cannot be conducted remotely.
The Group has been closely monitoring the impact of the developments on its businesses, mainly because the continuous worsening of global business and economic conditions may impact the stability of operations and could have an adverse impact on the earnings of the Group. While there have been disruptions to manufacturing and supply chains around the world, the impact on the Group’s operations and liquidity has not been substantial. The Group continues to support our customers in keeping their supply chains running.
In accordance with IAS 1 ‘Presentation of financial statements’, and revised FRC guidance on ‘risk management, internal control and related financial and business reporting’, the Directors have considered the funding and liquidity position of the Group and have assessed the Group’s ability to continue as a going concern for the foreseeable future. In doing so, the Directors have reviewed the Group’s budget and forecasts, and have taken into account all available information about the future for a period of at least, but not limited to, 12 months from the date of approval of these financial statements.
The Group meets its day-to-day working capital requirements and medium-term funding requirements through its trading cash flows. At 30 June 2020, the Group had net assets of £236.3m and net current assets of £111.1m, of which £101.3m was cash and cash equivalents. In addition, the Group has a currently unused revolving credit facility (RCF) of £200m. The Directors remain satisfied with the Group’s funding and liquidity position.
In response to the risks outlined above, and its potential impact on the Group’s ability to continue as a going concern, the Directors have considered the business activities and the Group’s principal risks and uncertainties in the context of the current operating environment. This includes possible impacts of the global COVID-19 pandemic on the Group and reviews of liquidity and covenant forecasts. The potential financial impact of the COVID-19 pandemic has been modelled in our cash flow projections to produce a baseline forecast scenario. This baseline scenario reflects the current business disruption, deterioration in economic conditions and the resulting impact on customers and operations.
The Directors have also considered sensitivities in respect of potential downside scenarios over and above the baseline scenario, and the mitigating actions available in concluding that the Group is able to continue in operation for a period of at least 12 months from the date of approval of these financial statements. The specific scenarios modelled included a downside scenario with a U-shaped revenue impact from COVID-19 leading to three quarters of suppressed revenues followed by a gradual recovery, and a severe but plausible downside scenario with a broader U-shaped revenue impact leading to five quarters of suppressed revenues followed by a gradual recovery.
In the downside scenario, forecast revenue has been stressed by an extended period, reducing the baseline revenue forecast by 12%, with no reduction in the costs included in the baseline scenario. In this scenario our closing cash balance for the forecast period is reduced by £56m, but still remains positive at 30th June 2021 and 31st Dec 2021, and no draw-down from the RCF would be required.
In the severe but plausible downside scenario, forecast revenue has been stressed by a further extended period, reducing the baseline revenue forecast by 40%, and reducing baseline forecast cash by £87m. Again however, the resulting forecast cash position remains positive at 30th June 2021 and 31st Dec 2021, and no draw-down from the RCF would be required. This scenario also includes certain cost mitigation adjustments.
Our Q4 revenue in 2020 was £90.5m, which was a sequential decrease of 2% on our Q3 revenue of £92.2m. Q4 revenue was however, 5% and 10% higher than Q2 and Q1 respectively. This demonstrates that despite being in the COVID-19 lockdown environment during Q4, we were able to largely sustain revenue and we have a reasonable baseline which we expect to build on during fiscal 2021.
Throughout each of the scenarios considered, the Group’s cash position continues to remain strong throughout the forecast period. As noted above, the Group has an unused RCF of £200m, funded by a group of banks. On the basis of the Group’s existing cash reserves and projections, the Directors do not expect to need to draw down on the RCF in the foreseeable future, even in the most stressed scenario considered. Should a more extreme downside scenario occur, additional mitigating actions could be taken, such as reductions in other discretionary operating costs and non-committed capital expenditure.
F-13
Having considered the outcome of these assessments, the Directors consider that the Group has adequate resources to continue in operation for the foreseeable future, being at least 12 months from the date of approval of these financial statements, and accordingly continue to adopt the going concern basis in preparing the financial statements.
H. Basis of consolidation
The consolidated financial statements incorporate the financial statements of the Group and entities controlled by the Group made up to 30 June each year.
(i) Business combinations
Business acquisitions are accounted for using the acquisition method. The results of businesses acquired in a business combination are included in the consolidated financial statements from the date of the acquisition. Purchase accounting results in assets and liabilities of an acquired business being recorded at their estimated fair values on the acquisition date. Any excess consideration over the fair value of assets acquired and liabilities assumed is recognised as goodwill.
The Group performs valuations of assets acquired and liabilities assumed on each acquisition accounted for as a business combination and allocates the purchase price to the tangible and intangible assets acquired and liabilities assumed based on management’s best estimate of fair value. The Group determines the appropriate useful life of intangible assets by performing an analysis of cash flows based on historical experience of the acquired businesses. Intangible assets are amortised over their estimated useful lives based on the pattern in which the economic benefits associated with the asset are expected to be consumed, which to date has approximated the straight-line method of amortisation.
Any contingent consideration payable is measured at fair value at the acquisition date. If the contingent consideration is classified as equity, it is not re-measured and settlement is accounted for within equity. Otherwise, subsequent changes in the fair value of contingent consideration are recognised in statement of comprehensive income.
Transaction costs associated with business combinations are expensed as incurred and are included in selling, general and administrative expenses.
(ii) Subsidiaries
Subsidiaries are entities controlled by the Company. The financial statements of subsidiaries are included in the consolidated financial statements from the date that control commences until the date that control ceases.
(iii) Transactions eliminated on consolidation
All transactions and balances between Group Entities are eliminated on consolidation, including unrealised gains and losses on transactions between Group Entities. Where unrealised losses on intra-Group asset sales are reversed on consolidation, the underlying asset is also tested for impairment from a Group perspective.
I. Foreign Currency
(i) Foreign currency balances and transactions
Foreign currency transactions are translated into the functional currency of the applicable Group Entity, using the exchange rates prevailing at the dates of the transactions (spot exchange rate). Foreign exchange gains and losses resulting from the settlement of such transactions and from the re-measurement of monetary items denominated in foreign currency at period-end exchange rates are recognised in statement of comprehensive income. Non-monetary items are not retranslated at period-end and are measured at historical cost (translated using the exchange rates at the transaction date), except for non-monetary items measured at fair value which are translated using the exchange rates at the date when fair value was determined.
F-14
(ii) Foreign operations
In the consolidated financial statements, all assets, liabilities and transactions of Group Entities with a functional currency other than Sterling are translated into Sterling upon consolidation. The functional currency of the entities in the Group has remained unchanged during the reporting period.
On consolidation, assets and liabilities have been translated into Sterling at the closing rate at the reporting date. Goodwill and fair value adjustments arising on the acquisition of a foreign entity have been treated as assets and liabilities of the foreign entity and translated into Sterling at the closing rate. Income and expenses have been translated into Sterling at the average rate over the reporting period. Exchange differences are charged/credited to other comprehensive income and recognised in the currency translation reserve in equity. On disposal of a foreign operation, the related cumulative translation differences recognised in equity are reclassified to statement of comprehensive income and are recognised as part of the gain or loss on disposal.
Accounting standards are applied on the assumption that the value of money (the unit of measurement) is constant over time. However, when the rate of inflation is no longer negligible, a number of issues arise impacting the true and fair nature of the accounts of entities that prepare their financial statements on a historical cost basis. To address such issues, entities apply IAS 29 Financial Reporting in Hyperinflationary Economies from the beginning of the period in which the existence of hyperinflation is identified. Based on the statistics published in July 2018, the 3-year cumulative rate of inflation for consumer prices and wholesale prices in Argentina reached a level of about 123% and 119%, respectively. On that basis, Argentina was considered an hyperinflationary economy since July 1, 2018. As 30 June 2020 and 2019 the Company has recognised the effects of inflation in their financial statements. The Company also has a subsidiary in Venezuela that is considered a hyperinflationary economy but the functional currency of this company is the U.S. dollar.
J. Financial instruments
A financial instrument is any contract that gives rise to a financial asset of one entity and a financial liability or equity instrument of another entity.
(i) Financial Assets
Initial recognition and measurement
Financial assets are classified, at initial recognition, and subsequently measured at amortised cost, fair value through other comprehensive income (OCI), and fair value through profit or loss.
The classification of financial assets at initial recognition depends on the financial asset’s contractual cash flow characteristics and the Group’s business model for managing them. The Group initially measures a financial asset at its fair value plus, in the case of a financial asset not at fair value through profit or loss, transaction costs. Trade receivables that do not contain a significant financing component or for which the Group has applied the practical expedient are measured at the transaction price determined under IFRS 15.
In order for a financial asset to be classified and measured at amortised cost or fair value through OCI, it needs to give rise to cash flows that are ‘solely payments of principal and interest (SPPI)’ on the principal amount outstanding. This assessment is referred to as the SPPI test and is performed at an instrument level. Financial assets that are not SPPI are classified and measured at fair value through profit or loss, irrespective of the business model.
Subsequent measurement
For purposes of subsequent measurement, financial assets are classified in four categories:
• Financial assets at amortised cost (debt instruments)
• Financial assets at fair value through OCI with recycling of cumulative gains and losses (debt instruments)
• Financial assets designated at fair value through OCI with no recycling of cumulative gains and losses upon derecognition (equity instruments)
F-15
• Financial assets at fair value through profit or loss
Financial assets at amortised cost
The Group measures financial assets at amortised cost if both of the following conditions are met:
• The financial asset is held within a business model with the objective to hold financial assets in order to collect contractual cash flows; and
• The contractual terms of the financial asset give rise on specified dates to cash flows that are solely payments of principal and interest on the principal amount outstanding
Financial assets at amortised cost are subsequently measured using the effective interest (EIR) method and are subject to impairment. Gains and losses are recognised in profit or loss when the asset is derecognised, modified or impaired. The Group’s financial assets at amortised cost includes cash and cash equivalents, trade and substantially all other receivables.
Financial assets at fair value through OCI (debt instruments)
The Group measures debt instruments at fair value through OCI if both of the following conditions are met:
• The financial asset is held within a business model with the objective of both holding to collect contractual cash flows and selling; and
• The contractual terms of the financial asset give rise on specified dates to cash flows that are solely payments of principal and interest on the principal amount outstanding
For debt instruments at fair value through OCI, interest income, foreign exchange revaluation and impairment losses or reversals are recognised in the profit or loss and computed in the same manner as for financial assets measured at amortised cost. The remaining fair value changes are recognised in OCI. Upon derecognition, the cumulative fair value change recognised in OCI is recycled to profit or loss. The Group don’t hold any financial assets at fair value through OCI.
Financial assets designated at fair value through OCI (equity instruments)
Upon initial recognition, the Group can elect to classify irrevocably its equity investments as equity instruments designated at fair value through OCI when they meet the definition of equity under IAS 32 Financial Instruments: Presentation and are not held for trading. The classification is determined on an instrument-by-instrument basis.
Gains and losses on these financial assets are never recycled to profit or loss. The Group don’t hold any financial assets designated at fair value through OCI.
Financial assets at fair value through profit or loss
Financial assets at fair value through profit or loss include financial assets held for trading, financial assets designated upon initial recognition at fair value through profit or loss, or financial assets mandatorily required to be measured at fair value. Financial assets are classified as held for trading if they are acquired for the purpose of selling or repurchasing in the near term. Derivatives, including separated embedded derivatives, are also classified as held for trading unless they are designated as effective hedging instruments. Financial assets with cash flows that are not solely payments of principal and interest are classified and measured at fair value through profit or loss, irrespective of the business model. Notwithstanding the criteria for debt instruments to be classified at amortised cost or at fair value through OCI, as described above, debt instruments may be designated at fair value through profit or loss on initial recognition if doing so eliminates, or significantly reduces, an accounting mismatch.
Financial assets at fair value through profit or loss are carried in the balance sheet at fair value with net changes in fair value recognised in the statement of comprehensive income. The Group does not currently hold any financial assets at fair value through profit or loss.
F-16
Derecognition
A financial asset is primarily derecognised when:
• The rights to receive cash flows from the asset have expired; or
• The Group has transferred its rights to receive cash flows from the asset and either (a) the Group has transferred substantially all the risks and rewards of the asset, or (b) the Group has neither transferred nor retained substantially all the risks and rewards of the asset, but has transferred control of the asset.
(ii) Financial Liabilities
Initial recognition and measurement
Financial liabilities are classified, at initial recognition, as financial liabilities at fair value through profit or loss, loans and borrowings, payables, or as derivatives designated as hedging instruments in an effective hedge, as appropriate.
All financial liabilities are recognised initially at fair value and, in the case of loans and borrowings and payables, net of directly attributable transaction costs.
The Group’s financial liabilities include trade and other payables and loans and borrowings including bank overdrafts.
Subsequent measurement
The measurement of financial liabilities depends on their classification, as described below:
Financial liabilities at fair value through profit or loss
Financial liabilities at fair value through profit or loss include financial liabilities held for trading and financial liabilities designated upon initial recognition as at fair value through profit or loss.
Financial liabilities are classified as held for trading if they are incurred for the purpose of repurchasing in the near term. This category also includes derivative financial instruments entered into by the Group that are not designated as hedging instruments in hedge relationships as defined by IFRS 9.
Gains or losses on liabilities held for trading are recognised in the statement of profit or loss.
Financial liabilities designated upon initial recognition at fair value through profit or loss are designated at the initial date of recognition, and only if the criteria in IFRS 9 are satisfied. The Group has not designated any financial liability as at fair value through profit or loss.
Loans and borrowings
After initial recognition, interest-bearing loans and borrowings are subsequently measured at amortised cost using the EIR method. Gains and losses are recognised in profit or loss when the liabilities are derecognised as well as through the EIR amortisation process.
Amortised cost is calculated by taking into account any discount or premium on acquisition and fees or costs that are an integral part of the EIR. The EIR amortisation is included as finance costs in the statement of comprehensive income. This category applies to Group’s interest-bearing loans and borrowings.
iii) Offsetting of financial instruments
Financial assets and financial liabilities are offset and the net amount is reported in the consolidated statement of financial position if there is a currently enforceable legal right to offset the recognised amounts and there is an intention to settle on a net basis, to realise the assets and settle the liabilities simultaneously.
F-17
iv) Impairment
The Group recognises an allowance for expected credit losses (ECLs) for trade receivables and contract assets. The Group applies the simplified approach available in IFRS 9. The allowance is calculated by reference to credit losses expected to be incurred over the lifetime of the receivable. In estimating a loss allowance we consider historical experience and forward-looking informed credit assessment relating to customer specific trends and conditions alongside other factors such as the current state of the economy and particular industry issues. We consider reasonable and supportable information that is relevant and available without undue cost or effort. Due to the global financial uncertainty arising from the COVID-19 pandemic, management has considered the elevated credit risk on trade receivables. In addition, certain balances (where there was an objective evidence of credit impairment) have been provided for on an individual basis.
K. Property, plant and equipment
(i) Recognition and measurement
Items of property, plant and equipment are measured at cost less accumulated depreciation and accumulated impairment losses. Cost includes expenditure that is directly attributable to the acquisition of the asset. The cost of an item of property, plant and equipment comprises:
(a) its purchase price, including import duties and non-refundable purchase taxes, after deducting trade discounts and rebates;
(b) any costs directly attributable to bringing the asset to the location and condition necessary for it to be capable of operating in the manner intended by management; and
(c) the initial estimate of the costs of dismantling and removing the item and restoring the site on which it is located, the obligation for which an entity incurs either when the item is acquired or as a consequence of having used the item during a particular period for purposes other than to produce inventories during that period.
When parts of an item of property, plant and equipment have different useful lives, they are accounted for as separate items.
Any gain or loss on disposal of an item of property, plant and equipment (calculated as the difference between net proceeds from disposal and the carrying amount of the item) is recognised in the statement of comprehensive income.
(ii) Subsequent costs
Subsequent expenditure is capitalised only when it is probable that future economic benefits associated with the expenditure will flow to the Group. Ongoing repairs and maintenance are expensed as incurred.
(iii) Depreciation
Items of property, plant and equipment are depreciated on a straight-line basis in profit or loss over the estimated useful lives of each component. Leased assets are depreciated over the shorter of the leased term and their useful lives unless it is reasonably certain that the Group will obtain ownership by the end of the leased term. Land is not depreciated.
Items of property, plant and equipment are depreciated from the date they are installed and are ready for use, or in respect of internally constructed assets, from the date that the asset is completed and ready for use.
F-18
Depreciation is calculated so as to write off the cost of an asset, less its estimated residual value, over the useful economic life of that asset as follows:
Computers and equipment |
3 - 5 years |
Fixtures and fittings |
5 years |
Leasehold improvement fittings |
Over the lease term |
Motor vehicles |
5 years |
Depreciation methods, useful lives and residual values are reviewed at each reporting date and adjusted if appropriate.
L. Intangible assets and goodwill
(i) Goodwill
Goodwill represents the excess of the aggregate purchase price paid over the fair value of the net assets acquired in our business combinations. Goodwill is not amortised and is tested for impairment at least annually or whenever events or changes in circumstances indicate that the carrying value may not be recoverable. Intangible assets generated by new acquisitions are separately assessed for impairment in the year in which the acquisition occurred and are assessed on a consolidated basis with all other acquired intangible assets beginning in the year following the acquisition.
Events or changes in circumstances that could trigger an impairment review include a significant adverse change in business climate, an adverse action or assessment by a regulator, unanticipated competition, a loss of key personnel, significant changes in the manner of the Group’s use of the acquired assets or the strategy for the Group’s overall business, significant negative industry or economic trends, or significant underperformance relative to expected historical or projected future results of operations.
If the fair value of the reporting unit is less than book value, the carrying amount of the goodwill is compared to its recoverable amount. The estimate of recoverable amount may require valuations of certain internally generated and unrecognised intangible assets. If the carrying amount of goodwill exceeds the recoverable amount of that goodwill, an impairment loss is recognised in an amount equal to the excess. The Group tests for goodwill impairment on 30 June of each year.
(ii) Other intangible assets
Other intangible assets that are acquired by the Group and have finite useful lives are measured at cost less accumulated amortisation and accumulated impairment losses.
Other intangible assets that are acquired by the Group in a business combination and have finite useful lives are measured at fair value at acquisition date less accumulated amortisation and accumulated impairment losses.
(iii) Internally-generated intangible assets
Intangible assets arising from development are recognized if, and only if, all the following have been demonstrated:
- the technical feasibility of completing the intangible asset so that it will be available for use or sale;
- the intention to complete the intangible asset and use or sell it;
- the ability to use or sell the intangible asset;
- how the intangible asset will generate probable future economic benefits;
- the ability of adequate technical, financial and other resources to complete the development and to use or sell the intangible asset, and
F-19
- the ability to measure reliably the expenditure attributable to the intangible asset during its development.
The amount initially recognized for internally-generated assets is the sum of expenditure incurred from the date when the intangible asset first meets the recognition criteria listed above. Where no internally-generated intangible asset can be recognized, development expenditure is recognized in profit or loss in the period in which it is incurred. Subsequent to initial recognition, intangible assets are reported at cost less accumulated amortization and accumulated impairment losses, on the same basis as intangible assets that are acquired separately.
(iv) Subsequent expenditure
Subsequent expenditure is only capitalised when it increases the future economic benefits embodied in the specific asset to which is relates. All other expenditure, including expenditure on internally generated goodwill and brands, is recognised in the statement of comprehensive income as incurred.
(v) Amortisation
Except for goodwill, intangible assets are amortised on a straight-line basis in the statement of comprehensive income over their estimated useful lives, from the date they are available for use.
Client relationship |
5 - 10 years |
Trade name |
5 years |
Supplier relationships |
5 years |
Non-compete agreement |
3 years |
Computer software |
3 - 10 years |
Licences |
Shorter of licence period and up to 3 years |
Software - own work capitalised |
3 - 5 years |
M. Lease agreements
The Group has applied IFRS 16 using the modified retrospective approach and therefore the comparative information has not been restated and continues to be reported under IAS 17 and IFRIC 4. The details of accounting policies under IAS 17 and IFRIC 4 are disclosed separately.
Policy applicable from 1 July 2019
The Group assesses whether a contract is, or contains, a lease at the inception of a contract. A contract is, or contains, a lease if the contract conveys the right to control the use of an identified asset for a period of time in exchange for consideration. To assess whether a contract conveys the right to control the use of an identified asset, the Group uses the definition of a lease in IFRS 16.
This policy is applied to contracts entered into, on or after 1 July 2019.
The Group as a lessee
The Group recognises a right-of-use asset and a lease liability at the lease commencement date with respect to all lease arrangements except for short-term leases (leases with a lease term of 12 months or less) and leases of low value assets. For these leases, the lease payments are recognised as an operating expense on a straight-line basis over the term of the lease.
As the majority of the Group’s lease portfolio relates to property leases of offices and delivery centres, the Group has elected not to separate non-lease components and therefore accounts for the lease and non-lease component as a single lease component.
Right-of-use assets are initially measured at cost, comprising the initial amount of the corresponding lease liability, adjusted for any lease payments made at or before the commencement date, plus any initial direct costs incurred, and
F-20
an estimate of costs to dismantle and remove the underlying asset or to restore the underlying asset or the site on which it is located, less any lease incentives received.
Right-of-use assets are subsequently depreciated using the straight-line method from the commencement date to the end of the lease term, unless the lease transfers ownership of the underlying asset to the Group by the end of the lease term or the cost of the right-of-use asset reflects that the Group will exercise a purchase option. In that case, the right-of-use asset will be depreciated over the useful life of the underlying asset, which is determined on the same basis as those of property and equipment. In addition, right-of-use assets are adjusted for any remeasurement of lease liabilities. Right-of-use assets are reviewed for impairment when events or changes in circumstances indicate the carrying value may not be fully recoverable.
Lease liabilities are initially measured at the present value of the lease payments that are due over the lease term, which have not been paid at the commencement date, discounted using the interest rate implicit in the lease or, if that rate cannot be readily determined, the incremental borrowing rate applicable to each lease. This is the rate that the Group would have to pay for a loan of a similar term, and with a similar security, to obtain an asset of a similar value.
The Group calculates the incremental borrowing rate applicable to each lease by obtaining information from various external sources in relation to interest rates and credit risk and makes certain adjustments to reflect the terms of the lease, the type of asset leased, the country and currency of the lease.
Lease payments included in the measurement of the lease liability comprise the following:
• |
fixed payments, including in-substance fixed payments, less any lease incentives receivable; |
• |
variable lease payments that depend on an index or a rate, initially measured using the index or rate as at the commencement date; |
• |
amounts expected to be paid under residual value guarantees; |
• |
the exercise price of any purchase options that are reasonably certain to be exercised; |
• |
payments due over optional renewal periods that are reasonably certain to be exercised; and |
• |
penalties for early termination of a lease where we are reasonably certain to terminate early. |
Any variable lease payments that do not depend on an index or a rate are recognised as an expense in the period in which the event or condition that triggers the payment occurs.
Lease liabilities are subsequently measured at amortised cost using the effective interest method. Lease liabilities are remeasured if there is a modification, a change in future lease payments due to a renegotiation or market rent review or a change of an index or rate, or the amount expected to be payable under a residual guarantee, or if we change our assessment of whether we will exercise a purchase, renewal or termination option. When a lease liability is remeasured, a corresponding adjustment is made to the related right-of-use asset.
The Group determines the lease term as the non-cancellable term of the lease, together with any periods covered by an option to extend the lease if it is reasonably certain to be exercised, or any periods covered by an option to terminate the lease, if it is reasonably certain not to be exercised.
The Group presents right-of-use assets and lease liabilities as separate line items on the face of the balance sheet.
The Group as a lessor
When the Group acts as a lessor, it determines at lease inception whether each lease is a finance lease or an operating lease. To classify each lease, the Group makes an overall assessment of whether the lease transfers substantially all of the risks and rewards incidental to ownership of the underlying asset. If this is the case, then the lease is a finance lease; if not then it is an operating lease. As part of this assessment, the Group considers certain indicators such as whether the lease is for the major part of the economic life of the asset.
F-21
When the Group is an intermediate lessor, the head-lease and sub-lease are accounted for as two separate contracts. The head lease is accounted for as per the lessee policy above. The sub-lease is classified as a finance lease or operating lease by reference to the right-of-use asset arising from the head lease. Where the lease transfers substantially all the risks and rewards of ownership to the lessee the contract is classified as a finance lease; all other leases are classified as operating leases. If an arrangement contains lease and non-lease components, the Group applies IFRS 15 to allocate the consideration in the contract.
Rental income from operating leases is recognised on a straight-line basis over the term of the relevant lease. Amounts due from lessees under finance sub-leases are recognised as receivables at the amount of the Group’s net investment in the leases, discounted using the interest rate implicit in the lease or, if that rate cannot be readily determined, the discount rate used in the head lease.
Policy applicable before 1 July 2019
Finance lease agreements
Where the Group enters into a lease that entails taking substantially all the risks and rewards of ownership of an asset, the lease is treated as a finance lease. The asset is recorded in the balance sheet as property, plant and equipment and is depreciated in accordance with the above depreciation policies. Future instalments under such leases, net of finance charges, are included within borrowings. Rentals payable are apportioned between the finance element, which is charged to the statement of comprehensive income on a straight-line basis, and the capital element which reduces the outstanding obligation for future instalments.
Operating lease agreements
Rental payments applicable to operating leases where substantially all of the benefits and risks of ownership remain with the lessor are charged to the statement of comprehensive income on a straight-line basis over the period of the lease.
Lease incentives (such as rent-free periods or contributions by the lessor to the lessee’s relocation costs) are considered an integral part of the consideration for the use of the leased asset. Incentives are treated as a reduction of lease income or lease expense. As they are an integral part of the net consideration agreed for the use of the leased asset, incentives are recognised by both the lessor and the lessee over the lease term, with each party using a single amortisation method applied to the net consideration.
Lease payments
Minimum lease payments made under finance leases are apportioned between the finance expense and the reduction of the outstanding liability. The finance expense is allocated to each period during the lease term so as to produce a constant periodic rate of interest on the remaining balance of the liability.
Determining whether an arrangement contains a lease
At the inception of an arrangement, the Group determines whether such an arrangement is or contains a lease. This will be the case if the following two criteria are met:
• |
The fulfilment of the arrangement is dependent on the use of a specific asset or assets; and |
• |
The arrangement contains the right to use the asset(s). |
N. Impairment
(i) Non-financial assets
The carrying amounts of the Group’s non-financial assets, other than deferred tax assets, are reviewed at each reporting period to determine whether there is any indication of impairment. Goodwill and indefinite-lived intangible assets are tested at least annually for impairment.
F-22
For impairment assessment purposes, non-financial assets are grouped at the lowest levels for which there are largely independent cash inflows (cash generating units). As a result, some assets are tested individually for impairment and some are tested at cash-generating unit level. Goodwill is allocated to those cash-generating units that are expected to benefit from synergies of the related business combination and represent the lowest level within the Group at which management monitors goodwill.
Cash-generating units to which goodwill has been allocated (determined by the Group’s management as equivalent to its operating segments) are tested for impairment at least annually. All other individual assets or cash-generating units are tested for impairment whenever events or changes in circumstances indicate that the carrying amount may not be recoverable. An impairment loss is recognised for the amount by which the asset or cash-generating unit’s carrying amount exceeds its recoverable amount, which is the higher of fair value less costs to sell and value-in use.
To determine the value-in-use, management estimates expected future cash flows from each cash generating unit and determines a suitable discount rate in order to calculate the present value of those cash flows. The data used for impairment testing procedures are directly linked to the Group’s latest approved budget, adjusted as necessary to exclude the effects of future reorganisations and asset enhancements. Discount factors are determined individually for each cash-generating unit and reflect management’s assessment of respective risk profiles, such as market and asset-specific risks factors. Impairment losses for cash-generating units reduce first the carrying amount of any goodwill allocated to that cash-generating unit. Any remaining impairment loss is charged pro rata to the other assets in the cash-generating unit. With the exception of goodwill, all assets are subsequently reassessed for indications that an impairment loss previously recognised may no longer exist. An impairment charge is reversed if the cash-generating unit’s recoverable amount exceeds its carrying amount.
(ii) Non-derivative financial assets
A financial asset not classified as at fair value to profit and loss is assessed at each reporting date to determine whether there is objective evidence that it is impaired. A financial asset is impaired if there is objective evidence of impairment as a result of one or more events that occurred after the initial recognition of the asset, and that loss event(s) had an impact on the estimated future cash flows of the asset that can be estimated reliably.
Objective evidence that financial assets are impaired includes default or delinquency by a debtor, restructuring of an amount due to the Group on terms that the Group would not consider otherwise, indications that a debtor or issuer will enter bankruptcy, adverse changes in the payment status of borrowers or issuers, economic conditions that correlate with defaults or the disappearance of an active market for a security. In addition, for an investment in an equity security, a significant or prolonged decline in its fair value below its cost is objective evidence of impairment.
O. Employee benefits
(i) Termination benefits
Termination benefits are recognised as an expense when the Group is demonstrably committed, without realistic probability of withdrawal, to a formal detailed plan to either terminate employment before retirement date, or to provide termination benefits as a result of an offer made to encourage voluntary redundancy. Termination benefits of voluntary redundancies are recognised as an expense if the Group has made an offer to voluntary redundancy, it is probable that the offer will be accepted, and the number of acceptances can be estimated reliably. If the benefits are payable more than 12 months after the reporting date, then they are discounted to their present value.
(ii) Short-term employee benefits
Short-term employee benefit obligations are measured at an undiscounted basis and are expensed as the related service is provided. A liability is recognised for the amount expected to be paid under short-term cash bonus or profit-sharing plans if the Group has a present legal or constructive obligation to pay this amount as a result of past service provided by the employee, and the obligation can be estimated reliably.
The Group operates a defined contribution pension scheme for employees. The assets of the scheme are held separately from those of the Group. The annual contributions payable are charged to the statement of comprehensive income.
F-23
(iii) Employee benefit trust
All assets and liabilities of the Endava Limited Guernsey Employee Benefit Trust (“the EBT”) have been consolidated in the consolidated financial statements as the Group has de facto control over the EBT’s net assets. Any assets held by the EBT cease to be recognised on the Consolidated Balance Sheet when the assets vest unconditionally in identified beneficiaries.
The costs of purchasing own shares held by the EBT are shown as a deduction against equity of the Group. The proceeds from the sale of own shares held by the EBT increases shareholders’ funds. Neither the purchase nor sale of own shares leads to a gain or loss being recognised in the Group’s statement of comprehensive income.
(iv) Employee share schemes and share based payments
The Group issues equity settled share options to its employees. The payments are measured at fair value at date of grant. The fair value of the share options issued is expensed to the statement of comprehensive income account on a straight line basis over the vesting period, based on the Group's estimate of the number of options that will eventually vest, updated at each balance sheet date.
P. Revenue
The Group generates revenue primarily from the provision of its services and recognise revenue in accordance with IFRS 15 – “Revenue from Contracts with Customers.” Revenue is measured at fair value of the consideration received, excluding discounts, rebates, taxes and duties. The Group’s services are generally performed under time-and-material based contracts (where materials consist of travel and out-of-pocket expenses), fixed-price contracts and managed service contracts.
Under time-and-materials based contracts, the Group charges for services based on daily or hourly rates and bills and collects monthly in arrears. Revenue from time-and-materials contracts is recognised as services are performed, with the corresponding cost of providing those services reflected as cost of sales when incurred.
Under fixed-price contracts, the Group bills and collects monthly throughout the period of performance. Revenue is recognised in the accounting periods in which the associated services are rendered. In instances where final acceptance of a deliverable is specified by the client and there is risk or uncertainty of acceptance, revenue is deferred until all acceptance criteria have been met. The cumulative impact of any revision in estimates is reflected in the financial reporting period in which the change in estimate becomes known.
Under managed service contracts, the Group typically bills and collects upon executing the applicable contract and typically recognises revenue over the service period on a straight-line basis. Certain of the Group’s managed service contracts contain service-level commitments regarding availability, responsiveness, security, incident response and/or fulfilment of service and change requests. To the extent the Group has an uncertainty regarding its ability to comply with a service-level commitment, recognition of revenue related to the applicable contract would be deferred until the uncertainty is resolved and revenue recognised would be restricted to the extent of any provision made for potential damages or service-level credits. Further, to the extent the Group believes that it is probable that an outflow of resources may be required to address non-compliance with a service-level commitment, a provision would be made to cover the expected cost.
The Group accounts for a contract when it has approval and commitment from both parties, the rights of the parties are identified, payment terms are identified, the contract has commercial substance and collectability of consideration is probable. The Group identifies its distinct performance obligations under each contract. A performance obligation is a promise in a contract to transfer a distinct product or service to the customer. The transaction price is the amount of consideration to which the Group expects to be entitled in exchange for transferring products or services to a customer. With respect to all types of contracts, revenue is only recognised when the performance obligations are satisfied and the control of the services is transferred to the customer, either over time or at a point in time, at an amount that reflects the consideration to which the Group expects to be entitled in exchange for those services. Consideration from contracts with customers is allocated to the performance obligations identified based on their relative standalone selling price which is generally directly observable from sales to similarly situated clients. The Group also considers whether there
F-24
are other promises in the contract that are separate performance obligations to which a portion of the transaction price needs to be allocated. The Group has concluded that it is the principal in its revenue arrangements because it typically controls the services before transferring them to the customer. Anticipated profit margins on contracts are reviewed monthly by the Group and, should it be deemed probable that a contract will be unprofitable, any foreseeable loss would be immediately recognised in full and provision would be made to cover the lower of the cost of fulfilling the contact and the cost of exiting the contract.
Q. Government grants
Government grants are assistance by government in the form of transfers of resources to the Group in return for past or future compliance with certain conditions relating to the operating activities of the Group. They exclude those forms of government assistance that cannot reasonably have a value placed upon them and transactions with government that cannot be distinguished from the normal trading transactions of the entity. Government grants are accounted for using the income approach under which they are recognised in the statement of comprehensive income on a systematic basis over the periods in which the Group recognises as expenses the related costs for which the grants are intended to compensate.
Following IAS 20 presentation options, the Group presents the grant related to income as a deduction from the related expense.
R. Finance income and finance expense
Finance expense consists primarily of interest expense on borrowings and leases, running costs related to the Company’s revolving credit facility and unwinding of the discount on acquisition holdbacks and contingent consideration. Borrowing costs that are not directly attributable to the acquisition, construction or production of a qualifying asset are recognised in the statement of comprehensive income using the effective interest method. Finance income consists of interest income on funds invested. Interest income is recognised as it accrues in the statement of comprehensive income, using the effective interest method.
Finance income and finance costs also reflect the net effect of realised and unrealised foreign currency exchange gains and losses.
S. Income taxes
Tax expense recognised in the statement of comprehensive income comprises the sum of deferred tax and current tax not recognised in other comprehensive income or directly in equity.
Current income tax assets and/or liabilities comprise those obligations to, or claims from, fiscal authorities relating to the current or prior reporting periods, that are unpaid at the reporting date. Current tax is payable on taxable profit, which differs from profit or loss in the financial statements. Calculation of current tax is based on tax rates and tax laws that have been enacted or substantively enacted by the end of the reporting period.
Amounts receivable in respect of research and development tax credits are recognised in the financial statements in the year in which the related expenditure was incurred, provided there is sufficient evidence that these amounts are recoverable. These credits are recognised within cost of sales in the group statement of comprehensive income.
Deferred income taxes are calculated using the liability method on temporary differences between the carrying amounts of assets and liabilities and their tax bases. However, deferred tax is not provided on the initial recognition of goodwill, or on the initial recognition of an asset or liability unless the related transaction is a business combination or affects tax or accounting profit. Deferred tax on temporary differences associated with investments in subsidiaries is not provided if reversal of these temporary differences can be controlled by the Group and it is probable that reversal will not occur in the foreseeable future.
Deferred tax assets and liabilities are calculated, without discounting, at tax rates that are expected to apply to their respective periods of realisation, provided they are enacted or substantively enacted by the end of the reporting period. Deferred tax assets are recognised to the extent that it is probable that they will be able to be utilised against future taxable income, based on the Group’s forecast of future operating results which is adjusted for significant non-taxable
F-25
income and expenses and specific limits to the use of any unused tax loss or credit. Deferred tax liabilities are always provided for in full.
Deferred tax assets and liabilities are offset only when the Group has a right and intention to set off current tax assets and liabilities from the same taxation authority.
Changes in deferred tax assets or liabilities are recognised as a component of tax income or expense in the statement of comprehensive income, except where they relate to items that are recognised in other comprehensive income or directly in equity, in which case the related deferred tax is also recognised in other comprehensive income or equity, respectively.
T. Cash and cash equivalents
Cash and cash equivalents comprise cash on hand and demand deposits, together with other short-term, highly liquid investments that are readily convertible into known amounts of cash and that are subject to an insignificant risk of changes in value.
U. Equity, reserves and dividend payments
Share capital represents the nominal value of shares that have been issued.
Share premium includes any premiums received on issue of share capital. Any transaction costs associated with the issuing of shares are deducted from share premium, net of any related income tax benefits.
Other components of equity include the following:
• |
Translation reserve comprises foreign currency translation differences arising from the translation of financial statements of the group’s foreign entities into Sterling; |
• |
Capital redemption reserve is created to maintain the statutory capital maintenance requirements of the Companies Act 2006; |
• |
Merger relief reserve balance represents the fair value of the consideration given in excess of the nominal value of the ordinary shares issued in a business combination; and |
• |
Retained earnings include all current and prior period retained profits. |
All transactions with equity shareholders of the Company are recorded separately within equity. Dividend distributions payable to equity shareholders of the Company are included in other liabilities when the dividends have been approved in a general meeting prior to the reporting date.
Investment in own shares represents shares held by the EBT.
The Group presents basic and diluted earnings per share (“EPS”) data for its ordinary shares. Basic EPS is calculated by dividing the profit or loss attributable to ordinary shareholders of the Company by the weighted average number of ordinary shares outstanding during the year. Diluted EPS is determined by dividing the profit or loss attributable to equity holders of the Company, adjusted by fair value movement of financial liabilities and the weighted average number of ordinary shares outstanding for the effects of all dilutive potential ordinary shares, which include awards under share award schemes and share options granted to employees.
V. Share split
On 6 July 2018, the Company completed a five for one share split of each class of ordinary shares. This share split has been reflected in the financial statements impacting earnings per share calculations and disclosures regarding the number of ordinary shares. This is reflected in Notes 13, 24, 26 and 27 of these financial statements.
F-26
4. |
Operating Segment Analysis |
Operating segments are components of an enterprise about which separate financial information is available that is evaluated regularly by the chief operating decision-maker (“CODM”) in deciding on how to allocate resources and in assessing performance. The Company’s CODM is considered to be the Company’s chief executive officer (“CEO”). The CEO reviews financial information presented on a Group level basis for purposes of making operating decisions and assessing financial performance. Therefore, the Group has determined that it operates in a single operating and reportable segment.
Major Customer
Worldpay (UK) Limited, or together with Worldpay Group Limited and its consolidated subsidiaries, Worldpay, was our largest client for each of the last three years, contributing less than 10.0% in both 2020 and 2019 and 10.8% in 2018 of our total revenue.
Geographical Information of Group’s Non-Current Assets
Geographical information about the Group's non-current assets (excluding deferred tax asset) is based on locations where the assets are accumulated:
2020 £’000 |
2019 £’000 |
||||||
United Kingdom |
£ |
38,284 |
£ |
26,436 |
|||
North America |
28,321 |
29,248 |
|||||
Europe |
30,491 |
6,779 |
|||||
RoW (1)
|
11,287 |
13,786 |
|||||
Total |
£ |
108,383 |
£ |
76,249 |
|||
5. |
Revenue |
Set out below is the disaggregation of the Group’s revenue from contracts with customers by geographical market, based on where the service is being delivered to:
(1) Rest of World (RoW) is a new geography highlighted in fiscal year ended June 30, 2020. In previous years, clients located in RoW were immaterial.
2020 £’000 |
2019 £’000 |
2018 £’000 |
|||||||||
United Kingdom |
£ |
155,507 |
£ |
129,513 |
£ |
98,571 |
|||||
North America |
100,089 |
79,231 |
45,600 |
||||||||
Europe |
85,882 |
79,186 |
73,442 |
||||||||
RoW(1)
|
£ |
9,472 |
£ |
— |
£ |
— |
|||||
Total |
£ |
350,950 |
£ |
287,930 |
£ |
217,613 |
|||||
The Group’s revenue by industry sector is as follows:
2020 £’000 |
2019 £’000 |
2018 £’000 |
|||||||||
Payments and Financial Services |
£ |
185,175 |
£ |
152,179 |
£ |
123,675 |
|||||
TMT |
90,255 |
78,888 |
61,095 |
||||||||
Other |
75,520 |
56,863 |
32,843 |
||||||||
Total |
£ |
350,950 |
£ |
287,930 |
£ |
217,613 |
|||||
F-27
The Group’s revenue by contract type is as follows:
|
2020
£’000
|
2019
£’000
|
2018
£’000
|
|||||||||
Time and materials contracts |
£ |
305,766 |
n/a* |
n/a* |
|||||||
Fixed price contracts |
45,184 |
n/a* |
n/a* |
||||||||
Total |
£ |
350,950 |
£ |
287,930 |
£ |
217,613 |
|||||
* A comparable breakdown of revenue by contract type is not available for previous financial years, due to internal billing systems changes that were implemented in the 2019 fiscal year.
As at 30 June 2020, the aggregate transaction value of revenue that has not been recognised relating to unsatisfied, or partially satisfied, performance obligations was £61 million. This relates to fixed price contracts with forward contractual commitments.This revenue is expected to be recognised over the following time periods:
|
£’000
|
|||
Less than 1 year |
£ |
28,405 |
|
1 to 2 years |
16,917 |
||
2 to 3 years |
11,040 |
||
More than 3 years |
4,228 |
||
Total |
£ |
60,590 |
|
Revenue recognised in the fiscal 2020 year relating to performance obligations that were satisfied, or partially satisfied, in previous years was not material.
F-28
6. |
Operating Profit |
2020 £’000 |
2019 £’000 |
2018 £’000 |
||||||
Operating profit is stated after charging/(crediting): |
||||||||
Depreciation of owned property, plant and equipment |
4,795 |
3,969 |
3,266 |
|||||
Depreciation of assets held under finance leases |
21 |
34 |
72 |
|||||
Depreciation of right-of-use assets |
9,072 |
— |
— |
|||||
Impairment of non-current assets (tangibles and intangibles) |
— |
— |
19 |
|||||
Amortisation of intangible assets |
4,837 |
3,897 |
2,912 |
|||||
Net gain on disposal of property, plant and equipment |
(11 |
) |
(23 |
) |
(5 |
) |
||
Net gain on disposal of right-of-use asset |
(23 |
) |
— |
— |
||||
Net gain on disposal of subsidiary |
(2,215 |
) |
— |
— |
||||
Gain on derecognition of right-of-use assets sub-leased |
(472 |
) |
— |
— |
||||
Research and development expenditure credit |
(1,600 |
) |
(1,278 |
) |
(1,008 |
) |
||
Government grants |
(670 |
) |
(819 |
) |
(1,633 |
) |
||
Share-based compensation |
15,663 |
12,022 |
1,505 |
|||||
Discretionary EBT bonus |
27,874 |
— |
— |
|||||
Expected credit loss allowance on trade receivables |
3,169 |
8 |
437 |
|||||
Initial public offering expenses |
— |
1,055 |
4,537 |
|||||
Sarbanes-Oxley compliance readiness expenses |
— |
1,440 |
106 |
|||||
Secondary offering expenses |
— |
1,009 |
— |
|||||
Operating lease costs: |
||||||||
Land and buildings |
1,053 |
9,941 |
8,444 |
|||||
Initial public offering expenses include professional fees incurred in the Group’s initial public offering of the Company’s ordinary shares. Sarbanes-Oxley compliance readiness expenses include professional fees incurred in the Group’s compliance with Sarbanes Oxley Act of 2002. Secondary offering expenses include professional fees incurred in the Group’s secondary public offering of the Company’s ordinary shares.
Operating lease costs for the year ended 30 June 2020 include short-term lease rent (not in scope for IFRS 16), property taxes and other property related costs.
Disposal of Endava Technology SRL (“the Captive”)
Pursuant to an agreement entered into with Worldpay in November 2016, Endava granted Worldpay an option to acquire a captive Romanian subsidiary that Endava created and staffed for Worldpay. On June 1, 2019, Endava entered into an agreement to sell the Captive to Worldpay and to terminate the option and transfer agreement. On August 31, 2019 the transaction was completed and the employees of the Captive became employees of Worldpay. Endava has agreed to provide Worldpay certain transition services under a Transition Services Agreement between Endava and Worldpay, which remains in place following the closing of the sale of the Captive. The aggregate selling price of the Captive was £3.6 million and the Group recognised a gain on disposal of subsidiary of £2.2 million.
F-29
Auditor’s remuneration:
The Group recognised the following fees from its auditors in respect of the audit of the financial statements and for other services provided to the Group:
2020 £’000 |
2019 £’000 |
2018 £’000 |
|||||||||
Audit of the financial statements |
£ |
840 |
£ |
741 |
£ |
437 |
|||||
Subsidiary local statutory audits |
103 |
95 |
85 |
||||||||
SOX attestation fees |
832 |
— |
— |
||||||||
Total audit fees |
1,775 |
836 |
522 |
||||||||
Initial public offering expenses |
— |
— |
655 |
||||||||
Secondary offering expenses |
— |
150 |
— |
||||||||
Other SEC filings review expenses |
— |
36 |
— |
||||||||
Total audit related fees |
— |
186 |
655 |
||||||||
Total auditor’s remuneration |
£ |
1,775 |
£ |
1,022 |
£ |
1,177 |
|||||
7. |
Particulars of Employees (including Directors) |
2020 No. |
2019 No. |
2018 No. |
|||||||||
Average number of staff employed by the group during the year (including directors): |
|||||||||||
Number of operational staff |
5,633 |
4,902 |
3,957 |
||||||||
Number of administrative staff |
601 |
503 |
373 |
||||||||
Number of management staff |
8 |
7 |
7 |
||||||||
Total |
6,242 |
5,412 |
4,337 |
||||||||
2020 £’000 |
2019 £’000 |
2018 £’000 |
|||||||||
Aggregate payroll costs of the above were: |
|||||||||||
Wages and salaries |
£ |
222,918 |
£ |
163,399 |
£ |
122,166 |
|||||
Social security and pension costs |
16,288 |
13,767 |
15,336 |
||||||||
Share-based compensation |
15,663 |
12,022 |
1,505 |
||||||||
Total |
£ |
254,869 |
£ |
189,188 |
£ |
139,007 |
|||||
F-30
8. |
Key Management Remuneration |
The compensation of the members of our Board of Directors was:
2020 £’000 |
2019 £’000 |
2018 £’000 |
|||||||||
Remuneration paid |
£ |
1,405 |
£ |
1,281 |
£ |
1,204 |
|||||
Company contribution to pension scheme |
71 |
65 |
50 |
||||||||
Share-based compensation |
1,731 |
1,164 |
107 |
||||||||
Total |
£ |
3,207 |
£ |
2,510 |
£ |
1,361 |
|||||
Emoluments of highest paid director: |
|||||||||||
Remuneration paid |
£ |
694 |
£ |
620 |
£ |
589 |
|||||
Company contributions to pension scheme |
53 |
47 |
34 |
||||||||
Share-based compensation |
970 |
501 |
25 |
||||||||
Total |
£ |
1,717 |
£ |
1,168 |
£ |
648 |
|||||
There were 2 directors who were members of a pension scheme during the year (2019: 2; 2018: 2).
The highest paid director exercised 22,500 options during the year (2019: 654,195, 2018: nil) and was granted 55,788 options under a long-term incentive plan (2019: 90,000; 2018: nil).
9. |
Finance Expense |
2020 £’000 |
2019 £’000 |
2018 £’000 |
|||||||||
Interest charge on bank borrowings |
£ |
10 |
£ |
90 |
£ |
460 |
|||||
Running costs related to our revolving credit facility |
809 |
248 |
101 |
||||||||
Interest charge on leases |
1,066 |
3 |
8 |
||||||||
Foreign exchange loss |
— |
— |
17 |
||||||||
Other interest charge |
6 |
4 |
3 |
||||||||
Fair value movement of financial liabilities |
49 |
5,954 |
229 |
||||||||
Total |
£ |
1,940 |
£ |
6,299 |
£ |
818 |
|||||
10. |
Finance Income |
2020 £’000 |
2019 £’000 |
2018 £’000 |
|||||||||
Interest income on bank deposits |
£ |
497 |
£ |
450 |
£ |
26 |
|||||
Other interest income |
58 |
36 |
9 |
||||||||
Gain on derecognition of right-of-use assets sub-leased |
472 |
— |
— |
||||||||
Fair value movement of financial assets |
30 |
— |
— |
||||||||
Foreign exchange gain |
2,052 |
2,943 |
— |
||||||||
Total |
£ |
3,109 |
£ |
3,429 |
£ |
35 |
|||||
F-31
11. |
Tax On Profit On Ordinary Activities |
Analysis of charge / (credit) in the year
2020 £’000 |
2019 £’000 |
2018 £’000 |
|||||||||
U.K. corporation tax based on the results for the year ended 30 June 2020 at 19% (2019 : 19%, 2018: 19%) |
£ |
123 |
£ |
4,636 |
£ |
1,977 |
|||||
Overseas tax |
5,130 |
5,207 |
4,048 |
||||||||
Current Tax |
5,253 |
9,843 |
6,025 |
||||||||
Deferred Tax |
(1,407 |
) |
(3,750 |
) |
(350 |
) |
|||||
Total tax |
£ |
3,846 |
£ |
6,093 |
£ |
5,675 |
|||||
A U.K. Corporation rate of 19% (effective 1 April 2020) was substantively enacted on 17 March 2020, reversing the previously enacted reduction in the rate from 19% to 17%.
Reconciliation of the tax rate on group profits
2020 |
2019 |
2018 |
||||||||||||||||||
£’000 |
% |
£’000 |
% |
£’000 |
% |
|||||||||||||||
Profit on ordinary activities before taxation |
£ |
25,256 |
£ |
30,100 |
£ |
24,650 |
||||||||||||||
Profit on ordinary activities at U.K. statutory rate |
4,799 |
19.0 |
5,719 |
19.0 |
4,684 |
19.0 |
||||||||||||||
Differences in overseas tax rates |
(912 |
) |
(3.6 |
) |
(922 |
) |
(3.1 |
) |
(359 |
) |
(1.5 |
) |
||||||||
Impact of share-based compensation |
400 |
1.6 |
288 |
1.0 |
150 |
0.6 |
||||||||||||||
Utilisation of previously unrecognised tax losses |
(97 |
) |
(0.4 |
) |
— |
— |
(2 |
) |
— |
|||||||||||
Non taxable gain on sale of subsidiary |
(421 |
) |
(1.7 |
) |
— |
— |
— |
— |
||||||||||||
Other permanent differences |
63 |
0.2 |
632 |
2.1 |
1,030 |
4.2 |
||||||||||||||
Adjustments related to prior periods |
(221 |
) |
(0.9 |
) |
164 |
0.5 |
(73 |
) |
(0.3 |
) |
||||||||||
Tax on unremitted earnings/withholding tax on dividends |
399 |
1.6 |
212 |
0.7 |
185 |
0.8 |
||||||||||||||
Impact of rate change on deferred tax |
(164 |
) |
(0.6 |
) |
— |
— |
60 |
0.2 |
||||||||||||
Total |
£ |
3,846 |
15.2 |
% |
£ |
6,093 |
20.2 |
% |
£ |
5,675 |
23.0 |
% |
||||||||
The other permanent differences of £63,000 as of 30 June 2020 are mainly related to certain expenses that are not expected to be tax deductible in any jurisdiction net of tax credits.
The other permanent differences of £632,000 as of 30 June 2019 are mainly related to certain expenses of the initial public offering that are not expected to be tax deductible in any jurisdiction.
Tax on items charged to equity and statement of comprehensive income
2020 £’000 |
2019 £’000 |
2018 £’000 |
|||||||||
Deferred tax - share-based compensation |
£ |
(1,015 |
) |
£ |
(4,077 |
) |
£ |
(1,090 |
) |
||
Current tax - share-based compensation |
(2,821 |
) |
(2,159 |
) |
— |
||||||
Total credit to equity and statement of comprehensive income |
£ |
(3,836 |
) |
£ |
(6,236 |
) |
£ |
(1,090 |
) |
||
F-32
Unremitted Earnings
The aggregate amount of unremitted profits at 30 June 2020 was approximately £27,500,000 (2019: £29,000,000). The movement during the year reflects profits made in various territories outside of the United Kingdom and repatriation of such profits through various dividend payments to Endava plc. U.K. legislation relating to company distributions provides for exemption from tax for most repatriated profits. Deferred taxation of £886,000 has been provided on these profits as of 30 June 2020 (2019: £609,000).
12. |
Deferred Tax Assets and Liabilities |
Deferred taxes arising from temporary differences and unused tax losses are summarised as follows:
Deferred tax 2020 |
At 1 July 2019 £’000 |
Exchange Adjustments £’000 |
Credit / (Charge) to Profit and Loss £’000 |
Credit to Equity £’000 |
Acquisition £’000 |
At 30 June 2020 £’000 |
|||||||||||||||||
Accelerated capital allowances |
£ |
(130 |
) |
£ |
— |
£ |
85 |
£ |
— |
£ |
— |
£ |
(45 |
) |
|||||||||
Tax losses |
867 |
— |
32 |
— |
— |
899 |
|||||||||||||||||
Share-based compensation |
6,854 |
— |
1,016 |
1,015 |
— |
8,885 |
|||||||||||||||||
Intangible assets |
(440 |
) |
(167 |
) |
344 |
— |
(2,657 |
) |
(2,920 |
) |
|||||||||||||
Other temporary differences |
366 |
(24 |
) |
(70 |
) |
— |
388 |
660 |
|||||||||||||||
Total |
£ |
7,517 |
£ |
(191 |
) |
£ |
1,407 |
£ |
1,015 |
£ |
(2,269 |
) |
£ |
7,479 |
|||||||||
Deferred tax 2019 |
At 1 July 2018 £’000 |
Exchange Adjustments £’000 |
Credit / (Charge) to Profit and Loss £’000 |
Credit to Equity £’000 |
At 30 June 2019 £’000 |
||||||||||||||
Accelerated capital allowances |
£ |
(87 |
) |
£ |
— |
£ |
(43 |
) |
£ |
— |
£ |
(130 |
) |
||||||
Tax losses |
62 |
— |
805 |
— |
867 |
||||||||||||||
Share-based compensation |
1,670 |
— |
1,107 |
4,077 |
6,854 |
||||||||||||||
Intangible assets |
(2,089 |
) |
39 |
1,610 |
— |
(440 |
) |
||||||||||||
Other temporary differences |
100 |
(5 |
) |
271 |
— |
366 |
|||||||||||||
Total |
£ |
(344 |
) |
£ |
34 |
£ |
3,750 |
£ |
4,077 |
£ |
7,517 |
||||||||
All deferred tax movements arise from the origination and reversal of temporary differences. Deferred tax assets are recognised to the extent it is probable that taxable profits will be generated against which those assets can be utilised.
After offsetting deferred tax assets and liabilities where appropriate within territories, the net deferred tax comprises:
2020 £’000 |
2019 £’000 |
||||
Deferred tax assets |
13,340 |
9,550 |
|||
Deferred tax liabilities |
(5,861 |
) |
(2,033 |
) |
|
Net deferred tax |
7,479 |
7,517 |
|||
F-33
13. |
Earnings Per Share |
Basic earnings per share
Basic EPS is calculated by dividing the profit for the year attributable to equity holders of the Company by the weighted average number of ordinary shares outstanding during the year.
2020 £’000 |
2019 £’000 |
2018 £’000 |
||||||
Profit for the year attributable to equity holders of the Company |
21,410 |
24,007 |
18,975 |
|||||
2020 |
2019 |
2018 |
||||||
Weighted average number of shares outstanding |
53,423,575 |
50,116,979 |
45,100,165 |
|||||
2020 |
2019 |
2018 |
||||||
Earnings per share - basic (£) |
0.40 |
0.48 |
0.42 |
|||||
Diluted earnings per share
Diluted EPS is calculated by dividing the profit for the year attributable to equity holders of the Company by the weighted average number of ordinary shares outstanding during the year plus the weighted average number of shares that would be issued if all dilutive potential ordinary shares were converted into ordinary shares. In accordance with IAS 33, the dilutive earnings per share are without reference to adjustments in respect of outstanding shares when the impact would be anti-dilutive.
2020 £’000 |
2019 £’000 |
2018 £’000 |
||||||
Profit for the year attributable to equity holders of the Company |
21,410 |
24,007 |
18,975 |
|||||
Fair value movement of financial liabilities |
— |
— |
126 |
|||||
Profit for the year attributable to equity holders of the Company including impact of fair value adjustment of contingent consideration |
21,410 |
24,007 |
19,101 |
|||||
2020 |
2019 |
2018 |
||||||
Weighted average number of shares outstanding |
53,423,575 |
50,116,979 |
45,100,165 |
|||||
Diluted by: options in issue and contingent shares |
2,641,505 |
4,909,244 |
5,326,051 |
|||||
Weighted average number of shares outstanding (diluted) |
56,065,080 |
55,026,223 |
50,426,216 |
|||||
2020 |
2019 |
2018 |
||||||
Earnings per share - diluted (£) |
0.38 |
0.44 |
0.38 |
|||||
F-34
14. |
Goodwill |
2020 |
£’000 |
|
Cost |
||
At 1 July 2019 |
36,760 |
|
Acquired through business combinations |
20,463 |
|
Effect of foreign exchange translations |
(338 |
) |
At 30 June 2020 |
56,885 |
|
2019 |
||
Cost |
||
At 1 July 2018 |
41,062 |
|
Acquired through business combinations |
— |
|
Effect of foreign exchange translations |
(4,302 |
) |
At 30 June 2019 |
36,760 |
|
Net book value |
||
At 30 June 2020 |
56,885 |
|
At 30 June 2019 |
36,760 |
|
The Group has one Cash Generating Unit (“CGU”) and accordingly goodwill is reported under one CGU. Goodwill acquired in a business combination is allocated, from the acquisition date, to the CGU that is expected to benefit from synergies of the combination and represents the lowest level within the entity at which the goodwill is monitored for internal reporting purposes.
During fiscal 2020, the Group acquired 100% of Intuitus Limited’s (“Intuitus”) voting rights and obtained control of Intuitus, which resulted in an increase in goodwill of £8,569,000. All goodwill is recorded in local currency of the acquired company, which is Sterling and has been allocated to the Group CGU. The Group also completed the acquisition of Exozet GmbH (“Exozet”), acquiring 100% of the voting rights and obtaining control. This resulted in an increase in goodwill of £11,893,000. All goodwill is recorded in the local currency of the acquired company, which is the Euro and has been allocated to the Group CGU.
During fiscal 2018, the Group acquired 100% of Velocity Partners, LLC (“Velocity Partners”) voting rights and obtained control of Velocity Partners, which resulted in an increase in goodwill of £24,212,000. All goodwill is recorded in local currency. Additions are converted at the exchange rate on the date of the transaction and the goodwill at the end of the year is stated at closing exchange rates. The Goodwill has been allocated to the Group CGU.
During 2019 fiscal year, following a review of the allocation of goodwill to foreign operations, the Directors have determined that goodwill of £24,212,000 which arose on the acquisition of Velocity Partners on 29 December 2017 should have been allocated differently. This element of goodwill was previously denominated in US Dollars and has now been allocated into functional currencies of the underlying foreign operations.
The re-denomination has given rise to a total reduction in the carrying value of Goodwill of £4,649,000 that has been recognised in the year-ended 30 June 2019. Had this allocation taken place at acquisition, a £3,155,000 decrease in the carrying value would have been recognised in the year-ended 30 June 2018. As this change has no impact on either the profit for the year or the statement of cash flows and as the net prior-period impact of £3,155,000 is not material in the context of the overall value of goodwill or net assets, it is, in the judgement of the Directors, appropriate to affect the change in allocation in 2019 fiscal year.
This change in the carrying value of £4,649,000 is a part of the £4,302,000 reflected in the line “effect of foreign exchange translations” in the table above. An equal and opposite entry is a part of the £5,987,000 recognised as “exchange
F-35
differences on translating foreign operations” in other comprehensive income, and subsequently the foreign exchange translation reserve in equity.
This adjustment has had no impact on the conclusion of the Group’s annual impairment review.
Goodwill Impairment Testing
Goodwill is not amortised and is tested for impairment at least annually or whenever events or changes in circumstances indicate that the carrying value may not be recoverable. Events or changes in circumstances that could trigger an impairment review include a significant adverse change in business climate, an adverse action or assessment by a regulator, unanticipated competition, a loss of key personnel, significant changes in the manner of our use of the acquired assets or the strategy for our overall business, significant negative industry or economic trends, or significant underperformance relative to expected historical or projected future results of operations.
For the year ended 30 June 2020, the Board reviewed the value of goodwill based on internal value in use calculations. The key assumptions for these calculations are discount rates, growth rates and expected changes to gross margins during the period. The growth rates for the analysed period are based on management’s expectations of the medium-term performance of the acquired businesses, planned growth market shares, industry forecasts and growth in the market. These calculations used five-year cash flow projections based on financial budgets approved by management and assumed a 1.5% terminal growth rate thereafter.
The key assumptions used in the assessments for the years ended 30 June 2020, 2019 and 2018 are as follows:
2020 |
2019 |
2018 |
||||||
Growth rate |
20 |
% |
20 |
% |
20 |
% |
||
Discount rate |
11.4 |
% |
14.5 |
% |
15.7 |
% |
||
Terminal growth rate |
1.5 |
% |
1.5 |
% |
1.5 |
% |
||
Management’s impairment assessment for 2020, 2019 and 2018 indicates value in use substantially in excess of the carrying value of goodwill. Management therefore believes that no reasonably possible change in any of the above key assumptions would cause the carrying value of the unit to materially exceed its recoverable amount.
As at 30 June 2020, 2019 and 2018, there were no indicators of impairment that suggested that the carrying amount of the Group’s goodwill is not recoverable.
F-36
15. |
Business combinations |
Acquisition of Exozet GmbH
On 17 December 2019 (the “ Exozet Acquisition Date”), the Group entered into a Share Purchase Agreement (“the Exozet Purchase Agreement”) pursuant to which the Group acquired all of the issued and outstanding equity of Exozet GmbH (“Exozet”). Exozet has a team of 156 employees based in Germany and Austria with end-to-end expertise from consulting to design, implementation and technical innovation.
The acquisition accounting of Exozet GmbH acquisition was considered provisional as at 30 June 2020, pending final conclusion on the opening working capital adjustment.
The consideration includes elements of cash, contingent and deferred compensation and equity consideration. The following table summarises the acquisition date fair values of each major class of consideration transferred:
£’000 |
||
Initial cash consideration |
15,976 |
|
Fair value of deferred consideration |
1,677 |
|
Fair value of equity consideration |
847 |
|
Fair value of credit loss utilisation refund consideration |
215 |
|
Total consideration transferred |
18,715 |
|
Under the Exozet Purchase Agreement, the Group paid the former equity holders of Exozet a cash purchase price of £16.0 million. In addition, the Group recognised a fair value of £1.7 million of deferred consideration attributed to a holdback amount, payable within 12 months of the acquisition date. The Company issued 24,392 Class A ordinary shares in the form of ADSs to the sellers as part of the purchase price, with a fair value of £0.8 million. The credit loss refund consideration of £0.2 million represents amounts due to the former equity holders of Exozet if brought forward tax losses are successfully utilised.
Under the Purchase Agreement, there are other amounts that are payable in future periods based on the continued service of certain employees of Exozet. £2.9 million worth of share units under the 2018 Equity Incentive Plan were granted to the Sellers on completion of the acquisition, which vest over a 4-year period and are all subject to continued employment. A portion of the overall share units is also subject to achievement of specific revenue and EBITDA goals over the earn-out period. As all share units are based on continued service provided to the post-combination entity, they have been excluded from consideration and will instead be accounted for as ongoing remuneration under IFRS 2.
The Company's allocation of the total purchase consideration amongst the net assets acquired is as follows:
Fair Value £’000 |
||
Intangible asset - Client relationships |
6,955 |
|
Other intangible assets |
1,030 |
|
Property, plant and equipment |
128 |
|
Right-of-use asset |
1,136 |
|
Deferred tax asset |
604 |
|
Trade and other receivables |
2,611 |
|
Cash and cash equivalents |
801 |
|
Borrowings |
(956 |
) |
Trade and other payables |
(1,501 |
) |
Corporation tax payable |
(310 |
) |
Lease liability |
(1,136 |
) |
Deferred tax liability |
(2,540 |
) |
Fair value of identifiable net assets |
6,822 |
|
Other than intangible assets, the fair value approximates the carrying value of the net assets acquired.
F-37
Intangible assets subject to valuation include client relationships. Other intangible assets that exist include technology related intangibles (own work capitalised).
The multi period excess earnings method (“MEEM”) was applied to determine the fair value of the client relationship intangible asset. The fair value determined under this approach is a function of the following: (1) future revenues expected to be generated by these assets and the profitability of these assets; (2) identification of the contribution of other tangible and intangible assets to the cash flows of these assets to apply an appropriate capital charge against the cash flows; and (3) determination of the appropriate risk-adjusted discount rate to calculate the present value of the stream of anticipated cash flows. An estimate was made by the Group regarding the amount of future revenues that could be attributed to Exozet’s clients that existed as of the acquisition date. This revenue projection was based on recurring revenue from existing customers prior to any customer attrition. As the estimate of fair value for the customer related asset is based on MEEM, consideration was given to contributions to earnings from “contributory assets” other than customer relationships, in order to isolate the cash flows attributable to the customer related asset inclusive of other assets. The after-tax residual cash flows attributable to existing customers were adjusted for attrition and discounted to a present value.
The technology related asset relates to internal hours for development of specific intellectual property. Such internal projects are approved by Management only if future benefits are specified and likely. Management concluded that the net book value at acquisition date represents a reasonable estimate of its fair value.The fair value of the assembled workforce acquired is included in the amount initially recorded as goodwill.
Deferred tax
The deferred tax liability at acquisition on the client relationship was £2.0 million based on a book base of £7.0 million and a tax base of £nil at the date of acquisition.
Goodwill
Goodwill arising from the acquisition has been recognised as follows:
£’000 |
||
Consideration transferred |
18,715 |
|
Fair value of identifiable net assets |
(6,822 |
) |
Goodwill |
11,893 |
|
The goodwill arising from the acquisition represents the knowledge and experience of the workforce, who are instrumental to securing future revenue growth and in the development of new IP and know-how, the revenue and cost synergies that are achievable and the growth opportunities that are available within the broader digital agency market. There is no goodwill amount that is expected to be deductible for tax purposes.
Revenue and Loss of Exozet from the Exozet Acquisition Date to 30 June 2020
£’000 |
||
Revenue |
8,054 |
|
Loss |
100 |
|
Management’s estimate of Revenue and Profit of Exozet for the reporting period ended 30 June 2020 (had the acquisition occurred at the beginning of the reporting period)
£’000 |
||
Revenue |
15,623 |
|
Profit |
501 |
|
Acquisition Related Costs
£’000 |
||
Legal and professional fees |
620 |
|
F-38
The acquisition related costs are expensed as incurred.
Acquisition of Intuitus Limited
On 1 November 2019 (the “Intuitus Acquisition Date”), the Group entered into a Share Purchase Agreement (“the Intuitus Purchase Agreement”) pursuant to which the Group acquired all of the issued and outstanding equity of Intuitus Limited (“Intuitus”), obtaining control. Intuitus is a leading independent provider of technology and digital due diligence, and other technology advisory services to Private Equity clients. In connection with its acquisition of Intuitus, the Group acquired over 100 active clients, most of which are Private Equity firms based in the United Kingdom and Continental Europe, as well as in the United States and Middle East.
The acquisition accounting of the Intuitus acquisition was considered final as at 30 June 2020.
The consideration includes elements of cash, deferred compensation and equity consideration. The following table summarises the acquisition date fair values of each major class of consideration transferred:
£’000 |
||
Initial cash consideration |
9,024 |
|
Fair value of deferred consideration |
1,889 |
|
Fair value of equity consideration |
3,110 |
|
Total consideration transferred |
14,023 |
|
Under the Intuitus Purchase Agreement, the Group paid the former equity holders of Intuitus a cash purchase price of £9.0 million. In addition, the Group recognised a fair value of £1.9 million of deferred consideration attributed to a holdback amount, payable within 18 months of the acquisition date. The Company also issued 98,147 Class A ordinary shares in the form of ADSs to the sellers as part of the purchase price, with a fair value of £3.1 million.
Under the Purchase Agreement, there are other amounts that are payable in future periods based on the continued service of certain employees of Intuitus £2.5 million worth of share units under the 2018 Equity Incentive Plan were granted to the Sellers on completion of the acquisition, which vest over a 4-year period and are all subject to continued employment. A portion of the overall share units is also subject to achievement of specific revenue and profit margin goals over the earn-out period. As all share units are based on continued service provided to the post-combination entity, they have been excluded from consideration and will instead be accounted for as ongoing remuneration under IFRS 2.
The Company's allocation of the total purchase consideration amongst the net assets acquired is as follows:
Fair Value £’000 |
||
Intangible asset - Client relationships |
2,547 |
|
Intangible asset - Trade name |
272 |
|
Intangible asset - Supplier relationships |
120 |
|
Other intangible assets |
9 |
|
Property, plant and equipment |
82 |
|
Right-of-use asset |
548 |
|
Deferred tax asset |
225 |
|
Trade and other receivables |
2,054 |
|
Cash and cash equivalents |
2,488 |
|
Corporation tax receivable |
247 |
|
Trade and other payables |
(2,041 |
) |
Lease liability |
(539 |
) |
Deferred tax liability |
(558 |
) |
Fair value of identifiable net assets |
5,454 |
|
Other than intangible assets, the fair value approximates the carrying value of the net assets acquired.
F-39
Intangible assets subject to valuation include: Intuitus trade name, network of contractors (supplier relationship), client relationships and workforce. Other intangibles considered but not valued included: software, favourable and unfavourable agreements and non-compete agreements. The income approach (relief from royalty) was used to value Intuitus trade name, the income approach (excess earnings) for client relationships and the cost approach for network of contractors and workforce.
The relief from royalty method assumes that the value of an intangible asset is equal to the present value of the amount the business would be prepared to pay to lease or rent that asset under a contract if it did not own the asset. The value of an intangible asset under this method is calculated as the difference between the business value estimated under two sets of cash flow projections: a) the value of the business with all assets in place at the valuation date, and b) the value of the business with all assets in place but the subject asset at the valuation date.
The multi period excess earnings method (“MEEM”) was applied to determine the fair value of the client relationship intangible asset. The fair value determined under this approach is a function of the following: (1) future revenues expected to be generated by these assets and the profitability of these assets; (2) identification of the contribution of other tangible and intangible assets to the cash flows of these assets to apply an appropriate capital charge against the cash flows; and (3) determination of the appropriate risk-adjusted discount rate to calculate the present value of the stream of anticipated cash flows. An estimate was made by the Group regarding the amount of future revenues that could be attributed to Intuitus’s clients that existed as of the acquisition date. This revenue projection was based on recurring revenue from existing customers prior to any customer attrition. As the estimate of fair value for the customer related asset is based on MEEM, consideration was given to contributions to earnings from “contributory assets” other than customer relationships, in order to isolate the cash flows attributable to the customer related asset inclusive of other assets. The after-tax residual cash flows attributable to existing customers were adjusted for attrition and discounted to a present value.
The cost approach is based on the current cost to recreate or duplicate the asset less an appropriate allowance for a decrease in value due to the passage of time or obsolescence. Incorporated in the cost approach is the economic principle of substitution, which states that an informed purchaser would pay no more for an asset than the cost of purchasing or producing a substitute asset with the same utility as the appraised asset.
The fair value of the assembled workforce acquired is included in the amount initially recorded as goodwill.
Deferred tax
The deferred tax liability at acquisition on the client relationship and other intangibles (trade name and supplier relationship) was £0.6 million based on a book base of £2.9 million and a tax base of £0 at the date of acquisition.
Goodwill
Goodwill arising from the acquisition has been recognised as follows:
£’000 |
||
Consideration transferred |
14,023 |
|
Fair value of identifiable net assets |
(5,454 |
) |
Goodwill |
8,569 |
|
The goodwill arising from the acquisition represents the assembled workforce and expected synergies from combining Intuitus operations into the Group’s existing operations. The acquisition will enhance the Company’s capability and accelerates its market penetration within the private equity sector. There is no goodwill amount that is expected to be deductible for tax purposes.
Revenue and Loss of Intuitus from Intuitus Acquisition Date to 30 June 2020
£’000 |
||
Revenue |
3,368 |
|
Loss |
267 |
|
Management’s estimate of Revenue and Loss of Intuitus for the reporting period ended 30 June 2020 (had the acquisition occurred at the beginning of the reporting period)
F-40
£’000 |
||
Revenue |
5,222 |
|
Loss |
465 |
|
Acquisition Related Costs
£’000 |
||
Legal and professional fees |
208 |
|
Stamp duty |
70 |
|
Total |
278 |
|
The acquisition related costs are expensed as incurred.
Acquisition of Velocity Partners
On 29 December 2017 (the “Acquisition Date”), the Group entered into an Equity Purchase Agreement (“the Purchase Agreement”) pursuant to which the Group acquired all of the issued and outstanding equity of Velocity Partners, LLC (“Velocity Partners”). Velocity Partners is based in Seattle, Washington and provides software development services to clients based in North America. Following the acquisition, 527 employees of Velocity Partners became part of the Group.
The acquisition accounting for the Velocity Partners acquisition was considered final as at 30 June 2018.
Total consideration includes elements of cash, contingent consideration and deferred compensation. Under the Purchase Agreement, there are other amounts that are payable in future periods based on the continued service of certain employees of Velocity Partners. Any amounts based on continued service provided to the post-combination entity have been excluded from consideration and will instead be accounted for as ongoing remuneration. The following table summarises the acquisition date fair values of each major class of consideration transferred:
£’000 |
||
Initial cash consideration |
28,586 |
|
Fair value of deferred consideration |
4,198 |
|
Fair value of contingent consideration |
10,933 |
|
Fair value of tax refund consideration |
1,170 |
|
Total consideration transferred |
44,887 |
|
Under the Purchase Agreement, the Group paid to the former equity holders of Velocity Partners a cash purchase price of £28.6 million. In addition, the Group recognised a fair value of £4.2 million of deferred consideration attributed to a holdback amount, of which £3.0 million was paid during 2019 and £1.5 million was paid during 2020.
The contingent consideration was settled with equity during 2019. The Group measured its contingent consideration liability at fair value (the “contingent equity consideration”). Since the IPO happened on 27 July 2018, the fair value of the contingent consideration increased because the closing price achieved on IPO was higher than the price valuation used at 30 June 2018. This was recognised in the statement of comprehensive income as a fair value adjustment.
The tax refund consideration of £1.2 million represents the amounts due to the former equity holders of Velocity Partners if the Group receives certain future tax refunds. As part of Velocity Partner’s closing balance sheet as of the acquisition date, Velocity Partners has recorded a $0.5 million tax receivable for a Washington State tax refund for the periods from 2010-2013 and $1.1 million value-added tax receivable in Argentina, recorded in other receivables. In the instance Velocity Partners receives proceeds under either of these tax refunds, they are owed to the seller as part of the terms of the Equity Purchase Agreement.
The Company's allocation of the total purchase consideration amongst the net assets acquired is as follows:
F-41
Fair Value £’000 |
||
Intangible asset - Client relationships |
15,214 |
|
Property, plant and equipment |
932 |
|
Trade and other receivables |
6,045 |
|
Cash and cash equivalents |
2,341 |
|
Trade and other payables |
(3,791 |
) |
Corporation tax payable |
(39 |
) |
Deferred tax liability |
(27 |
) |
Fair value of identifiable net assets |
20,675 |
|
Other than intangible assets, the fair value approximates the carrying value of the net assets acquired.
Intangible assets subject to valuation include client relationships. Other immaterial intangibles assets that exist include the Velocity Partners trade name and a non-compete agreement.
The multi period excess earnings method (“MEEM”) was applied to determine the fair value of the client relationship intangible asset. The fair value determined under this approach is a function of the following: (1) future revenues expected to be generated by these assets and the profitability of these assets; (2) identification of the contribution of other tangible and intangible assets to the cash flows of these assets to apply an appropriate capital charge against the cash flows; and (3) determination of the appropriate risk-adjusted discount rate to calculate the present value of the stream of anticipated cash flows.
An estimate was made by the Group regarding the amount of future revenues that could be attributed to Velocity Partners’ clients that existed as of the acquisition date. This revenue projection was based on recurring revenue from existing customers prior to any customer attrition. As the estimate of fair value for the customer related asset is based on MEEM, consideration was given to contributions to earnings from “contributory assets” other than customer relationships, in order to isolate the cash flows attributable to the customer related asset inclusive of other assets. The after-tax residual cash flows attributable to existing customers were adjusted for attrition and discounted to a present value. The fair value of the assembled workforce acquired is included in the amount initially recorded as goodwill.
Deferred Tax
The deferred tax liability at acquisition on the client relationship was zero as the tax base at the date of acquisition was equal to the carrying value. Over time, a temporary difference will arise and applicable U.S. tax rates will be applied to arrive at the deferred tax balance.
Goodwill
Goodwill arising from the acquisition has been recognised as follows:
£’000 |
||
Consideration transferred |
44,887 |
|
Fair value of identifiable net assets |
(20,675 |
) |
Goodwill |
24,212 |
|
Goodwill relates to the benefit of expected synergies, future market development (including future growth potential from new clients) and the possibility of innovation and expansion by utilising a larger workforce. These benefits are not recognised separately from goodwill as they do not meet the recognition criteria for identifiable intangible assets.
Revenue and Profit of Velocity Partners from Acquisition Date to 30 June 2018
£’000 |
||
Revenue |
15,281 |
|
Profit |
2,635 |
|
F-42
Management’s estimate of Revenue and Profit of Velocity Partners for the reporting period ended 30 June 2018 (had the acquisition occurred at the beginning of the reporting period)
£’000 |
||
Revenue |
30,383 |
|
Profit |
4,327 |
|
Acquisition Related Costs
£’000 |
||
Legal and professional fees |
1,233 |
|
Acquisition related costs are expensed as incurred.
16. |
Intangible Assets |
2020 |
Client relationship £’000 |
Software and licences £’000 |
Non-Compete Agreement £’000 |
Trade name £’000 |
Supplier relationships £’000 |
Software own work-concluded projects £’000 |
Software own work-projects in progress £’000 |
Total £’000 |
|||||||||||||||||||||||
Cost |
|||||||||||||||||||||||||||||||
At 1 July 2019 |
£ |
34,440 |
£ |
4,885 |
£ |
139 |
£ |
— |
£ |
— |
£ |
— |
£ |
— |
£ |
39,464 |
|||||||||||||||
Additions |
— |
2,427 |
— |
— |
— |
— |
88 |
2,515 |
|||||||||||||||||||||||
On acquisition of subsidiary / business |
9,502 |
9 |
— |
272 |
120 |
818 |
212 |
10,933 |
|||||||||||||||||||||||
Reclassification |
— |
— |
— |
— |
— |
187 |
(187 |
) |
— |
||||||||||||||||||||||
Disposals |
— |
(37 |
) |
— |
— |
— |
— |
— |
(37 |
) |
|||||||||||||||||||||
Effect of foreign exchange translations |
1,547 |
4 |
5 |
— |
— |
84 |
9 |
1,649 |
|||||||||||||||||||||||
At 30 June 2020 |
£ |
45,489 |
£ |
7,288 |
£ |
144 |
£ |
272 |
£ |
120 |
£ |
1,089 |
£ |
122 |
£ |
54,524 |
|||||||||||||||
Amortisation |
|||||||||||||||||||||||||||||||
At 1 July 2019 |
£ |
9,414 |
£ |
1,001 |
£ |
139 |
£ |
— |
£ |
— |
£ |
— |
£ |
— |
£ |
10,554 |
|||||||||||||||
Charge for the year |
4,019 |
572 |
— |
36 |
16 |
194 |
— |
4,837 |
|||||||||||||||||||||||
Disposals |
— |
(23 |
) |
— |
— |
— |
— |
— |
(23 |
) |
|||||||||||||||||||||
Effect of foreign exchange translations |
367 |
6 |
5 |
— |
— |
27 |
— |
405 |
|||||||||||||||||||||||
At 30 June 2020 |
£ |
13,800 |
£ |
1,556 |
£ |
144 |
£ |
36 |
£ |
16 |
£ |
221 |
£ |
— |
£ |
15,773 |
|||||||||||||||
Net book value |
|||||||||||||||||||||||||||||||
At 30 June 2020 |
£ |
31,689 |
£ |
5,732 |
£ |
— |
£ |
236 |
£ |
104 |
£ |
868 |
£ |
122 |
£ |
38,751 |
|||||||||||||||
F-43
2019 |
Client relationship £’000 |
Software and licences £’000 |
Non-Compete Agreement £’000 |
Total £’000 |
|||||||||||
Cost |
|||||||||||||||
At 1 July 2018 |
£ |
33,562 |
£ |
3,658 |
£ |
134 |
£ |
37,354 |
|||||||
Additions |
— |
1,315 |
— |
1,315 |
|||||||||||
Disposals |
— |
(86 |
) |
— |
(86 |
) |
|||||||||
Effect of foreign exchange translations |
878 |
(2 |
) |
5 |
881 |
||||||||||
At 30 June 2019 |
£ |
34,440 |
£ |
4,885 |
£ |
139 |
£ |
39,464 |
|||||||
Amortisation |
|||||||||||||||
At 1 July 2018 |
£ |
5,786 |
£ |
662 |
£ |
119 |
£ |
6,567 |
|||||||
Charge for the year |
3,455 |
427 |
15 |
3,897 |
|||||||||||
Disposals |
— |
(86 |
) |
— |
(86 |
) |
|||||||||
Effect of foreign exchange translations |
173 |
(2 |
) |
5 |
176 |
||||||||||
At 30 June 2019 |
£ |
9,414 |
£ |
1,001 |
£ |
139 |
£ |
10,554 |
|||||||
Net book value |
|||||||||||||||
At 30 June 2019 |
£ |
25,026 |
£ |
3,884 |
£ |
— |
£ |
28,910 |
|||||||
F-44
17. |
Property, Plant and Equipment
|
2020 |
Computers & Equipment £’000 |
Fixtures & Fittings £’000 |
Motor Vehicles £’000 |
Fixed Assets in Progress £’000 |
Total £’000 |
||||||||||||||
Cost |
|||||||||||||||||||
At 1 July 2019 |
£ |
14,679 |
£ |
10,158 |
£ |
9 |
£ |
1,157 |
£ |
26,003 |
|||||||||
Additions |
4,203 |
2,803 |
— |
359 |
7,365 |
||||||||||||||
On acquisition of subsidiary / business |
143 |
67 |
— |
— |
210 |
||||||||||||||
Inflation adjustment |
16 |
— |
— |
— |
16 |
||||||||||||||
Disposals |
(1,230 |
) |
(709 |
) |
— |
— |
(1,939 |
) |
|||||||||||
Disposals costs from subsidiary disposal |
(74 |
) |
(269 |
) |
— |
— |
(343 |
) |
|||||||||||
Transfers |
— |
1,193 |
— |
(1,193 |
) |
— |
|||||||||||||
Effect of foreign exchange translations |
(239 |
) |
(61 |
) |
— |
— |
(300 |
) |
|||||||||||
At 30 June 2020 |
£ |
17,498 |
£ |
13,182 |
£ |
9 |
£ |
323 |
£ |
31,012 |
|||||||||
Depreciation |
|||||||||||||||||||
At 1 July 2019 |
£ |
10,387 |
£ |
5,028 |
£ |
9 |
£ |
— |
£ |
15,424 |
|||||||||
Charge for the year |
2,800 |
2,016 |
— |
— |
4,816 |
||||||||||||||
Disposals |
(1,174 |
) |
(614 |
) |
— |
— |
(1,788 |
) |
|||||||||||
Disposals depreciation from subsidiary disposal |
(15 |
) |
(15 |
) |
— |
— |
(30 |
) |
|||||||||||
Effect of foreign exchange translations |
(97 |
) |
(60 |
) |
— |
— |
(157 |
) |
|||||||||||
At 30 June 2020 |
£ |
11,901 |
£ |
6,355 |
£ |
9 |
£ |
— |
£ |
18,265 |
|||||||||
Net book value |
|||||||||||||||||||
At 30 June 2020 |
£ |
5,597 |
£ |
6,827 |
£ |
— |
£ |
323 |
£ |
12,747 |
|||||||||
F-45
2019 |
Computers & Equipment £’000 |
Fixtures & Fittings £’000 |
Vehicles £’000 |
Fixed Assets in Progress £’000 |
Total £’000 |
||||||||||||||
Cost |
|||||||||||||||||||
At 1 July 2018 |
£ |
12,355 |
£ |
8,171 |
£ |
20 |
£ |
164 |
£ |
20,710 |
|||||||||
Additions |
2,856 |
2,055 |
— |
1,157 |
6,068 |
||||||||||||||
Inflation adjustment |
145 |
— |
— |
— |
145 |
||||||||||||||
Disposals |
(494 |
) |
(106 |
) |
(11 |
) |
— |
(611 |
) |
||||||||||
Transfers |
— |
164 |
— |
(164 |
) |
— |
|||||||||||||
Effect of foreign exchange translations |
(183 |
) |
(126 |
) |
— |
— |
(309 |
) |
|||||||||||
At 30 June 2019 |
£ |
14,679 |
£ |
10,158 |
£ |
9 |
£ |
1,157 |
£ |
26,003 |
|||||||||
Depreciation |
|||||||||||||||||||
At 1 July 2018 |
£ |
8,477 |
£ |
3,629 |
£ |
20 |
£ |
— |
£ |
12,126 |
|||||||||
Charge for the year |
2,460 |
1,543 |
— |
— |
4,003 |
||||||||||||||
Disposals |
(477 |
) |
(89 |
) |
(11 |
) |
— |
(577 |
) |
||||||||||
Effect of foreign exchange translations |
(73 |
) |
(55 |
) |
— |
— |
(128 |
) |
|||||||||||
At 30 June 2019 |
£ |
10,387 |
£ |
5,028 |
£ |
9 |
£ |
— |
£ |
15,424 |
|||||||||
Net book value |
|||||||||||||||||||
At 30 June 2019 |
£ |
4,292 |
£ |
5,130 |
£ |
— |
£ |
1,157 |
£ |
10,579 |
|||||||||
F-46
18. |
Significant Shareholdings and Related Party Transactions |
Significant shareholdings
At 30 June 2020, the Group held 100% of the share capital of the following entities:
Subsidiary |
Country of
Incorporation
|
Class of
Shares Held
|
Percentage of
Shares Held
|
Principal Activity |
|||||
Endava (UK) Limited |
United Kingdom |
Ordinary |
100 |
% |
Provision of IT services |
||||
Endava (Managed Services) Limited |
United Kingdom |
Ordinary |
100 |
% |
Provision of IT services |
||||
ICS Endava SRL |
Moldova |
Ordinary |
100 |
% |
Provision of IT services |
||||
Endava Romania SRL |
Romania |
Ordinary |
100 |
% |
Provision of IT services |
||||
Endava (Ireland) Limited |
Ireland |
Ordinary |
100 |
% |
Provision of IT services |
||||
Endava GmbH |
Germany |
Ordinary |
100 |
% |
Provision of IT services |
||||
Endava DOOEL Skopje |
North Macedonia |
Ordinary |
100 |
% |
Provision of IT services |
||||
Endava Inc. |
United States |
Ordinary |
100 |
% |
Provision of IT services |
||||
Endava d.o.o. Beograd |
Serbia |
Ordinary |
100 |
% |
Provision of IT Services |
||||
Endava Holding B.V. |
The Netherlands |
Ordinary |
100 |
% |
Holding Company |
||||
Endava B.V. |
The Netherlands |
Ordinary |
100 |
% |
Provision of IT services |
||||
Endava EOOD |
Bulgaria |
Ordinary |
100 |
% |
Provision of IT services |
||||
Endava S.A.S. |
Colombia |
Ordinary |
100 |
% |
Provision of IT Services |
||||
Endava ApS |
Denmark |
Ordinary |
100 |
% |
Provision of IT Services |
||||
Endava LLC |
United States |
Ordinary |
100 |
% |
Provision of IT Services |
||||
Endava Holdings Inc |
United States |
Ordinary |
100 |
% |
Holding Company |
||||
Endava Nearshore Ventures LLC |
United States |
Ordinary |
100 |
% |
Provision of IT Services |
||||
Endava Vnz S.C.A. |
Venezuela |
Ordinary |
100 |
% |
Provision of IT Services |
||||
Endava Argentina SRL |
Argentina |
Ordinary |
100 |
% |
Provision of IT Services |
||||
Endava Colombia S.A.S. |
Colombia |
Ordinary |
100 |
% |
Provision of IT Services |
||||
Endava Uruguay SRL |
Uruguay |
Ordinary |
100 |
% |
Provision of IT Services |
||||
Intuitus Limited |
United Kingdom |
Ordinary |
100 |
% |
Provision of IT services |
||||
Endava Singapore Pte. Ltd |
Singapore |
Ordinary |
100 |
% |
Provision of IT Services |
||||
Endava Australia Pty Ltd |
Australia |
Ordinary |
100 |
% |
Provision of IT Services |
||||
Endava Berlin GmbH |
Germany |
Ordinary |
100 |
% |
Provision of IT Services |
||||
Exozet Neue Medienproduktion Wien GmbH |
Austria |
Ordinary |
100 |
% |
Provision of IT Services |
||||
Endava Limited Guernsey Employee Benefit Trust |
United Kingdom |
Ordinary |
100 |
% |
Employee Benefit Trust |
||||
Dormant Entities
Endava (Romania) Limited |
UK |
Ordinary |
100 |
% |
||
Green Mango Software Services Ltd |
UK |
Ordinary |
100 |
% |
||
Testing4Finance Ltd |
UK |
Ordinary |
100 |
% |
||
Alpheus Limited |
UK |
Ordinary |
100 |
% |
||
F-47
Related Party Transactions
At 30 June 2020, the executive officers and directors owned 13,168,074 ordinary shares, nominal value £0.02 per share (2019:13,452,077 ordinary shares, nominal value £0.02 per share) and held awards over a further 403,114 ordinary shares, nominal value £0.02 per share (2019: 389,607 ordinary shares, nominal value £0.02 per share).
Since April 2020, one of our directors, Sulina Connal, is employed by Google as Director of Product Partnerships for News, Web and Publishing for EMEA. In the ordinary course of its business, from time to time Endava enters into agreements for cloud service or other solutions provided by Google in connection with services provided by Endava to its clients. All transactions with Google were entered into on an arms-length basis. For the year ended June 30, 2020, the aggregate cost incurred by Endava to Google for such services was £0.2 million.
We have entered into a customer relationship with PaperRound HND Service Ltd., a company in which Mike Kinton, a member of our board of directors, holds a controlling interest and serves as a director. All transactions with PaperRound were entered into on an arms-length basis and in the ordinary course of business. We did not generate revenue from PaperRound in the fiscal year ended June 30, 2020.
Other than the transactions with executive officers and directors disclosed above, no other related party transactions have been identified.
Ultimate Parent
Endava plc is the ultimate parent entity of the Group and it is considered that there is no ultimate controlling party.
19. |
Trade and Other Receivables |
2020 £’000 |
2019 £’000 |
||||||
Trade receivables |
£ |
60,474 |
£ |
47,928 |
|||
Prepayments |
6,779 |
5,734 |
|||||
Accrued income |
8,694 |
7,019 |
|||||
Research and development tax credit |
3,688 |
2,088 |
|||||
Other receivables |
2,979 |
3,148 |
|||||
Total trade and other receivables |
£ |
82,614 |
£ |
65,917 |
|||
Trade receivables are non-interest-bearing and are generally on 30 to 90 day terms depending on the geographical territory in which sales are generated. The carrying value of trade and other receivables also represents their fair value.
Trade receivables are disclosed net of expected credit loss allowance for doubtful debts, as shown below. Due to the global financial uncertainty arising from the COVID-19 pandemic, management has considered the elevated credit risk on trade receivables. In addition, certain balances (where there was an objective evidence of credit impairment) have been provided for on an individual basis. This has resulted in a charge of £3.2 million for expected credit loss provisions on trade receivables recognised in the Consolidated statement of comprehensive income. The majority of the overall allowance recognised as at 30 June 2020 relates to customer-specific provisions, provided for on an individual basis as explained above.
Trade receivables and accrued income represent client contract assets. Other than the expected credit loss allowance discussed above, and business-as-usual movements there were no significant changes in contract assets during the year.
F-48
2020 £’000 |
2019 £’000 |
||||||
Trade receivables - gross |
£ |
64,058 |
£ |
48,365 |
|||
Expected credit loss allowance |
(3,584 |
) |
(437 |
) |
|||
Trade receivables - net |
£ |
60,474 |
£ |
47,928 |
|||
20. |
Trade and Other Payables |
2020 £’000 |
2019 £’000 |
||||||
Trade payables |
£ |
2,159 |
£ |
4,220 |
|||
Other taxation and social security |
8,293 |
5,634 |
|||||
Other liabilities |
2,810 |
2,985 |
|||||
Accruals |
42,134 |
33,326 |
|||||
Deferred income |
3,203 |
2,337 |
|||||
Total trade and other payables |
£ |
58,599 |
£ |
48,502 |
|||
Deferred income represents client contract liabilities at year end where cash was received from clients but Endava is yet to perform the work. £2.1 million of the deferred income recognised at 1 July 2019 was recognised as revenue during the year (2019: £2.4 million). Other than business-as-usual movements there were no significant changes in deferred income balance during the year.
21. |
Financial Assets and Liabilities |
Categories of financial assets and financial liabilities
Financial assets
The Group has the following financial assets, all of which are classified and measured at amortised cost:
2020 £’000 |
2019 £’000 |
||||||
Financial assets at amortised cost |
|||||||
Trade and other receivables (note 19) |
£ |
82,614 |
£ |
65,917 |
|||
Finance lease receivable (note 23) |
1,223 |
— |
|||||
Total financial assets* |
£ |
83,837 |
£ |
65,917 |
|||
*Financial assets, other than cash and cash equivalents
The accounting policies provide a description of the initial recognition and measurement, and also the subsequent measurement of financial assets.
F-49
Financial liabilities
The Group has the following financial liabilities:
2020 £’000 |
2019 £’000 |
||||||
Lease liabilities |
|||||||
Current lease liabilities (note 23) |
11,132 |
21 |
|||||
Non-current lease liabilities (note 23) |
42,233 |
— |
|||||
53,365 |
21 |
||||||
Other financial liabilities at amortised cost |
|||||||
Trade and other payables (note 20) |
58,599 |
48,502 |
|||||
Other liabilities |
136 |
113 |
|||||
58,735 |
48,615 |
||||||
Financial liabilities at fair value through profit or loss |
|||||||
Contingent consideration (note 15) |
1,442 |
1,244 |
|||||
Deferred consideration (note 15) |
3,764 |
1,516 |
|||||
5,206 |
2,760 |
||||||
Total financial liabilities |
£ |
117,306 |
£ |
51,396 |
|||
The accounting policies provide a description of the initial recognition and measurement, and also the subsequent measurement of financial liabilities.
Where financial assets and financial liabilities are measured at fair value, their measurement should be classified into the following hierarchy:
• |
Level 1 - quoted prices (unadjusted) in active markets for identical assets or liabilities. |
• |
Level 2 - inputs other than quoted prices included within Level 1 that are observable for the asset or liability, either directly (i.e. as prices) or indirectly (i.e. derived from prices). |
• |
Level 3 - inputs for the asset or liability that are not based on observable market data (unobservable inputs). |
Contingent consideration and deferred consideration have been classified within level 3.
Fair Value Movement of Contingent Equity Consideration
2019 £’000 |
||||
Fair value at 1 July 2018 |
£ |
11,314 |
||
Movement in fair value recognised in finance cost |
5,805 |
|||
Settlement through issuance of shares |
(17,166 |
) |
||
Foreign exchange recognised in other comprehensive income |
47 |
|||
Fair value at 30 June 2019 |
£ |
— |
||
The valuation technique used, significant unobservable inputs and inter-relationship between significant unobservable inputs are shown below:
F-50
Valuation technique |
Significant unobservable inputs |
Inter-relationship between
significant unobservable
inputs and fair value
measurement
|
||
Scenario based discounted cash flow: the valuation model considers the present value of the expected future payments in several probability weighted scenarios, discounted at risk adjusted discount rate.
|
Expected future cash flows (30 June 2018 - total maximum of £12.1million, minimum of £nil over 3 years)
Fair value of ordinary shares (30 June 2018 - $12.79)
Discount rate (30 June 2018 - 3%)
|
The estimated fair value would increase (decrease) if:
the expected cash flows were higher (lower); or
the fair value of ordinary shares was higher (lower); or
the risk-adjusted discount rate were lower (higher)
|
||
22. |
Borrowings |
Terms and conditions of outstanding borrowings as of 30 June 2020 and 2019 are as follows:
Type |
Nominal Interest p.a. |
Year of Maturity |
2020 £’000 |
2019 £’000 |
||||||||
Revolving credit facility |
LIBOR/ EURIBOR + variable margin (0.80% - 1.50%) |
2020 |
£ |
— |
£ |
— |
||||||
The multicurrency revolving credit facility is unsecured.
The Group has an unsecured bank revolving credit facility with a carrying amount of £nil at 30 June 2020 (2019: £nil). Commitment fees are charged on the undrawn balance of the facility. The available Revolving credit facility is £200 million.
The facility contains interest cover and net leverage financial covenants. The covenants are tested on a bi-annual basis based on trailing twelve months results. At 30 June 2020 and 30 June 2019, the Group complied with these financial covenants.
Guarantees
The Group has provided the following guarantees at 30 June 2020:
Parent Company Guarantees
A parent company guarantee was provided as part of the acquisition of Exozet Berlin GmbH which guarantees Endava GmbH’s obligations and liabilities under the share purchase agreement.
The parent company provided guarantees relating to certain leases entered into by Endava Romania SRL. A corporate guarantee with the government of the Republic of North Macedonia was also provided guaranteeing the fulfillment of the obligations of Endava DOOEL Skopje under the contract for granting state aid. In addition, the parent company provided unlimited multilateral guarantee under the revolving credit facility.
No claims are expected to arise from the above guarantees.
F-51
Subsidiary Guarantees
Endava Romania SRL provided a bank guarantee of €9,000,000 in favour of Romanian Ministry of Finance under the contract for granting state aid.
Additionally, Endava Romania SRL, Endava DOOEL Skopje, Endava d.o.o. Beograd, Endava Inc, and Endava EOOD Bulgaria provided bank guarantees in relation to their leases of office space.
No claims are expected to arise from above guarantees.
23. |
Leases |
The Group’s lease portfolio consists of property leases of offices and delivery centres. The Group adopted IFRS 16 ‘Leases’ at 1 July 2019 and applied the modified retrospective approach. For details of accounting policies refer to note 3. For details of the transitional impact of the change from IAS 17 and IFRIC 4 to IFRS 16 refer to note 2.
Disclosure required by IFRS 16
As a lessee:
Right-of-use assets
Set out below are the carrying amounts of the Group’s right-of-use assets and the movements during the period:
£’000 |
||
As at 1 July 2019 |
— |
|
Adjustment on initial application of IFRS 16 (see note 2) |
40,222 |
|
Additions |
20,827 |
|
Disposals |
(220 |
) |
Derecognition as a result of subleases |
(1,336 |
) |
Modifications(1)
|
335 |
|
Depreciation charge |
(9,072 |
) |
Effect of foreign exchange revaluation and translations |
378 |
|
As at 30 June 2020 |
51,134 |
|
Lease liabilities
Set out below are the carrying amounts of the Group’s lease liabilities and the movements during the period:
F-52
Leasehold Buildings £’000 |
Office equipment £’000 |
Total £’000 |
||||||
As at 1 July 2019 |
— |
21 |
21 |
|||||
Adjustment on initial application of IFRS 16 (see note 2) |
40,173 |
— |
40,173 |
|||||
Additions |
20,818 |
— |
20,818 |
|||||
Disposals |
(242 |
) |
— |
(242 |
) |
|||
Modifications(1)
|
353 |
— |
353 |
|||||
Interest |
1,066 |
— |
1,066 |
|||||
Payments |
(9,882 |
) |
(21 |
) |
(9,903 |
) |
||
Effect of foreign exchange revaluation and translations |
1,079 |
— |
1,079 |
|||||
As at 30 June 2020 |
53,365 |
— |
53,365 |
|||||
The potential impact of lease covenants is considered to be immaterial.
The maturities of the Group’s lease liabilities are as follows:
|
2020
(IFRS 16)
£’000
|
2019
(IAS 17)
£’000
|
||||
Less than 1 year |
11,132 |
21 |
|||
1 to 5 years |
30,643 |
— |
|||
More than 5 years |
16,168 |
— |
|||
Total undiscounted lease liabilities |
57,943 |
21 |
|||
Lease liabilities included in the balance sheet |
53,365 |
21 |
|||
Analysed as : |
|||||
Current |
11,132 |
21 |
|||
Non-current |
42,233 |
— |
|||
Income Statement Impact
The following items have been recognised in the Consolidated statement of comprehensive income for the current and prior year:
|
2020
(IFRS 16)
£’000 |
2019
(IAS 17)
£’000 |
|||
Depreciation on right-of-use assets |
9,072 |
— |
||
Interest expense on lease liabilities |
1,066 |
3 |
||
Expense related to short-term leases |
437 |
— |
||
Gain on sublease recognition |
(472 |
) |
— |
|
Gain on disposal of leases |
(23 |
) |
— |
|
Fair value movement of financial assets |
(30 |
) |
— |
|
Operating lease costs expensed |
— |
9,941 |
||
10,050 |
9,944 |
|||
The total Group cash outflow for leases as a lessee in the year was £9.90 million.
F-53
As a lessor:
During 2020, the Group entered into an arrangement to sub-lease a building that had been presented as part of a right-of-use asset. This has been classified as a finance sub-lease.
As a result of the above, the Group recognised a gain of £0.47 million on derecognition of the right-of-use asset pertaining to the building, which has been presented within Finance Income.
During 2020, the Group recognised interest income on lease receivables of £0.03 million (2019: nil).
The total Group cash inflow for leases as a lessor in the year was £0.67 million.
During the year the investment in finance lease receivable decreased by £0.64 million due to payments received, net off by interest income.
The following table sets out the maturity analysis of lease payments receivable for sub-leases classified as finance leases showing the undiscounted lease payments to be received after the reporting date and the net investment in the finance lease receivable.
Finance leases 2020 £’000 |
||
Less than 1 year |
584 |
|
1 to 2 years |
534 |
|
2 to 3 years |
78 |
|
3 to 4 years |
— |
|
4 to 5 years |
— |
|
More than 5 years |
— |
|
Total undiscounted lease payments receivable |
1,196 |
|
Unearned finance income |
27 |
|
Net investment in finance lease receivable |
1,223 |
|
IAS 17 Disclosure as at 30 June 2019
Commitments Under Finance Leases
Future minimum finance lease payments at 30 June 2019 were as follows:
2019 £’000 |
|||
Amounts payable within 1 year |
£ |
21 |
|
Amounts payable 1 to 3 years |
— |
||
Amounts payable 3 to 5 years |
— |
||
Amounts payable in more than 5 years |
— |
||
Total |
£ |
21 |
|
F-54
Commitments Operating Leases
At 30 June 2019, the Group had commitments under non-cancellable operating leases as follows:
2019 £’000 |
|||
Amounts payable within 1 year |
£ |
10,907 |
|
Amounts payable 1 to 3 years |
19,868 |
||
Amounts payable 3 to 5 years |
12,406 |
||
Amounts payable in more than 5 years |
15,292 |
||
Total |
£ |
58,473 |
|
24. |
Share Capital |
Authorised share capital: |
2020 £’000 |
2019 £’000 |
|||
60,000,000 ordinary shares of £0.02 each |
1,200 |
1,200 |
|||
Allotted, called up and fully paid: |
2020 No. |
£’000 |
2019 No. |
£’000 |
|||||||
Class A ordinary shares |
28,823,893 |
577 |
18,599,985 |
372 |
|||||||
Class B ordinary shares |
20,455,733 |
409 |
23,696,345 |
474 |
|||||||
Class C ordinary shares |
5,648,543 |
113 |
12,128,997 |
243 |
|||||||
Ordinary shares of £0.02 each |
54,928,169 |
1,099 |
54,425,327 |
1,089 |
|||||||
The Company issued 502,842 new shares for the year ended 30 June 2020 (30 June 2019: 4,621,182 ) in relation to exercise of options and equity consideration related to acquisitions.
Voting rights, dividends and return of capital
Our Class B ordinary shares have ten votes per share, and our Class A ordinary shares, which are the shares underlying the ADSs, and Class C ordinary shares, prior to their automatic conversion into Class A ordinary shares, each had one vote per share. Any dividend declared by the Company shall be paid on Class A ordinary shares, and the class B ordinary shares (and, prior to the automatic conversion of the Class C ordinary shares, the Class C ordinary shares) pari passu as if they were all shares of the same class.
In the event of the liquidation, dissolution or winding up of the Company, the assets of the Company available for distribution to members shall be distributed amongst all holders of Class A ordinary shares and Class B ordinary shares (and, prior to the automatic conversion of the Class C ordinary shares, any Class C ordinary shares) in proportion to the number of shares held irrespective of the amount paid or credited as paid on any share.
Restrictions
Class B ordinary shares
During the period of one hundred and eighty (180) days commencing on the IPO, no transfers of Class B ordinary shares were permitted other than to a person who is a permitted Class B ordinary transferee or pursuant to the IPO (which for the avoidance of doubt includes sales pursuant to any secondary offering or exercise of any over-allotment option in connection with the IPO).
No transfers of Class B ordinary shares shall be permitted (other than to a person who is a permitted Class B ordinary transferee):
(a) in excess of 25% of the Class B ordinary shareholders holding of Class B ordinary shares (determined as at the IPO) in the period commencing 180 days after the IPO and ending on the date falling 18 months after the IPO;
F-55
(b) in excess of 40% of the Class B ordinary shareholders holding of Class B ordinary shares (determined as at the IPO) in the period commencing 180 days after the IPO and ending on the date falling on the third anniversary of the IPO; and
(c) in excess of 60% of the Class B ordinary shareholders holding of Class B ordinary shares (determined as at the IPO) in the period commencing 180 days after the IPO and ending on the fifth anniversary of the IPO.
A Class B ordinary shareholder may, at any time after the fifth (5th) anniversary of the IPO, elect at any time to convert any of its Class B ordinary shares into Class A ordinary shares on a one-for-one basis by notice in writing to the Directors.
Class C ordinary shares
During the period of one hundred and eighty (180) days commencing on the IPO, no transfers of Class C ordinary shares were permitted.
The Company and the managing underwriter acting in connection with the IPO executed prior to the IPO, no transfers of Class C ordinary shares shall be permitted (other than in accordance with Article 35.2) in excess of 25% of the Class C ordinary shareholders holding of Class C ordinary shares (determined as at the IPO) in the period commencing 180 days after the IPO and ending on the date falling 18 months after the IPO.
25. |
Distributions Made |
During the year ended 30 June 2020, the Company did not declare and pay any cash dividends (2019: nil; 2018: nil).
26. |
Share-Based Payments |
Description of share-based payment arrangements
The Group had the following share-based payment arrangements.
Company Share Option Plan
A Company Share Option Plan (“CSOP”) was adopted on 7 May 2014 and share options over ordinary shares have been issued under the CSOP plan to certain employees of the Group. Options can be exercised on the fifth anniversary of the date of grant, upon an acquisition of the Company, and upon certain conditions of ceasing employment. In addition, our Board has discretion to permit the exercise of options upon the admission of shares to a recognised stock exchange or at an earlier time and under such conditions as determined by the Board. The options expire on the tenth anniversary of the date of grant.
Joint Share Ownership Plan
Certain of the Group’s employees have entered into a Joint Share Ownership Plan (“JSOP”) with the EBT, through which the participants have a right to receive any increase in the value of shares above a threshold amount (i) upon a sale of the Company, (ii) following a listing on a recognised stock exchange, when the participant gives a specific notice to the EBT trustee and the Company in respect of the JSOP Shares; (iii) upon the expiry of 25 years from the date of the applicable trust deed; or (iv) upon the participant leaving employment with the Group when the market value of the JSOP Shares is less than the threshold amount. The events referenced in clauses (i)-(iv) above are collectively referred as “Trigger Events.”
On the date of a Trigger Event, the EBT trustee has an option to acquire the beneficial interest belonging to the participant. If the EBT trustee exercises this option, the EBT trustee will then either transfer shares of a value equal to, or pay cash to the participant in an amount equal to, the value of the option, calculated according to the terms of the JSOP. If the applicable employee leaves employment with the Group prior to the occurrence of a Trigger Event, the value of the shares is capped at such shares’ fair market value on the employee’s last day of employment and no payment is made until a Trigger Event occurs.
F-56
The Group does not have a present obligation to settle in cash and has no history of cash settling options. Therefore, the settlement of the transactions will be accounted for in accordance with the requirements applying to equity-settled share-based compensation transactions, as set forth in IFRS 2. On and from the date of any Trigger Event, and if and for so long as the EBT trustee has not exercised the option referred to above, the EBT trustee will use reasonable endeavours to sell the JSOP Shares and distribute the net proceeds of sale between the EBT trustee and the participant in the proportions calculated according to the terms of the JSOP.
The Trigger event - the listing on the New York Stock Exchange - happened on 27 July 2018. At 30 June 2020, the EBT held 551,723 shares (30 June 2019: 1,906,462), out of which 167,611 (30 June 2019: 715,548) are allocated to employee JSOPs. For the year ended 30 June 2020, 67,937 awards under the JSOP were exercised (2019: 2,724,917) settled by shares of the EBT, 480,000 JSOPs were cancelled and 306,802 options under LTIP were exercised (2019: 72,601) and settled by shares of the EBT.
The JSOPs expire 25 years following the applicable date of issue.
Long term Incentive Plan
A Company Long Term Incentive Plan (“LTIP”) was adopted on 30 June 2015 under which options or conditional shares are intended to be awarded to certain employees of the Group. Under the LTIP, options or conditional shares can generally be banked over a five-year period subject to the achievement of annual Group performance targets. Once banked, the options become eligible to vest, with vesting occurring over a three-year period following a triggering event, which includes listing on a recognised stock exchange, a sale of the outstanding share capital of the Company or a sale of the assets of the business. The options and conditional shares expire on the earliest of the tenth anniversary of award or five years from the date of vesting.
2018 Equity Incentive Plan
On 16 April 2018, the Board adopted the 2018 Equity Incentive Plan (“EIP”) and approved by the Company shareholders on 3 May 2018. The EIP allows for the grant of equity-based incentive awards to our employees and directors, who are also our employees.
The EIP provides for the grant of options, share appreciation rights, or SARs, restricted shares, restricted share units, or RSUs, performance restricted share units, or PSUs, and other share-based awards. All awards under the EIP are set forth in award agreements, which detail the terms and conditions of awards, including any applicable vesting and payment terms, change of control provisions and post-termination exercise limitations.
The EIP is administered by the board, which may delegate its duties and responsibilities to one or more committees of our directors and/or officers (referred to as the plan administrator below), subject to certain limitations imposed under the EIP, and other applicable laws and stock exchange rules. The plan administrator has the authority to take all actions and make all determinations under the EIP, to interpret the EIP and award agreements and to adopt, amend and repeal rules for the administration of the EIP as it deems advisable. The plan administrator also has the authority to determine which eligible service providers receive awards, grant awards, set the terms and conditions of all awards under the EIP, including any vesting and vesting acceleration provisions, subject to the conditions and limitations in the EIP.
The plan administrator may select performance criteria for an award to establish performance goals for a performance period. In connection with certain corporate transactions and events affecting our ordinary shares, including a change of control, another similar corporate transaction or event, another unusual or nonrecurring transaction or event affecting us or our financial statements or a change in any applicable laws or accounting principles, the plan administrator has broad discretion to take action under the EIP to prevent the dilution or enlargement of intended benefits, facilitate the transaction or event or give effect to the change in applicable laws or accounting principles. In the event of a change of control where the successor or acquirer entity does not agree to assume, continue or rollover the awards, the awards will vest in full effective immediately prior to the change of control.
During the fiscal year ended 30 June 2020, the Company granted RSUs and PSUs only. RSUs and PSUs are contractual promises to deliver our Class A ordinary shares in the future, which may also remain forfeitable unless and
F-57
until specified conditions are met. The plan administrator may provide that the delivery of the shares underlying RSUs will be deferred on a mandatory basis or at the election of the participant. The terms and conditions applicable to restricted shares, RSUs and PSUs will be determined by the plan administrator, subject to the conditions and limitations contained in the EIP.
2018 Sharesave Plan
On 16 April 2018, the Board adopted the 2018 Sharesave Plan (“Sharesave”) and approved by the Company shareholders on 3 May 2018. The Sharesave is a U.K. tax advantaged share option plan and is intended to comply with the requirements of Schedule 3 of the Income Tax (Earnings and Provisions) Act 2003. The Sharesave was extended to award similar benefits to employees outside the United Kingdom.
The Sharesave provides that the board may require employees to have completed a qualifying period of employment (of up to five years) before they may apply for the grant of an option to purchase Class A ordinary shares. Participation in the Sharesave requires employees to agree to make regular monthly contributions to an approved savings contract of three or five years (or such other period permitted by the governing legislation).
No options to purchase Class A ordinary shares may be granted under the Sharesave more than 10 years after the Sharesave has been approved by shareholders.
Options granted under the Sharesave will normally be exercisable for a six-month period from the end of the relevant three or five year savings contract. Any options not exercised within the relevant exercise period will be forfeited.
Bonus Equity Payments
The acquisition of Velocity Partners in December 2017 also included bonus equity payments (“bonus payments”) that are payable in future periods based on the continued service of certain employees of Velocity Partners. The bonus payments were accounted for outside of the business combination because the entitlement to bonus payments is automatically forfeited if employment terminates. They were fair valued as compensation for post business combination services under IFRS 2 and the compensation expense is recognised over a three-year vesting period.
In addition to the above share option schemes, 10,000 other options were granted on 7 September 2017 to a non-employee as compensation for services rendered with an average exercise price of £4.58 per option. All 10,000 options were exercised in the period ended 30 June 2019.
Movements during the year
The number and the weighted-average exercise prices of the share options under the above arrangements were as follows:
F-58
CSOP |
JSOP |
LTIP |
EIP |
SAYE |
Bonus Payments |
Other |
||||||||||||||
Options outstanding at 1 July 2019 |
31,505 |
715,548 |
1,128,699 |
784,844 |
560,169 |
243,235 |
— |
|||||||||||||
Options granted during the year |
— |
— |
— |
710,673 |
267,834 |
— |
— |
|||||||||||||
Options exercised during the year |
10,660 |
67,937 |
309,952 |
236,046 |
4,421 |
123,426 |
— |
|||||||||||||
Options forfeited during the year |
— |
480,000 |
37,725 |
155,204 |
64,375 |
2,693 |
— |
|||||||||||||
Options outstanding at 30 June 2020 |
20,845 |
167,611 |
781,022 |
1,104,267 |
759,207 |
117,116 |
— |
|||||||||||||
Options outstanding at 1 July 2018 |
125,545 |
3,440,465 |
1,277,700 |
— |
— |
360,345 |
10,000 |
|||||||||||||
Options granted during the year |
— |
— |
— |
875,044 |
594,028 |
— |
— |
|||||||||||||
Options exercised during the year |
94,040 |
2,724,917 |
72,601 |
46,000 |
— |
117,110 |
10,000 |
|||||||||||||
Options forfeited during the year |
— |
— |
76,400 |
44,200 |
33,859 |
— |
— |
|||||||||||||
Options outstanding at 30 June 2019 |
31,505 |
715,548 |
1,128,699 |
784,844 |
560,169 |
243,235 |
— |
|||||||||||||
Options outstanding at 1 July 2017 |
125,545 |
3,440,465 |
983,500 |
— |
— |
— |
— |
|||||||||||||
Options granted during the year |
— |
— |
329,700 |
— |
— |
360,345 |
10,000 |
|||||||||||||
Options exercised during the year |
— |
— |
— |
— |
— |
— |
— |
|||||||||||||
Options forfeited during the year |
— |
— |
35,500 |
— |
— |
— |
— |
|||||||||||||
Options outstanding at 30 June 2018 |
125,545 |
3,440,465 |
1,277,700 |
— |
— |
360,345 |
10,000 |
|||||||||||||
Weighted average exercise price 30 June 2020 - £ |
0.43 |
— |
— |
— |
22.12 |
— |
— |
|||||||||||||
Weighted average exercise price 30 June 2019 - £ |
0.59 |
— |
— |
— |
19.59 |
— |
— |
|||||||||||||
Weighted average exercise price 30 June 2018 - £ |
0.82 |
— |
— |
— |
— |
— |
4.58 |
|||||||||||||
Weighted average contractual life 2020 - years |
5 |
17 |
5 |
3 |
2 |
1 |
0 |
|||||||||||||
Weighted average contractual life 2019 - years |
5 |
17 |
6 |
3 |
2 |
2 |
0 |
|||||||||||||
Weighted average contractual life 2018 - years |
6 |
19 |
7 |
0 |
0 |
3 |
1 |
|||||||||||||
Options granted in the period have been valued using a Black Scholes option pricing model using the following inputs:
2020 |
2019 |
2018 |
||||||
Exercise price |
£0.00 - £25.84 |
£0.00 - £19.59 |
£0.02 - £4.58 |
|||||
Risk free rate |
1.0% - 1.6% |
1.0%-2.91% |
0.30%-0.37% |
|||||
Expected volatility |
30.0% - 36.0% |
30.0%-36.0% |
29.9%-36.9% |
|||||
Expected dividends |
— |
— |
— |
|||||
Fair value of option |
£12.96 - £43.10 |
£4.52-£29.54 |
£0.63-£7.14 |
|||||
For the year ended 30 June 2020, the Group recognised £15,663,000 (2019: £12,022,000; 2018: £1,505,000) of share-based payment charge in respect of the above share option schemes.
27. Movements in Equity
Share capital, share premium and merger relief reserve
New ordinary shares were issued as part of the equity consideration for Intuitus and Exozet acquisitons. The Company issued 98,147 Class A ordinary shares represented by ADSs to former equity holders of Intuitus and issued
F-59
24,392 Class A ordinary shares represented by ADSs to former equity holders of Exozet, which resulted in an increase in share capital and merger relief reserve of £2,000 and £3,954,000, respectively.
New ordinary shares were also issued for the exercise of options which resulted in an increase in share capital of £8,000 and share premium of £93,000.
Investment in own shares and retained earnings
During the year ended 30 June 2020, the Company declared and paid a non-recurring, discretionary employee bonus. The EBT funded the bonus through sales of the Company’s Class A ordinary shares in two tranches: 500,000 shares sold at $38.00 in November 2019 and 480,000 shares sold at $41.75 in May 2020.
The EBT, whose beneficiaries are the Company’s employees, was holding certain Class A ordinary shares for sale in the event it decided to fund a discretionary cash bonus to the Company’s employees. The sale of shares resulted in a decrease in investment in own shares of £207,000 and increase in retained earnings of £30,710,000. From the total proceeds of £30,917,000, the Company settled the intercompany balance between the Company and the EBT of £2,860,000, paid transaction fees of £24,000 and the remaining funds were paid as bonus to our employees. Any individuals employed by the Company prior to the IPO date of 27 July 2018 and who had been continually employed up to, and including, the bonus calculation date, was eligible for the bonus. The Company recognised a bonus expense of £27,874,000 during the reporting period and incurred £159,000 foreign exchange differences resulted from exchange rate volatility upon payment.
67,937 JSOPs and 306,802 LTIPs were exercised and settled by shares owned by the EBT. This resulted in a decrease in investment in own shares of £299,000.
28. Cash Flow Adjustments and Changes in Working Capital
Adjustments |
2020 £’000 |
2019 £’000 |
2018 £’000 |
|||||||||
Depreciation, amortisation and impairment of non-financial assets |
£ |
18,725 |
£ |
7,900 |
£ |
6,269 |
||||||
Foreign exchange (gain) / loss |
(2,162 |
) |
(2,224 |
) |
354 |
|||||||
Interest income |
(499 |
) |
(476 |
) |
(35 |
) |
||||||
Fair value movement of financial liabilities |
49 |
5,954 |
229 |
|||||||||
Interest expense |
1,893 |
343 |
573 |
|||||||||
Gain on disposal of non-current assets |
(11 |
) |
(23 |
) |
(5 |
) |
||||||
Share-based compensation expense |
15,663 |
12,022 |
1,505 |
|||||||||
Hyperinflation effect gain |
(26 |
) |
(9 |
) |
— |
|||||||
Research and development tax credit |
(1,600 |
) |
(1,278 |
) |
(1,008 |
) |
||||||
Gain on sale of subsidiary |
(2,215 |
) |
— |
— |
||||||||
Gain on sublease recognition |
(472 |
) |
— |
— |
||||||||
Gain on right of use assets disposals |
(23 |
) |
— |
— |
||||||||
Fair value movement of financial assets |
(30 |
) |
— |
— |
||||||||
Grant income |
(670 |
) |
(819 |
) |
(1,633 |
) |
||||||
Total adjustments |
£ |
28,622 |
£ |
21,390 |
£ |
6,249 |
||||||
Net changes in working capital |
2020 £’000 |
2019 £’000 |
2018 £’000 |
|||||||||
Increase in trade and other receivables |
£ |
(14,120 |
) |
£ |
(16,343 |
) |
£ |
(6,384 |
) |
|||
Increase in trade and other payables |
6,361 |
4,827 |
13,223 |
|||||||||
Net changes in working capital |
£ |
(7,759 |
) |
£ |
(11,516 |
) |
£ |
6,839 |
||||
F-60
Non-Cash Changes Arising from Financing Activities
Borrowings |
Beginning of the year £’000 |
Proceeds from borrowings £’000 |
Repayment of borrowings £’000 |
Non-cash foreign exchange £’000 |
Non-cash Other £’000 |
End of the year £’000 |
||||||||||||
2018 |
29,465 |
26,462 |
(36,768 |
) |
605 |
— |
19,764 |
|||||||||||
2019 |
19,764 |
3,500 |
(23,547 |
) |
304 |
— |
21 |
|||||||||||
2020 |
21 |
— |
(21 |
) |
— |
— |
— |
|||||||||||
Grant received |
Beginning of the year £’000 |
Cash received £’000 |
Grant income £'000 |
Non-cash foreign exchange £'000 |
Non-cash Other £'000 |
End of the year £'000 |
||||||||||||
2018 |
664 |
148 |
(1,633 |
) |
5 |
— |
(816 |
) |
||||||||||
2019 |
(816 |
) |
1,786 |
(819 |
) |
(24 |
) |
— |
127 |
|||||||||
2020 |
127 |
888 |
(670 |
) |
(14 |
) |
— |
331 |
||||||||||
The grant receivable in 2018 was presented in trade and other receivables and the grant payable in 2019 and 2020 were presented in trade and other payables.
29. |
Capital Commitments |
Amounts contracted but not provided for in the financial statements amounted to £nil in the year ended 30 June 2020 (2019: £nil).
30. |
Contingent Liabilities |
The Group had no contingent liabilities at 30 June 2020 or 30 June 2019.
31. |
Financial Instrument Risk |
The Group is exposed to various risks in relation to financial instruments. The Group’s financial assets and liabilities by category are summarised in note 21. The main types of risks are foreign exchange risk, interest rate risk, credit risk and liquidity risk.
The Group’s risk management is coordinated at its headquarters, in close cooperation with the Board, and focuses on actively securing the Group’s short to medium-term cash flows by minimising the exposure to financial markets.
The Group does not actively engage in the trading of financial assets for speculative purposes nor does it write options.
Foreign Currency Sensitivity
The Group is exposed to translation and transaction foreign currency exchange risk. Several other currencies in addition to the presentation currency of Sterling are used, including Romanian Lei (RON), Euro (EUR) and US Dollars (USD).
The Group experiences currency exchange differences arising upon retranslation of monetary items (primarily short-term inter-company balances and borrowings), which are recognised as an expense in the period the difference occurs. The Group endeavours to match the cash inflows and outflows in the various currencies; the Group typically invoices its clients in their local currency, and pays its local expenses in local currency as a means to mitigate this risk.
F-61
Foreign currency denominated financial assets and liabilities which expose the Group to currency risk are disclosed below. The amounts shown are translated into GBP at the closing rate:
June 30, 2020 |
GBP £‘000 |
EUR £‘000 |
USD £‘000 |
RON £‘000 |
Others £‘000 |
TOTAL £‘000 |
|||||||||||
Financial assets |
133,613 |
14,802 |
21,060 |
5,324 |
9,142 |
183,941 |
|||||||||||
Financial liabilities |
(30,012 |
) |
(7,593 |
) |
(5,885 |
) |
(37,733 |
) |
(36,083 |
) |
(117,306 |
) |
|||||
Total |
103,601 |
7,209 |
15,175 |
(32,409 |
) |
(26,941 |
) |
66,635 |
|||||||||
June 30, 2019 |
GBP £‘000 |
EUR £‘000 |
USD £‘000 |
RON £‘000 |
Others £‘000 |
TOTAL £‘000 |
|||||||||||
Financial assets |
93,315 |
10,183 |
19,572 |
6,425 |
6,594 |
136,089 |
|||||||||||
Financial liabilities |
(19,984 |
) |
(2,593 |
) |
(8,924 |
) |
(14,329 |
) |
(5,566 |
) |
(51,396 |
) |
|||||
Total |
73,331 |
7,590 |
10,648 |
(7,904 |
) |
1,028 |
84,693 |
||||||||||
The Group is also exposed to exchange differences arising from the translation of its subsidiaries' financial statements into the Group's presentation currency of Sterling with the corresponding exchange differences taken directly to equity.
The following tables illustrate the sensitivity of profit and equity in regards to the Group’s financial assets and financial liabilities and the RON/Sterling exchange rate. The RON exposure impacts the majority of the Group’s cost base. Therefore as the Sterling strengthens, subject to any prevailing hedge arrangements, the Group benefits from a cost improvement and vice versa.
During the year ended 30 June 2020 the Sterling/RON volatility ranged from the RON strengthening against Sterling by 6% to weakening by 7%.
GBP/RON |
Profit impact £’000 |
Equity impact £’000 |
||||||
June 30, 2020 |
6 |
% |
(587 |
) |
(522 |
) |
||
June 30, 2020 |
(7 |
)% |
722 |
641 |
||||
During the year ended 30 June 2019, the Sterling/RON volatility ranged from the RON strengthening against Sterling by 5% to weakening by 4%.
GBP/RON |
Profit impact £’000 |
Equity impact £’000 |
||||||
June 30, 2019 |
5 |
% |
(564 |
) |
(504 |
) |
||
June 30, 2019 |
(4 |
)% |
470 |
421 |
||||
Interest Rate Sensitivity
At 30 June 2020, the Group is exposed to changes in market interest rates through bank borrowings on its Revolving Credit Facility at variable interest rates.
F-62
Credit Risk Analysis
Credit risk is the risk that a counterparty fails to discharge an obligation to the Group. The Group is exposed to this risk for various financial instruments, including trade receivables. The Group’s maximum exposure to credit risk is limited to the carrying amount of financial assets recognised at 30 June, as summarised below:
2020 £’000 |
2019 £’000 |
||||||
Cash and cash equivalents |
£ |
101,327 |
£ |
70,172 |
|||
Trade and other receivables |
82,614 |
65,917 |
|||||
Total |
£ |
183,941 |
£ |
136,089 |
|||
The Group monitors defaults of clients and other counterparties, identified either individually, or by group, and incorporates this information into its credit risk controls. Where available at reasonable cost, external credit ratings and/or reports on clients and other counterparties are obtained and used.
Management considers that all financial assets that are not impaired or past due at the end of the applicable reporting period are of good credit quality. Some of the unimpaired trade receivables are generally past due as of the end of the applicable reporting period. Information on financial assets past due but not impaired are as follows:
2020 £’000 |
2019 £’000 |
||||||
Not more than 3 months |
£ |
2,347 |
£ |
2,595 |
|||
More than 3 months but not more than 6 months |
1,329 |
357 |
|||||
More than 6 months but not more than 1 year |
— |
— |
|||||
More than 1 year |
— |
— |
|||||
Total |
£ |
3,676 |
£ |
2,952 |
|||
In respect of trade and other receivables, the Group is not exposed to any significant credit risk exposure to any single counterparty or any group of counterparties having similar characteristics.
The Group’s trade receivables are from a large number of clients in various industries and geographical areas. Based on historical information about client default rates, management consider the credit quality of trade receivables that are not past due or impaired to be good.
The credit risk for cash and cash equivalents is considered negligible, since the counterparties are reputable banks with high quality external credit ratings.
Liquidity Risk Analysis
The Group manages its liquidity needs by monitoring scheduled debt servicing payments for long-term financial liabilities as well as forecast cash inflows and outflows due in day-to-day business. The data used for analysing these cash flows is consistent with that used in the contractual maturity analysis below. Liquidity needs are monitored in various time bands, on a day-to-day and week-to-week basis, as well as on a longer-term basis. Net cash requirements are compared to available borrowing facilities in order to determine headroom or any shortfalls. This analysis shows that available borrowing facilities are expected to be sufficient over the lookout period.
The Group’s objective is to maintain cash and marketable securities to meet its liquidity requirements for 30‑day periods at a minimum. This objective was met for all of the reporting periods presented.
The Group considers expected cash flows from financial assets in assessing and managing liquidity risk, in particular its cash resources and trade receivables. The Group’s existing cash resources and trade receivables exceed the current cash outflow requirements. Cash flows from trade and other receivables are all contractually due within six months.
F-63
As at 30 June 2020, the Group’s non-derivative financial liabilities had contractual maturities (including interest payments where applicable) as summarised below:
Current 0 - 6 months £’000 |
Current 6 - 12 months £’000 |
Non-Current 1 - 5 years £’000 |
Non-Current +5 years £’000 |
||||||||||||
Lease liabilities |
5,652 |
5,480 |
30,643 |
11,590 |
|||||||||||
Trade and other payables |
58,599 |
— |
— |
— |
|||||||||||
Deferred consideration |
1,827 |
1,937 |
— |
— |
|||||||||||
Contingent consideration |
— |
1,442 |
— |
— |
|||||||||||
Other liabilities |
— |
— |
136 |
— |
|||||||||||
Total |
£ |
66,078 |
£ |
8,859 |
£ |
30,779 |
£ |
11,590 |
|||||||
There were no forward foreign currency options in place at 30 June 2020.
As at 30 June 2019, the Group’s non-derivative financial liabilities had contractual maturities (including interest payments where applicable) as summarised below:
Current 0 - 6 months £’000 |
Current 6 - 12 months £’000 |
Non-Current 1 - 5 years £’000 |
Non-Current +5 years £’000 |
||||||||||||
Finance lease obligations |
14 |
7 |
— |
— |
|||||||||||
Trade and other payables |
48,502 |
— |
— |
— |
|||||||||||
Deferred consideration |
1,516 |
— |
— |
— |
|||||||||||
Contingent consideration |
— |
1,244 |
— |
— |
|||||||||||
Other liabilities |
— |
— |
113 |
— |
|||||||||||
Total |
£ |
50,032 |
£ |
1,251 |
£ |
113 |
£ |
— |
|||||||
32. |
Capital Management Policies and Procedures |
The Group’s capital management objectives are:
• |
to ensure the Group's ability to continue as a going concern; and |
• |
to provide an adequate return to shareholders by pricing products and services commensurately with the level of risk. |
The Group monitors capital on the basis of the carrying amount of equity plus loan, less cash and cash equivalents as presented on the consolidated balance sheet. The Group manages its capital structure and makes adjustments in the light of changes in economic conditions and the risk characteristics of the underlying assets.
2020 £’000 |
2019 £’000 |
||||||
Equity |
236,327 |
166,329 |
|||||
Loans and borrowings |
— |
21 |
|||||
Less: Cash and cash equivalents |
(101,327 |
) |
(70,172 |
) |
|||
Total Capital |
£ |
135,000 |
£ |
96,178 |
|||
F-64
33. |
Subsequent Events |
On August 17, 2020, Endava completed the acquisition of CDS by acquiring the total issued share capital of Comtrade CDS, digitalne storitve, d.o.o., a company registered in Slovenia, (“CDS Slovenia”) and Comtrade Digital Services d.o.o., a company registered in Serbia, (“CDS Serbia”). CDS Slovenia and CDS Serbia together own and operate (either directly or through subsidiaries) all of the trade and assets that comprise CDS. CDS was formerly a division of Comtrade Group B.V. (“Comtrade”). CDS is headquartered in Dublin, Ireland, has delivery centers across the Adriatic, and provides strategic software engineering services and solutions to clients in Europe and in the United States.
The acquisition was made pursuant to the terms of a share purchase agreement between Endava (UK) Limited, Comtrade Group B.V. and Comtrade Solutions Management Holdinška Družba d.o.o., dated August 17, 2020.
The total consideration was €60 million payable in cash, which amount remains subject to post-closing adjustments based on the cash, debt and working capital of CDS as of the closing date. 10% of the purchase price will be held back for 24 months and be available to satisfy any warranty or indemnity claims. Pursuant to the terms of a transitional services agreement, Comtrade will continue to provide certain services to Endava with respect to CDS for a period of time following completion of the acquisition.
F-65
SIGNATURES
The registrant hereby certifies that it meets all of the requirements for filing on Form 20-F and that it has duly caused and authorized the undersigned to sign this annual report on its behalf.
Endava plc | |
/s/ John Cotterell | |
By: |
John Cotterell |
Title: |
Chief Executive Officer |
(Principal Executive Officer) |
|
Date: September 15, 2020