EX-99.2
Published on February 17, 2021

Q2 FY2021 INVESTOR PRESENTATION

2 This presentation includes forward-looking statements within the meaning of the Private Securities Litigation Reform Act of 1995. All statements contained in this presentation, other than statements of historical facts, are forward-looking statements. The words “believe,” “estimate,” “expect,” “may,” “will” and similar expressions are intended to identify forward-looking statements. Such forward-looking statements include, but are not limited to, the statements regarding the impact of the COVID-19 pandemic and associated global economic uncertainty on demand for our technology services, our business strategy and our plans and objectives for future operations, our addressable market, potential technological disruptions, and client demand for our services. Forward-looking statements involve known and unknown risks, uncertainties and other factors that could cause actual results to differ materially from the results anticipated by these forward-looking statements, including, but not limited to: our business, results of operations and financial condition may be negatively impacted by the COVID-19 pandemic and the precautions taken in response to the pandemic or if general economic conditions in Europe, the United States or the global economy worsen; our ability to manage our rapid growth or achieve anticipated growth; our ability to retain existing clients and attract new clients, including our ability to increase revenue from existing clients and diversify our revenue concentration; our ability to attract and retain highly-skilled IT professionals at cost-effective rates; our ability to penetrate new industry verticals and geographies and grow our revenue in current industry verticals and geographies; our ability to maintain favourable pricing and utilisation rates; our ability to successfully identify acquisition targets, consummate acquisitions and successfully integrate acquired businesses and personnel; the effects of increased competition as well as innovations by new and existing competitors in our market; our ability to adapt to technological change and innovate solutions for our clients; our ability to collect on billed and unbilled receivables from clients; our ability to effectively manage our international operations, including our exposure to foreign currency exchange rate fluctuations; our ability to remediate the identified material weaknesses and maintain an effective system of disclosure controls and internal control over financial reporting and our future financial performance, including trends in revenue, cost of sales, gross profit, selling, general and administrative expenses, finance income and expense and taxes, as well as other risks and uncertainties discussed in the “Risk Factors” section of our Annual Report on Form 20-F filed with the Securities and Exchange Commission (the “SEC”) on September 15, 2020. Except as required by law, we assume no duty to update any of these forward-looking statements after the date of this presentation to conform these statements to actual results or revised expectations. You should, therefore, not rely on these forward-looking statements as representing our views as of any date subsequent to the date of this presentation. Moreover, except as required by law, neither we nor any other person assumes responsibility for the accuracy and completeness of the forward-looking statements contained in this presentation. This presentation also contains estimates and other statistical data made by independent parties and by us relating to market size and growth and other data about our industry. This data involves a number of assumptions and limitations, and you are cautioned not to give undue weight to such estimates. Neither we nor any other person makes any representation as to the accuracy or completeness of such data or undertakes any obligation to update such data after the date of this presentation. In addition, projections, assumptions and estimates of our future performance and the future performance of the markets in which we operate are necessarily subject to a high degree of uncertainty and risk. By attending or receiving this presentation you acknowledge that you will be solely responsible for your own assessment of the market and our market position and that you will conduct your own analysis and be solely responsible for forming your own view of the potential future performance of our business. This presentation includes non-IFRS financial measures which have certain limitations and should not be considered in isolation, or as alternatives to or substitutes for, financial measures determined in accordance with IFRS. The non-IFRS measures as defined by us may not be comparable to similar non-IFRS measures presented by other companies. Our presentation of such measures, which may include adjustments to exclude unusual or non-recurring items, should not be construed as an inference that our future results will be unaffected by these or other unusual or non-recurring items. See the IFRS to Non-IFRS Reconciliation section for a reconciliation of these non-IFRS financial measures to the most directly comparable IFRS financial measures. Disclaimer

REIMAGINING THE RELATIONSHIP BETWEEN PEOPLE & TECHNOLOGY 3
We accelerate our clients’ ability to take advantage of new business models and market opportunities by ideating and delivering dynamic platforms and intelligent digital experiences that are designed to fuel rapid, ongoing transformation of their businesses. By leveraging next-generation technologies, our agile, multi-disciplinary teams provide a combination of Product & Technology Strategies, Intelligent Experiences, and World Class Engineering to help our clients become more engaging, responsive, and efficient. REIMAGINING THE RELATIONSHIP BETWEEN PEOPLE & TECHNOLOGY 4

5 1 Opportunity & Approach Q2 FY2021
6 WE ARE A LEADING NEXT-GEN TECHNOLOGY SERVICES PROVIDER AND HELP ACCELERATE DISRUPTION BY DELIVERING RAPID EVOLUTION TO ENTERPRISES. OUR PEOPLE SYNTHESIZE CREATIVITY, TECHNOLOGY, AND DELIVERY AT SCALE IN MULTI-DISCIPLINARY TEAMS, ENABLING US TO SUPPORT OUR CLIENTS FROM IDEATION TO PRODUCTION. FROM PROOF OF CONCEPT, TO PROTOTYPE, TO PRODUCTION, WE USE OUR ENGINEERING EXPERTISE TO DELIVER ENTERPRISE PRODUCTS AND PLATFORMS CAPABLE OF HANDLING MILLIONS OF TRANSACTIONS PER DAY. IN THIS NEW REALITY, WE’LL BUILD THE EXPERIENCES, TECHNICAL SCAFFOLDING, AND INFRASTRUCTURE DESIGNED TO ENABLE AN ENTIRELY NEW SET OF INTERACTIONS BETWEEN PEOPLE AND TECHNOLOGY. We enable change IN OUR WORLD TODAY, MANY BUSINESSES ARE PREPARING FOR EXTENDED PERIODS OF TIME DEFINED BY LIMITED PHYSICAL CONTACT BETWEEN HUMANS. AN ORGANIZATION’S ABILITY TO OPERATE PRIMARILY IN A DIGITAL LANDSCAPE MAY DICTATE ITS ABILITY TO BOTH SURVIVE AND SUCCEED. WE BELIEVE, MOVING FORWARD, TRUE DIGITAL TRANSFORMATION AND THE ESTABLISHMENT OF A FLEXIBLE BUSINESS MODEL WILL BECOME MISSION CRITICAL FOR BUSINESSES. The new reality

LARGE AND FAST GROWING MARKET OPPORTUNITY DELIVER RAPID EVOLUTION BY COMBINING NEXT-GEN TECHNOLOGIES WITH DEEP INDUSTRY EXPERTISE STRONG GROWTH AND FINANCIAL PERFORMANCE IDEATION TO PRODUCTION CAPABILITIES, DISTRIBUTED AGILE AT SCALE, DOMAIN EXPERTISE AND NEAR-SHORE DELIVERY FOUNDER-LED, EXPERIENCED MANAGEMENT TEAM WITH STRONG CULTURE 7

8 TRADITIONAL IT SERVICES BUS. & TECH CONSULTANTS ENGINEERING ENTERPRISE AGILE AUTOMATION NEXT-GEN TECH STRATEGY
USER EXPERIENCE DIGITAL
AGENCIES
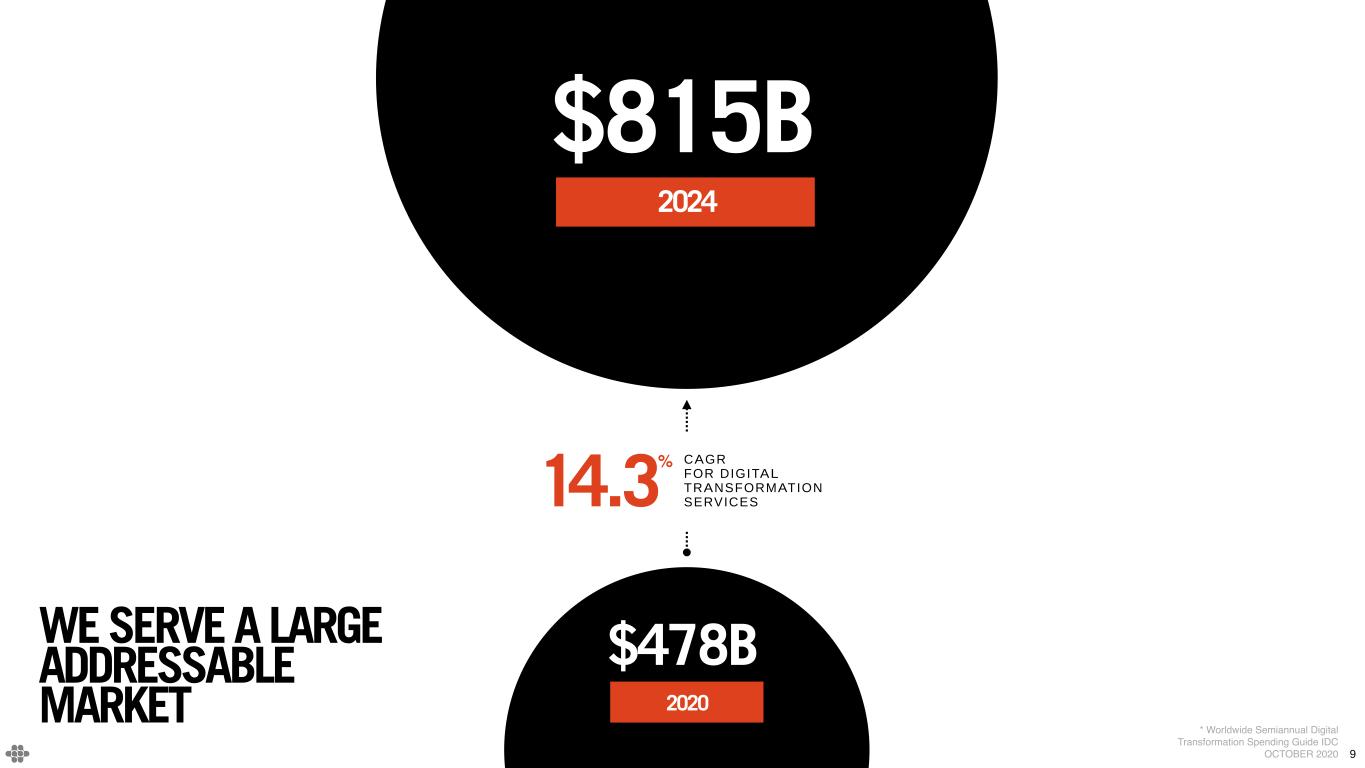
WE SERVE A LARGE ADDRESSABLE MARKET * Worldwide Semiannual Digital Transformation Spending Guide IDC OCTOBER 2020 $478B 2020 $815B 2024 14.3 % CAGR FOR DIGITAL
TRANSFORMATION
SERVICES 9
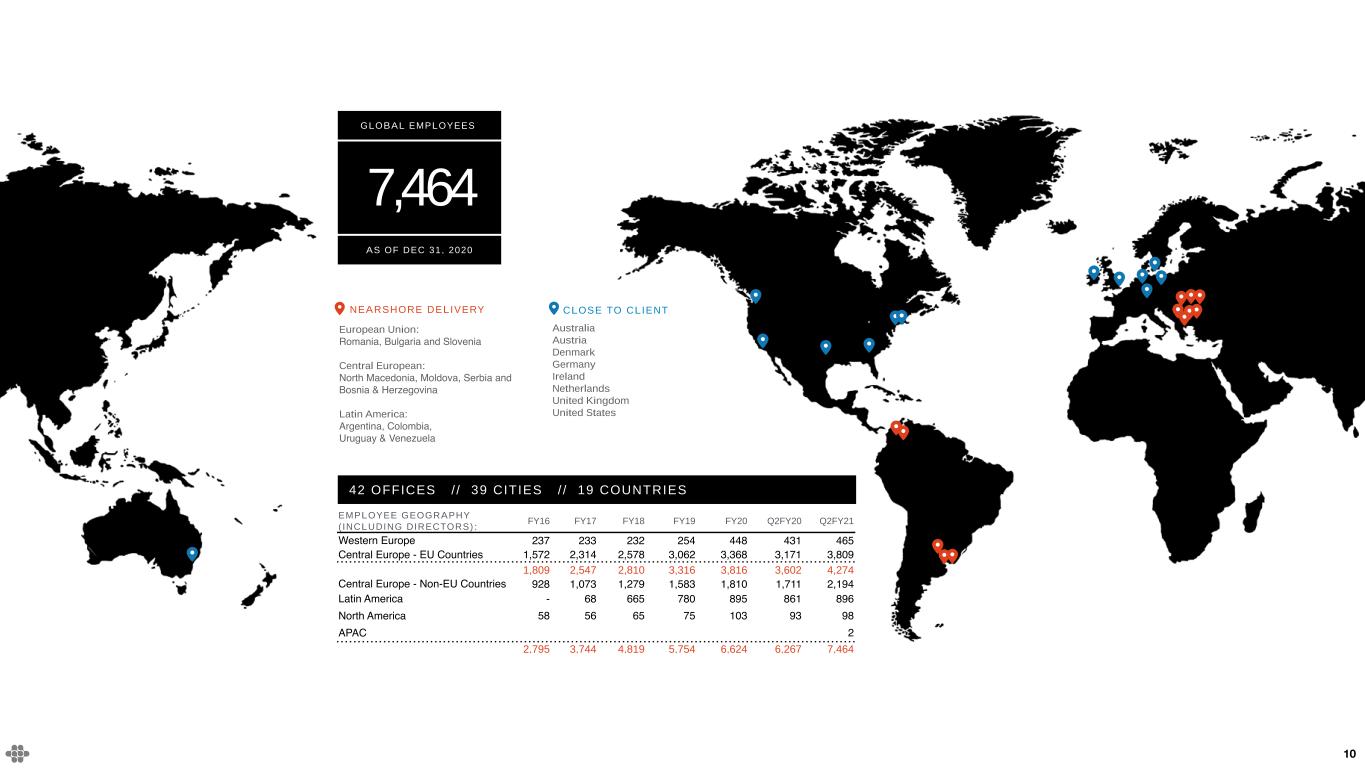
EMPLOYEE GEOGRAPHY ( INCLUDING DIRECTORS): FY16 FY17 FY18 FY19 FY20 Q2FY20 Q2FY21 Western Europe 237 233 232 254 448 431 465 Central Europe - EU Countries 1,572 2,314 2,578 3,062 3,368 3,171 3,809 1,809 2,547 2,810 3,316 3,816 3,602 4,274 Central Europe - Non-EU Countries 928 1,073 1,279 1,583 1,810 1,711 2,194 Latin America - 68 665 780 895 861 896 North America 58 56 65 75 103 93 98 APAC 2 2,795 3,744 4,819 5,754 6,624 6,267 7,464 CLOSE TO CLIENT Australia Austria Denmark Germany Ireland Netherlands United Kingdom United States NEARSHORE DELIVERY European Union:
Romania, Bulgaria and Slovenia
Central European:
North Macedonia, Moldova, Serbia and Bosnia & Herzegovina
Latin America:
Argentina, Colombia,
Uruguay & Venezuela 7,464 AS OF DEC 31, 2020 GLOBAL EMPLOYEES 10 42 OFFICES / / 39 CITIES / / 19 COUNTRIES
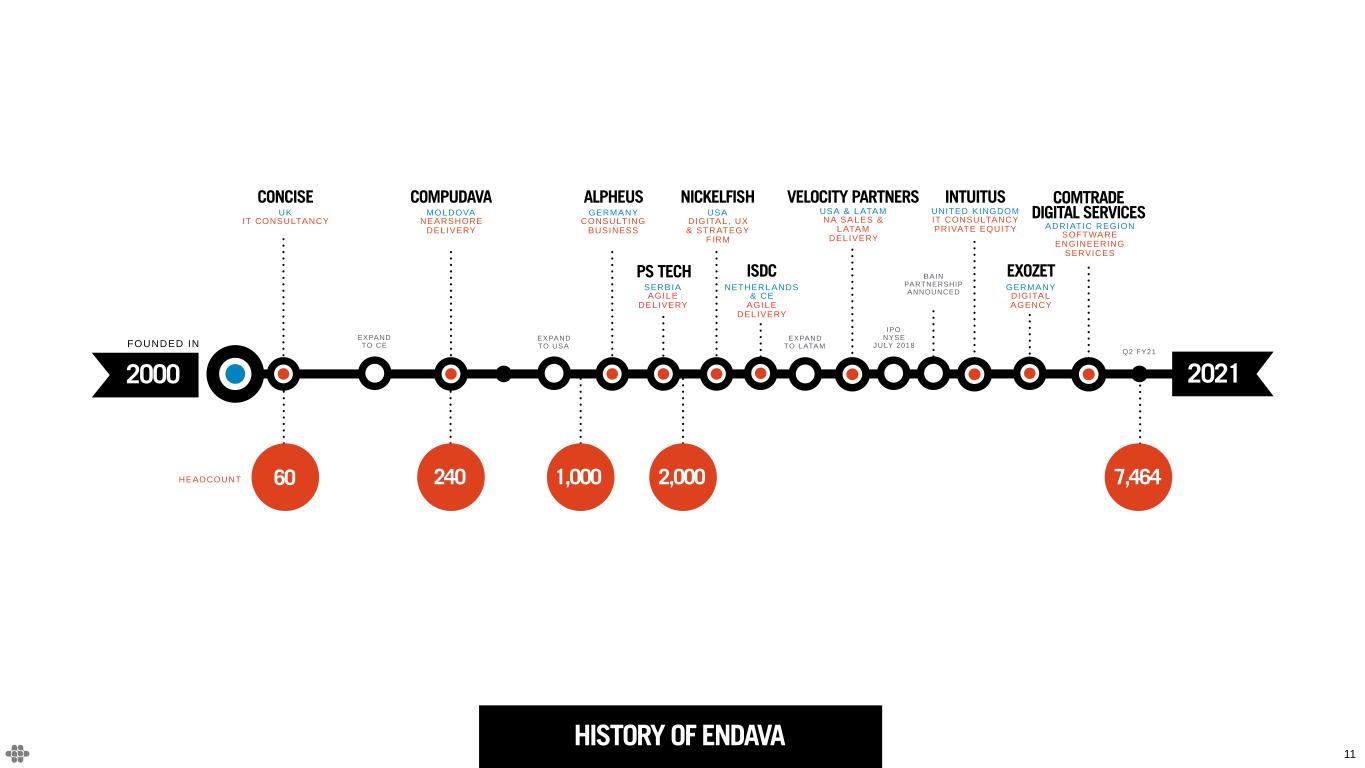
HISTORY OF ENDAVA 7,464 FOUNDED IN COMPUDAVA ALPHEUS NICKELFISH PS TECH ISDC EXPAND
TO CE VELOCITY PARTNERSCONCISE UK IT CONSULTANCY 60 240 1,000 2000 2021 EXPAND
TO USA EXPAND
TO LATAM IPO NYSE JULY 2018 MOLDOVA
NEARSHORE
DELIVERY GERMANY
CONSULTING BUSINESS USA
DIGITAL, UX
& STRATEGY
FIRM USA & LATAM
NA SALES & LATAM DELIVERY SERBIA
AGILE DELIVERY NETHERLANDS
& CE
AGILE DELIVERY 2,000 BAIN PARTNERSHIP ANNOUNCED HEADCOUNT Q2 FY21 INTUITUS UNITED KINGDOM
IT CONSULTANCY PRIVATE EQUITY EXOZET GERMANY DIGITAL AGENCY 11 COMTRADE DIGITAL SERVICES ADRIATIC REGION
SOFTWARE ENGINEERING SERVICES

12 WE CREATE VALUE THROUGH THE DELIVERY OF

13 BUSINESS ANALYSIS DATA & ANALYTICS
DIGITAL PRODUCT STRATEGY PE DIGITAL & IT ADVISORY PROGRAMME MANAGEMENT TECHNOLOGY STRATEGY AUTOMATED TESTING. CLOUD NATIVE SOFTWARE ENG. CONTINUOUS DELIVERY . DISTRIBUTED AGILE DELIVERY INTELLIGENT AUTOMATION SECURE DEVELOPMENT AGILE APPLICATIONS MGMT CLOUD INFRASTRUCTURE
DEVSECOPS
SERVICE DELIVERY SMART DESK
TELEMETRY & MONITORING ARCHITECTURE EXTENDED REALITY MACHINE LEARNING & AI
PRODUCT DESIGN USER EXPERIENCE DESIGN VISUAL DESIGN
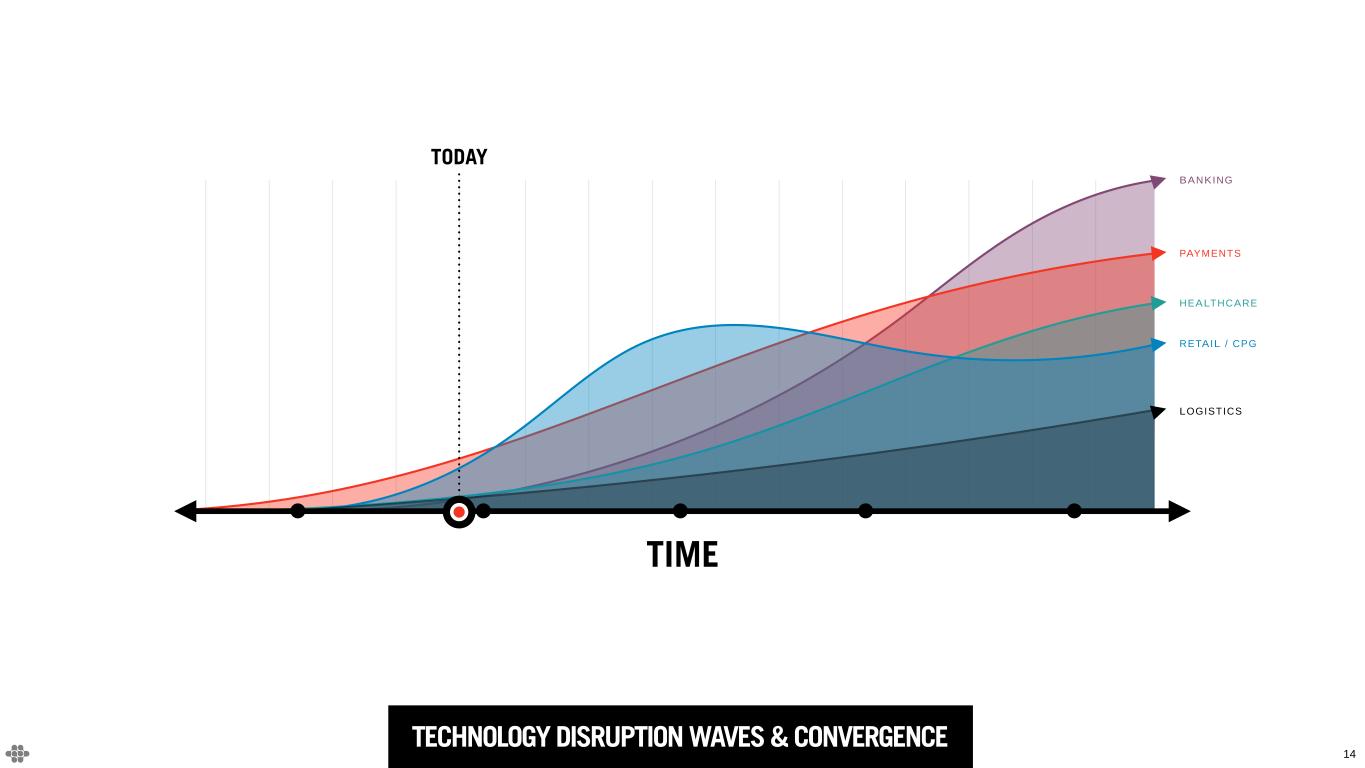
14 TODAY TIME TECHNOLOGY DISRUPTION WAVES & CONVERGENCE BANKING PAYMENTS RETAIL / CPG LOGISTICS HEALTHCARE

15 DOMAIN EXPERTISE: PAYMENT RO I O PP OR TU N IT Y 2016 2017 2018 2019 2020 PROTOTYPING PAYMENTS PLATFORMS ROBOTIC
AUTOMATION REAL OMNI-CHANNEL CUSTOMER CENTRIC UX FINANCIAL INCLUSION CHATBOTS MICRO MERCHANTS & NANO PAYMENTS SCHEMELESS BIOMETRIC IN APP P2P BLOCKCHAIN QUANTUM CRYPTOCURRENCY PSD2 OPEN APIs MESSAGE
APPS FRICTIONLESS PAYMENTS SMART POS SYSTEMS AR COMPUTER VISION

16 AS WE STRIVE TO BE THE ASPIRATIONAL BRAND FOR IT PROFESSIONALS IN THE REGIONS IN WHICH WE OPERATE, WE ATTRACT HIGH QUALITY TALENT. TO SUPPORT THIS GROWTH, WE NEED LEADERSHIP AND HAVE DEVELOPED THE ‘PASS IT ON’ INITIATIVE WHICH DRIVES LOYALTY AND LOWERS ATTRITION. WE USE TUCK-IN ACQUISITIONS TO ACCELERATE OUR GROWTH STRATEGY - TO EITHER ESTABLISH OURSELVES IN A NEW GEO OR TO ESTABLISH A NEW AREA OF EXPERTISE AND MARKET GROWTH. BRAND CULTURE M&A Scalability
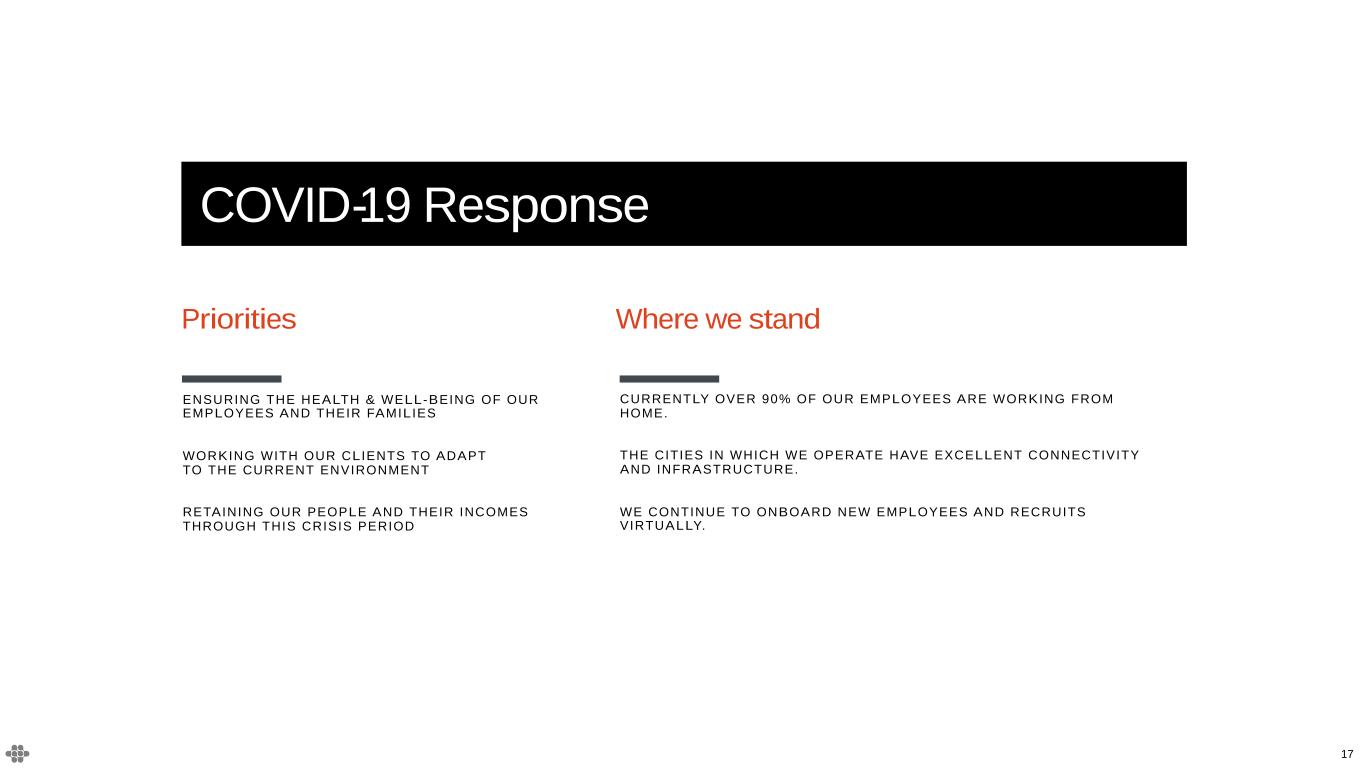
17 ENSURING THE HEALTH & WELL-BEING OF OUR EMPLOYEES AND THEIR FAMILIES WORKING WITH OUR CLIENTS TO ADAPT TO THE CURRENT ENVIRONMENT RETAINING OUR PEOPLE AND THEIR INCOMES THROUGH THIS CRISIS PERIOD Priorities CURRENTLY OVER 90% OF OUR EMPLOYEES ARE WORKING FROM HOME. THE CITIES IN WHICH WE OPERATE HAVE EXCELLENT CONNECTIVITY AND INFRASTRUCTURE. WE CONTINUE TO ONBOARD NEW EMPLOYEES AND RECRUITS VIRTUALLY. Where we stand COVID-19 Response

18 2 Financials Q2 FY2021

19 MASTER SERVICE AGREEMENTS WITH CLIENTS PRIMARILY T&M BASED PRICING LONG-TERM CLIENT RELATIONSHIPS STRONG REVENUE GROWTH HEALTHY MARGINS LOW CAPEX REQUIREMENTS POSITIVE ADJUSTED FREE CASH FLOW Financial
Highlights
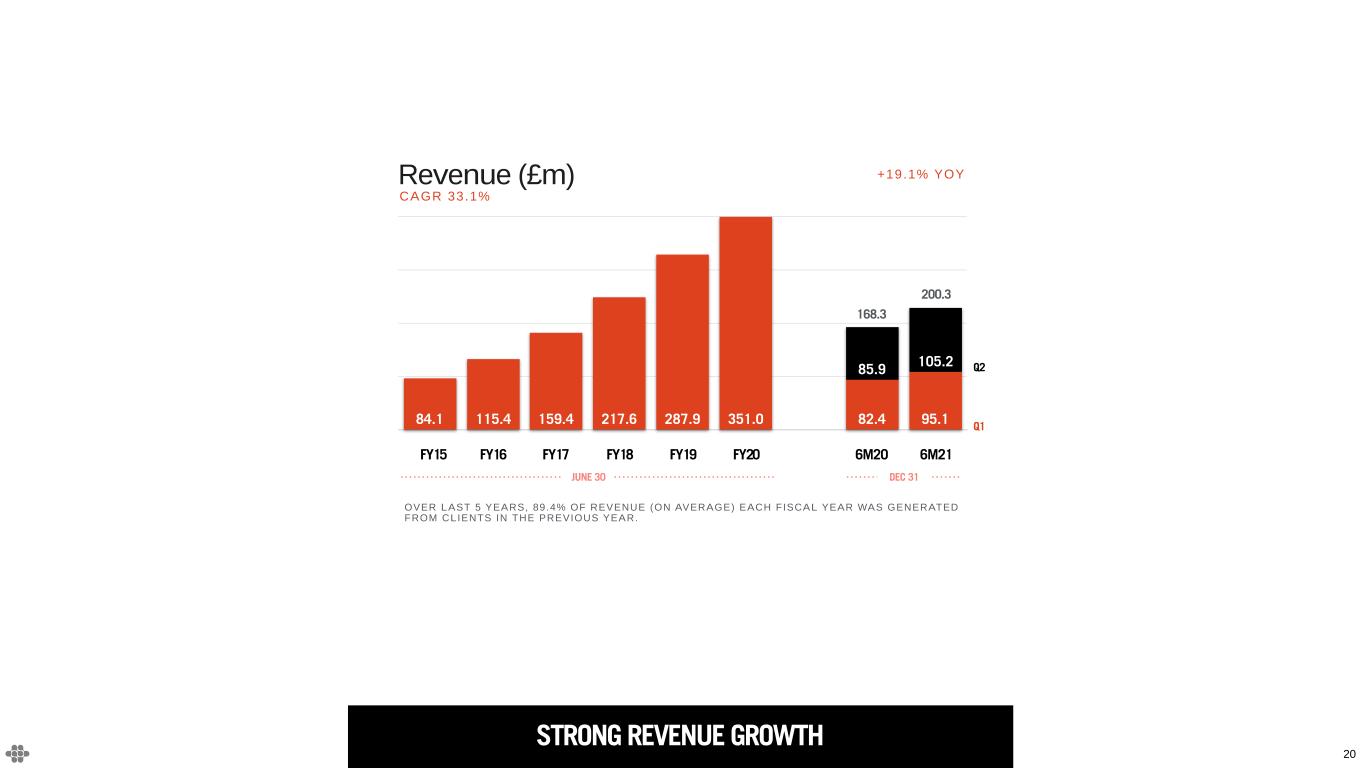
20 STRONG REVENUE GROWTH FY15 FY16 FY17 FY17 FY19 FY20 _ 6m18 6m19 105.2 85.9 95.182.4351.0287.9217.6159.4115.484.1 CAGR 33.1% OVER LAST 5 YEARS, 89.4% OF REVENUE (ON AVERAGE) EACH FISCAL YEAR WAS GENERATED FROM CLIENTS IN THE PREVIOUS YEAR. FY15 FY16 FY17 JUNE 30 DEC 31 6M20 6M21FY18 FY19 +19.1% YOYRevenue (£m) FY20 Q1 Q2 168.3 200.3
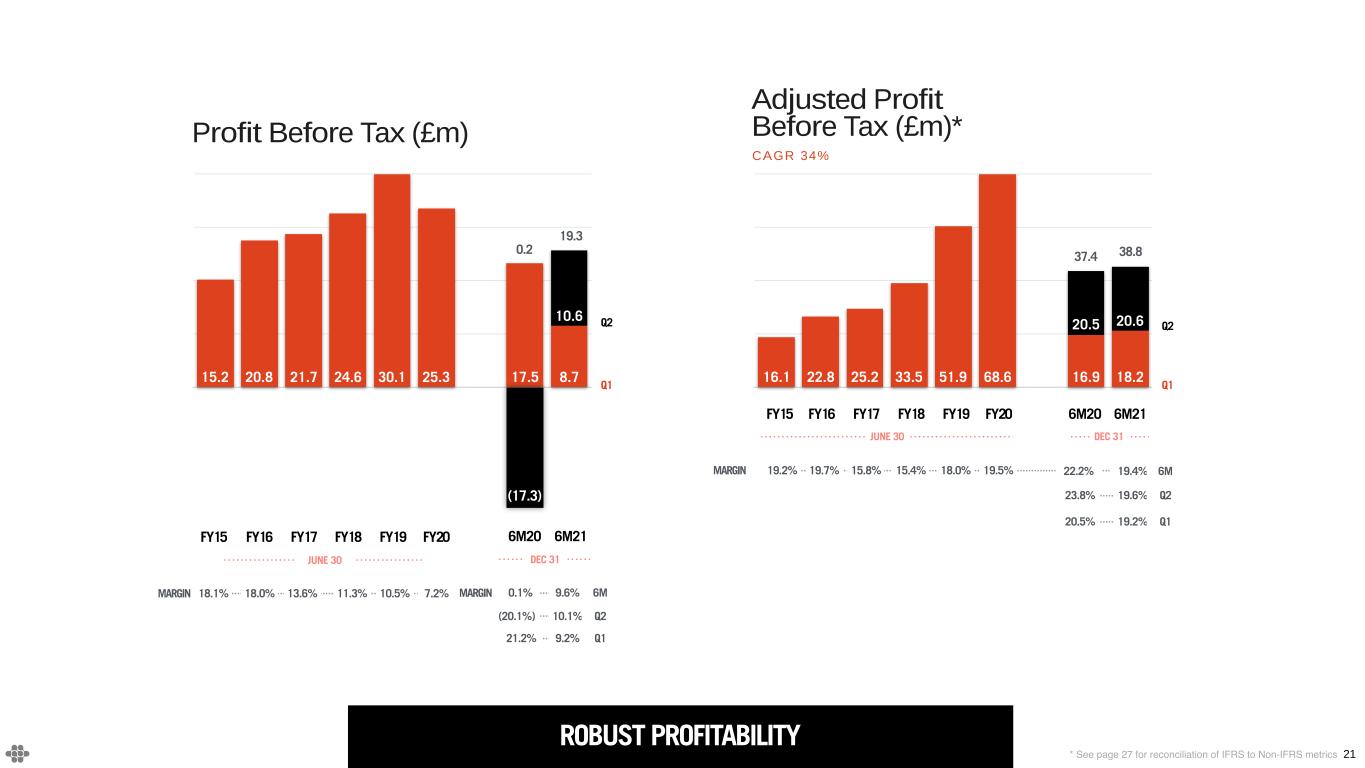
21 FY15 FY16 FY17 FY18 FY19 FY20 _ FY17 FY18 10.6 8.717.525.330.124.621.720.815.2 ROBUST PROFITABILITY FY15 FY16 FY17 FY18 FY19 FY20 _ FY17 FY18 20.620.5 18.216.968.651.933.525.222.816.1 19.2% 19.7% 15.8% 22.2% 19.4%MARGIN FY15 FY16 FY17 JUNE 30 FY18 15.4% 0.1%MARGIN FY15 FY16 FY17 JUNE 30 DEC 31 6M20 6M21FY18 FY19 FY19 18.0% DEC 31 6M20 6M21 9.6% * See page 27 for reconciliation of IFRS to Non-IFRS metrics CAGR 34% Adjusted Profit Before Tax (£m)*Profit Before Tax (£m) 18.1% 18.0% 13.6%MARGIN 11.3% 10.5% FY20 7.2% FY20 19.5% Q1 Q2 (17.3) Q1 Q2 (20.1%) 10.1% 6M Q2 20.5% 19.2% 23.8% 19.6% Q1 Q2 6M 21.2% 9.2% Q1 0.2 19.3 37.4 38.8

DEEP CLIENT RELATIONSHIPS FY15 FY17 FY18 _ FY18 7565656346342618 FY15 FY16 FY17 FY17 FY17 FY17 q218 q219 q218 q219 37%37%38%39%38%38%42%49%54%66% TOP TEN FY15 FY16 FY17 JUNE 30 FY15 FY16 FY17 JUNE 30 FY18 FY186M20 Q2FY21 DEC 31 FY19 FY19 22* Calculated on a 12 month rolling basis. Top Client Revenue % No. of Clients / Revenue > £1m* FY20 DEC 31 FY20 Q2FY20 Q2FY216M21 Q2FY20
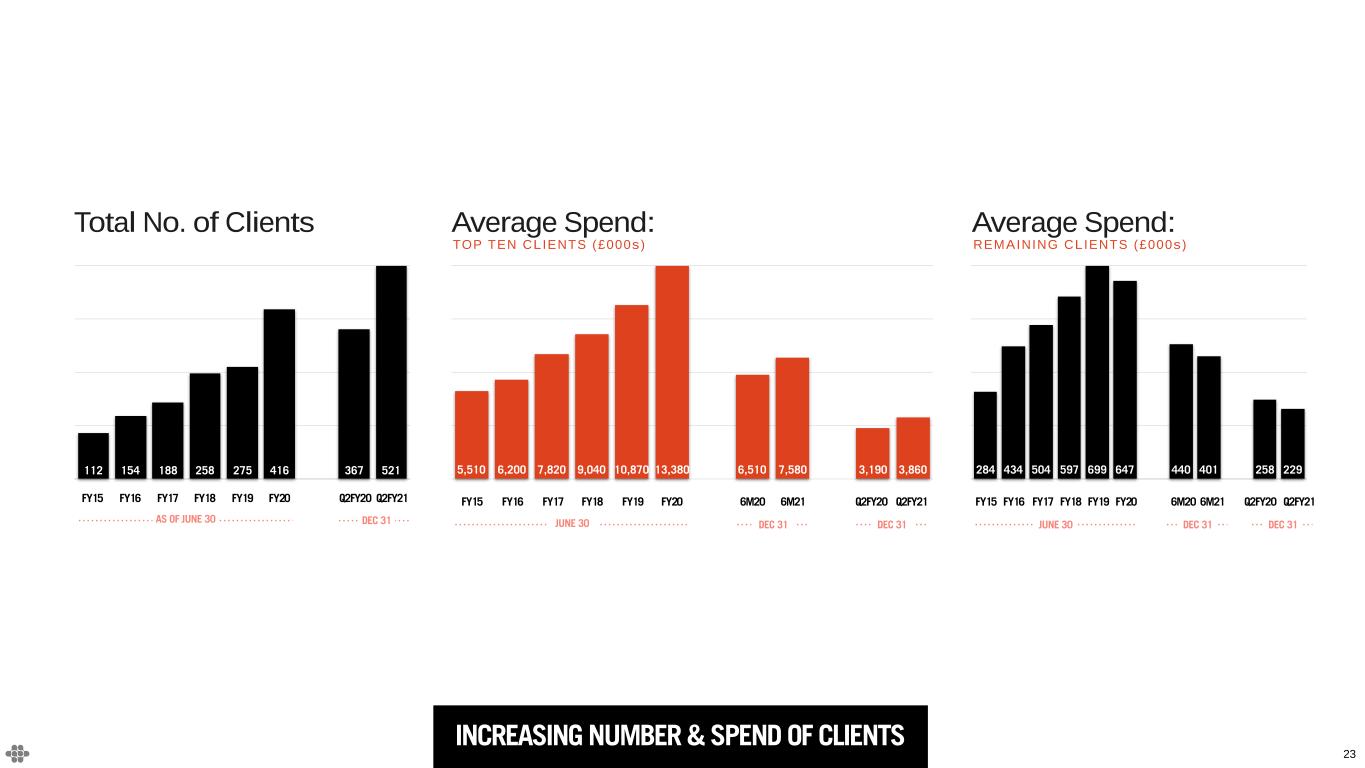
23 INCREASING NUMBER & SPEND OF CLIENTS FY15 FY16 FY17 FY17 FY17 FY20 _ FY17 FY18 521367416275258188154112 FY15 FY16 FY17 FY18 FY18 FY18 - Q218 Q219 Q218 Q219 229258401440647699597504434284 0 3345 6690 10035 13380 FY15 FY16 FY17 FY18 FY19 FY20 Q218 Q219 Q218 Q219 3,8603,1907,5806,51013,38010,8709,0407,8206,2005,510 FY15 FY16 FY17 JUNE 30 FY18 6M20 6M21FY19 DEC 31 FY20 Q2FY20 Q2FY21 DEC 31 Total No. of Clients Average Spend: TOP TEN CLIENTS (£000s) Average Spend: REMAINING CLIENTS (£000s) FY15 FY16 FY17 AS OF JUNE 30 FY18 FY19 Q2FY20 Q2FY21 DEC 31 FY20 FY15 FY16 FY17 JUNE 30 FY18 Q2FY20 Q2FY21FY19 DEC 31 FY20 6M20 6M21 DEC 31

DIVERSE REVENUE BASE: GEOGRAPHY & INDUSTRY VERTICALS 23% 28% 49% PAYMENTS AND FINANCIAL SERVICES TECHNOLOGY, MEDIA & TELECOMMUNICATIONS OTHER REVENUE % BY VERTICAL Q2 FY21 FY15 FY16 FY17 FY18 FY19 FY20 _ FY19 FY20 0.30.20.3 29%29%29% 27% 21% 16%18% 10% 27% 23%24%28%34% 34% 18% 12% 42%45%44%45%45%50%64%78% UK EUROPE N.AMERICA RoW * FY15 FY16 FY17 JUNE 30 DEC 31 Q2FY20 Q2FY21FY18 FY19 2% 24 * Other includes consumer products,
healthcare, mobility and retail verticals Revenue by Region 3% FY20 3%
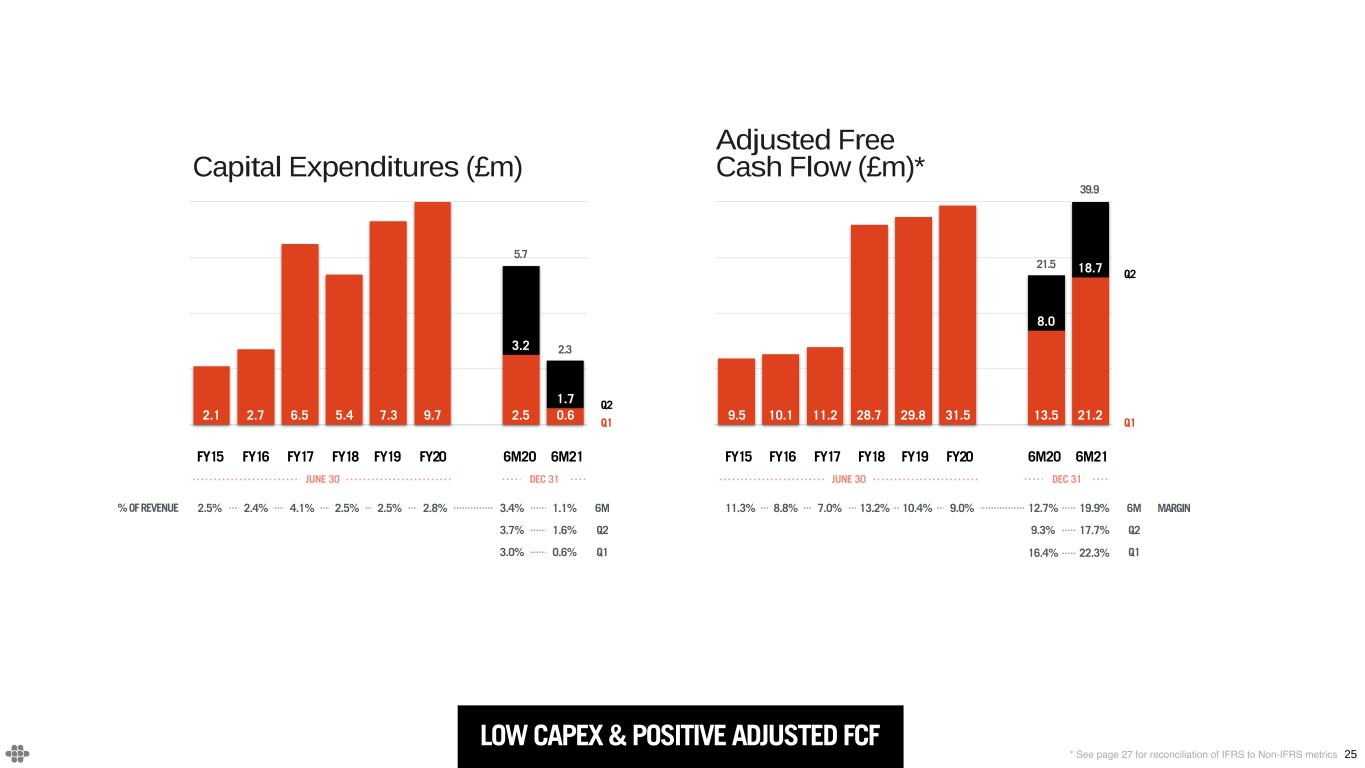
LOW CAPEX & POSITIVE ADJUSTED FCF 0.00 8.00 16.00 24.00 32.00 FY15 FY16 FY17 FY18 FY18 FY20 _ FY17 FY18 18.7 8.0 21.213.531.529.828.711.210.19.5 FY15 FY17 FY18 _ FY18 1.7 3.2 0.62.59.77.35.46.52.72.1 MARGIN FY15 FY16 FY17 6M20 6M21FY18 % OF REVENUE 11.3% 8.8% 7.0% 12.7% 19.9% FY15 FY16 FY17 JUNE 30 FY18 13.2%2.5% 2.4% 4.1% 3.4% 1.1%2.5% JUNE 30 DEC 31 FY19 2.5% FY19 10.4% 25* See page 27 for reconciliation of IFRS to Non-IFRS metrics Capital Expenditures (£m) Adjusted Free Cash Flow (£m)* FY20 2.8% FY20 9.0% DEC 31 6M20 6M21 39.9 21.5 2.3 5.7 3.7% 1.6% 3.0% 0.6% 6M Q2 Q1 9.3% 17.7% 16.4% 22.3% 6M Q2 Q1 Q1 Q2 Q1 Q2

3 Appendix Q2 FY2021 26
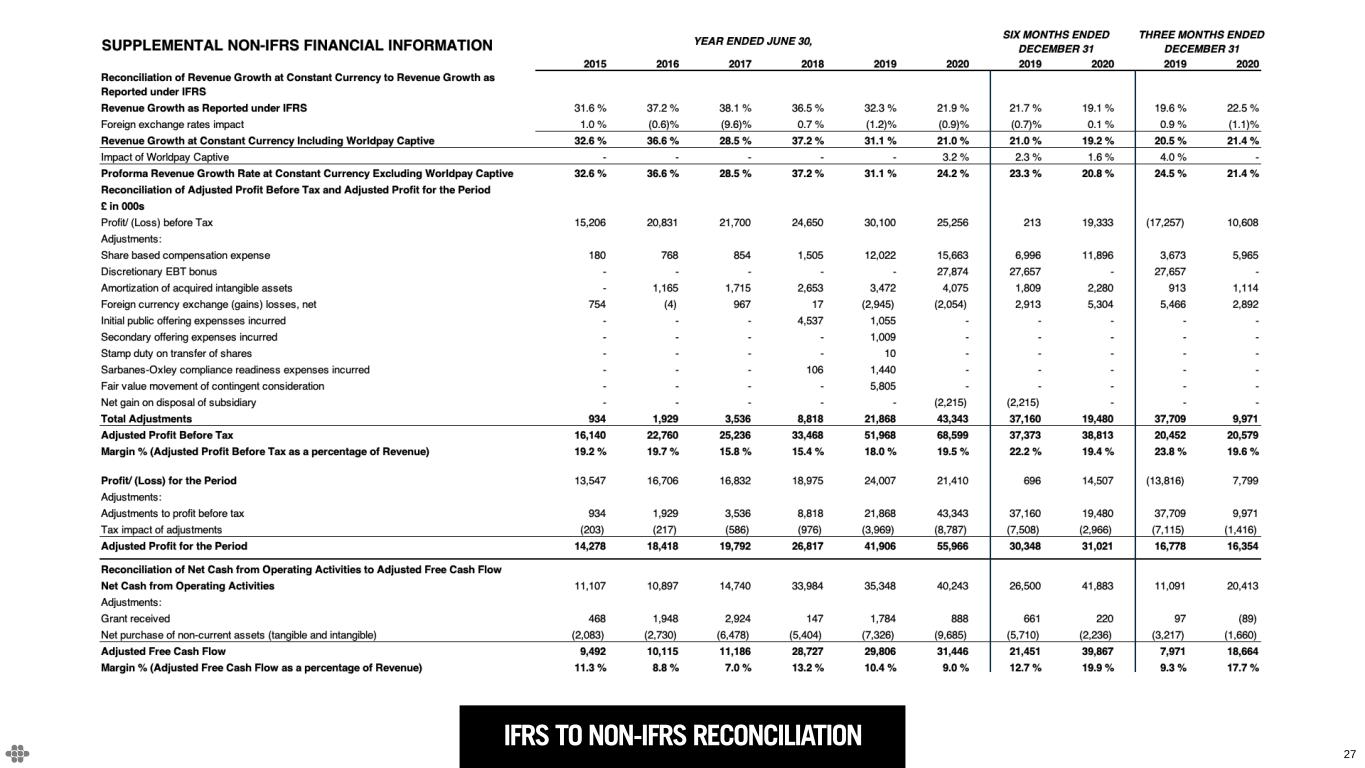
27 IFRS TO NON-IFRS RECONCILIATION
