EX-99.2
Published on February 29, 2024

Investor presentation Q2 FY2024
3 This presentation includes forward-looking statements within the meaning of the Private Securities Litigation Reform Act of 1995. All statements contained in this presentation, other than statements of historical facts, are forward-looking statements. The words “believe,” “estimate,” “expect,” “may,” “will” and similar expressions are intended to identify forward-looking statements. Such forward-looking statements include, but are not limited to, the statements regarding our business strategy and our plans and objectives for future operations, our addressable market and perceived growth over next five years, our assumptions regarding industry trends, potential technological disruptions, and client demand for our services. Forward-looking statements involve known and unknown risks, uncertainties and other factors that could cause actual results to differ materially from the results anticipated by these forward-looking statements, including, but not limited to: our business, results of operations and financial condition may be negatively impacted by the Russian-Ukraine military conflict and related sanctions, conflict in the Middle East or if general economic conditions in Europe, the United States or the global economy worsens, including increased inflation and recent and potential future bank failures; and the perceived impact and effect of macroeconomic conditions on Endava and its customers including the March 2023 banking collapse; our ability to retain existing clients and attract new clients, including our ability to increase revenue from existing clients and diversify our revenue concentration; our ability to attract and retain highly-skilled IT professionals at cost-effective rates; our ability to penetrate new industry verticals and geographies and grow our revenue in current industry verticals and geographies; our ability to maintain favourable pricing and utilisation rates; our ability to successfully identify acquisition targets, consummate acquisitions and successfully integrate acquired businesses and personnel; the effects of increased competition as well as innovations by new and existing competitors in our market; our ability to adapt to technological change and innovate solutions for our clients; our ability to collect on billed and unbilled receivables from clients; our ability to effectively manage our international operations, including our exposure to foreign currency exchange rate fluctuations; our ability to remediate the identified material weaknesses and maintain an effective system of disclosure controls and internal control over financial reporting and our future financial performance, including trends in revenue, cost of sales, gross profit, selling, general and administrative expenses, finance income and expense and taxes, as well as other risks and uncertainties discussed in the “Risk Factors” section of our Annual Report on Form 20-F filed with the Securities and Exchange Commission (the “SEC”) on September 19, 2023. Except as required by law, we assume no duty to update any of these forward-looking statements after the date of this presentation to conform these statements to actual results or revised expectations. You should, therefore, not rely on these forward-looking statements as representing our views as of any date subsequent to the date of this presentation. Moreover, except as required by law, neither we nor any other person assumes responsibility for the accuracy and completeness of the forward-looking statements contained in this presentation. This presentation also contains estimates and other statistical data made by independent parties and by us relating to market size and growth and other data about our industry. This data involves a number of assumptions and limitations, and you are cautioned not to give undue weight to such estimates. Neither we nor any other person makes any representation as to the accuracy or completeness of such data or undertakes any obligation to update such data after the date of this presentation. In addition, projections, assumptions and estimates of our future performance and the future performance of the markets in which we operate are necessarily subject to a high degree of uncertainty and risk. By attending or receiving this presentation you acknowledge that you will be solely responsible for your own assessment of the market and our market position and that you will conduct your own analysis and be solely responsible for forming your own view of the potential future performance of our business. This presentation includes non-IFRS financial measures which have certain limitations and should not be considered in isolation, or as alternatives to or substitutes for, financial measures determined in accordance with IFRS. The non-IFRS measures as defined by us may not be comparable to similar non- IFRS measures presented by other companies. Our presentation of such measures, which may include adjustments to exclude unusual or non-recurring items, should not be construed as an inference that our future results will be unaffected by these or other unusual or non-recurring items. See the IFRS to Non-IFRS Reconciliation section for a reconciliation of these non- IFRS financial measures to the most directly comparable IFRS financial measures. Disclaimer
Technology is our how. And people are our why. For over two decades, we have been harnessing technology to drive meaningful change. By combining world-class engineering, industry expertise and a people-centric mindset, we consult and partner with our customers to create technological solutions that drive innovation and transform businesses.

Opportunity & Approach 01
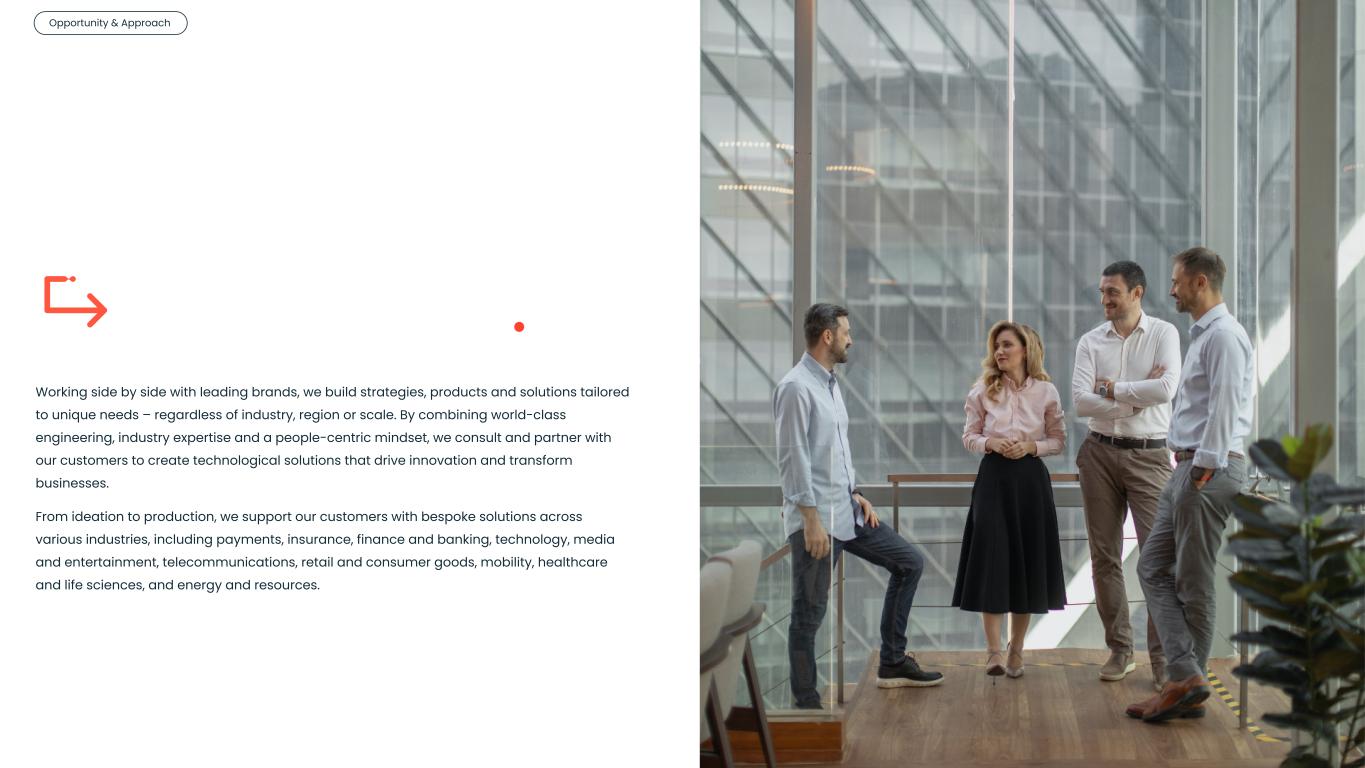
Investor Relations 6 We transform lives through technology. Working side by side with leading brands, we build strategies, products and solutions tailored to unique needs – regardless of industry, region or scale. By combining world-class engineering, industry expertise and a people-centric mindset, we consult and partner with our customers to create technological solutions that drive innovation and transform businesses. From ideation to production, we support our customers with bespoke solutions across various industries, including payments, insurance, finance and banking, technology, media and entertainment, telecommunications, retail and consumer goods, mobility, healthcare and life sciences, and energy and resources. Opportunity & Approach
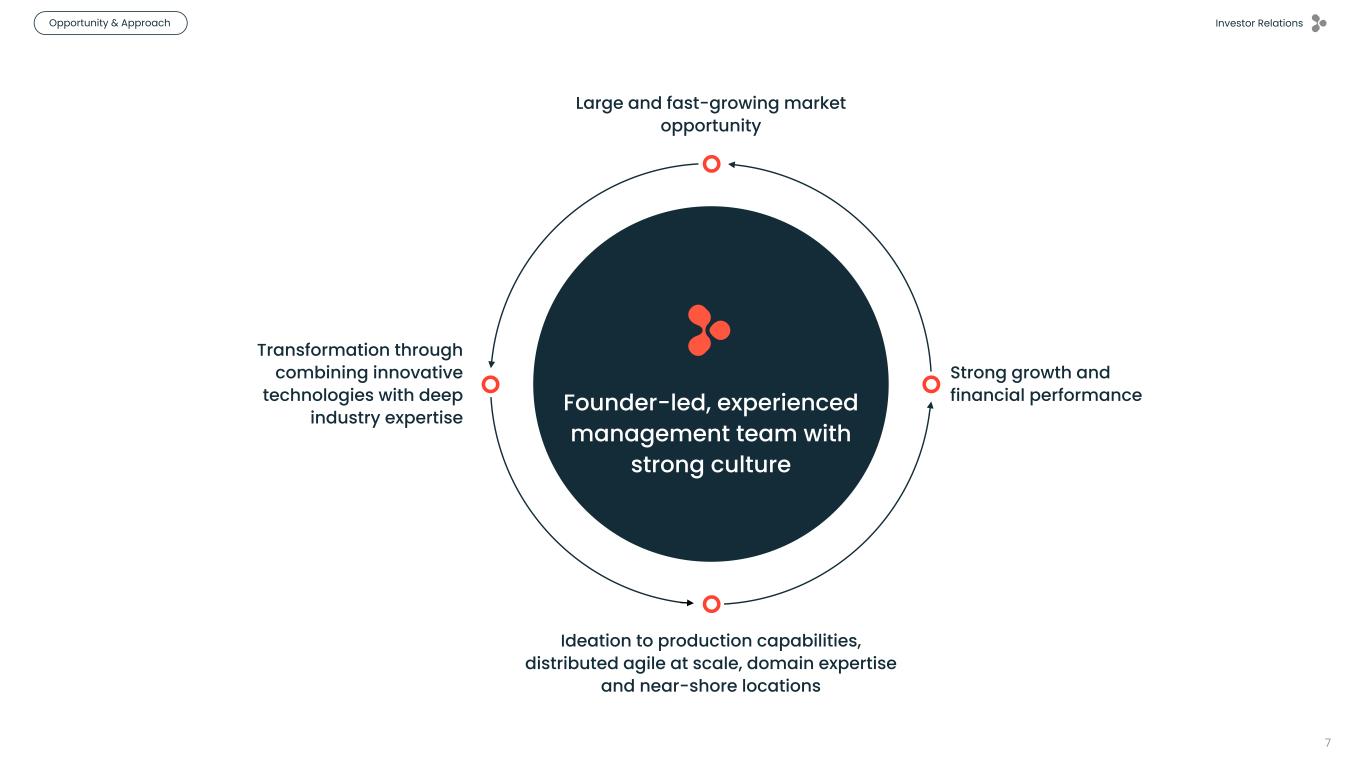
Investor Relations Opportunity & Approach 7 Large and fast-growing market opportunity Transformation through combining innovative technologies with deep industry expertise Founder-led, experienced management team with strong culture Strong growth and financial performance Ideation to production capabilities, distributed agile at scale, domain expertise and near-shore locations
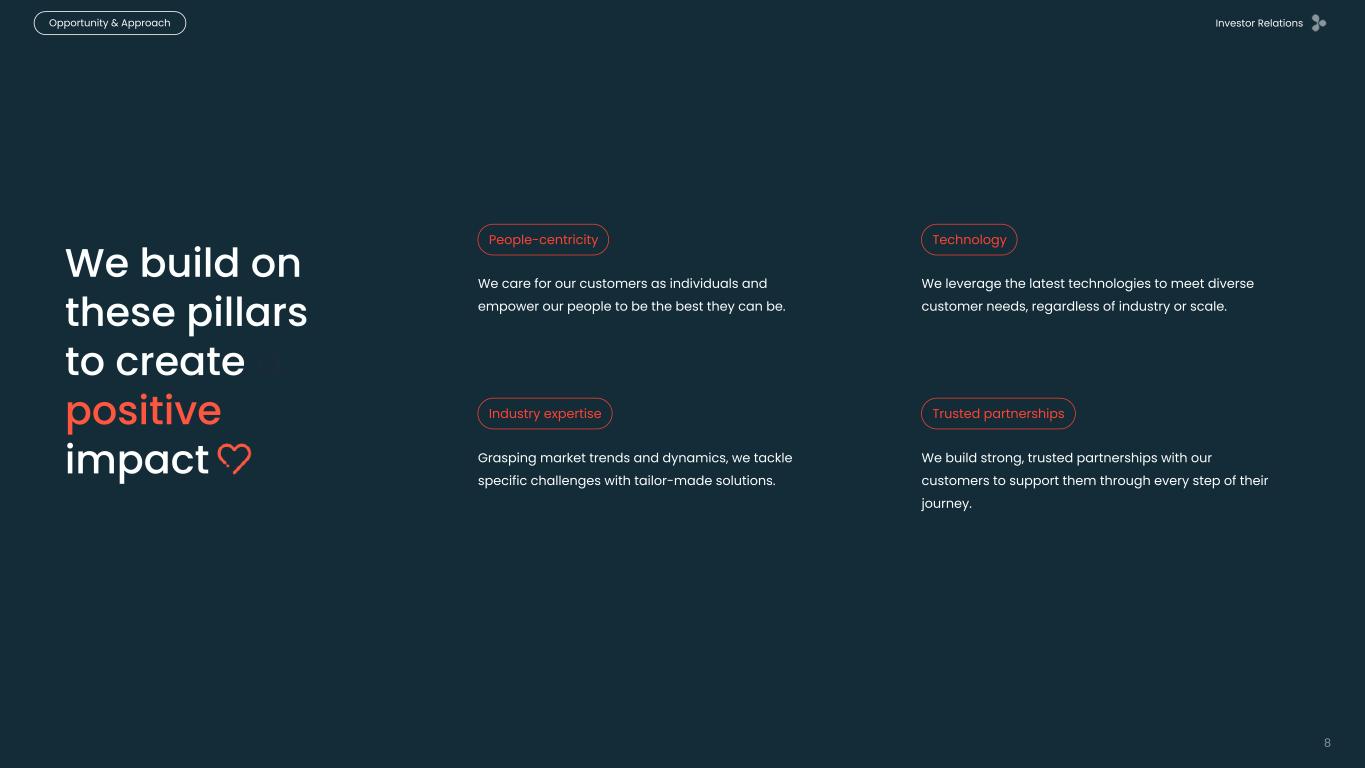
Investor Relations 8 We build on these pillars to create a positive impact We care for our customers as individuals and empower our people to be the best they can be. People-centricity We leverage the latest technologies to meet diverse customer needs, regardless of industry or scale. Technology Grasping market trends and dynamics, we tackle specific challenges with tailor-made solutions. We build strong, trusted partnerships with our customers to support them through every step of their journey. Industry expertise Trusted partnerships Opportunity & Approach

Investor Relations We serve a large addressable market. IDC Worldwide Digital Transformation Spending Guide, October 2022 update. $3.4T 2026 16.3% Five-year CAGR for digital transformation investments Opportunity & Approach 9
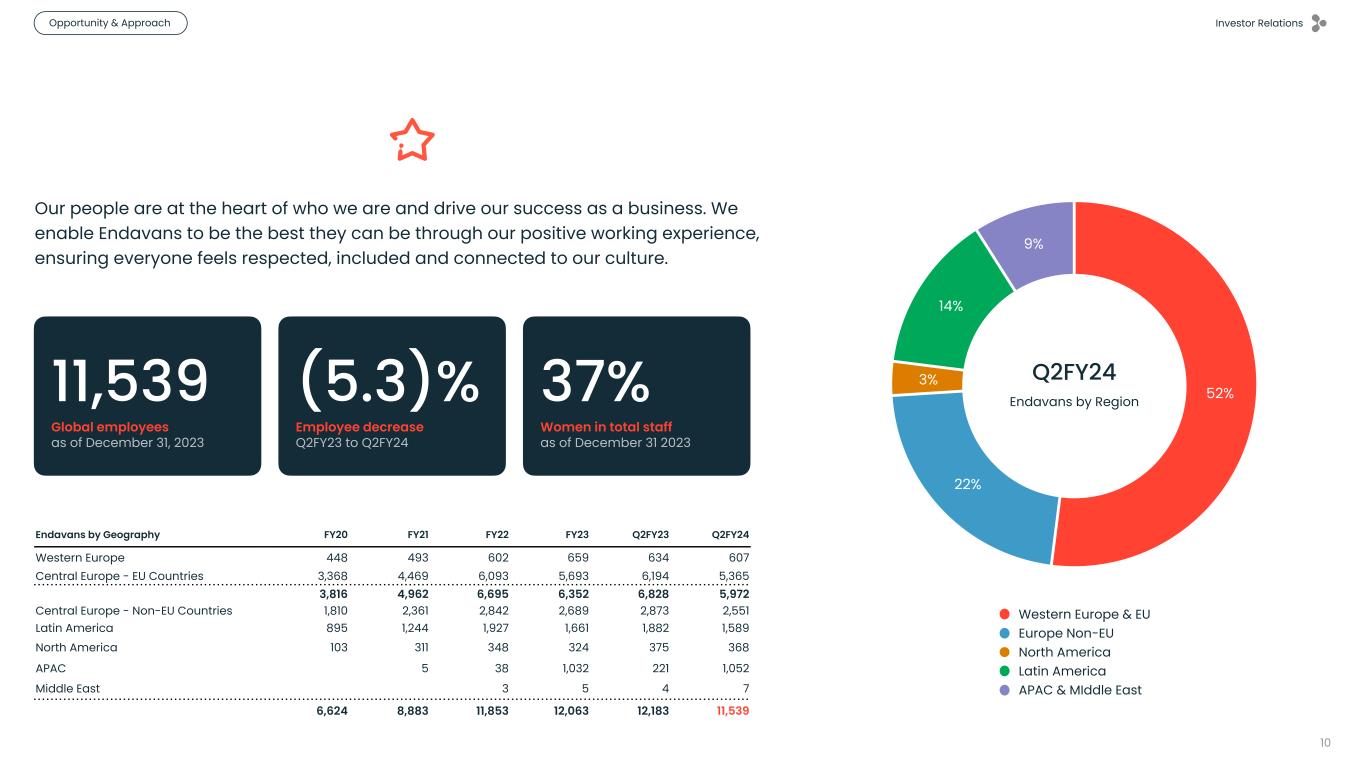
Investor Relations 10 9% 14% 3% 22% 52% Western Europe & EU Europe Non-EU North America Latin America APAC & MIddle East Q2FY24 Endavans by Region Endavans by Geography FY20 FY21 FY22 FY23 Q2FY23 Q2FY24 Western Europe 448 493 602 659 634 607 Central Europe - EU Countries 3,368 4,469 6,093 5,693 6,194 5,365 3,816 4,962 6,695 6,352 6,828 5,972 Central Europe - Non-EU Countries 1,810 2,361 2,842 2,689 2,873 2,551 Latin America 895 1,244 1,927 1,661 1,882 1,589 North America 103 311 348 324 375 368 APAC 5 38 1,032 221 1,052 Middle East 3 5 4 7 6,624 8,883 11,853 12,063 12,183 11,539 (5.3)% Employee decrease Q2FY23 to Q2FY24 11,539 Global employees as of December 31, 2023 37% Women in total staff as of December 31 2023 Our people are at the heart of who we are and drive our success as a business. We enable Endavans to be the best they can be through our positive working experience, ensuring everyone feels respected, included and connected to our culture. Endavans Opportunity & Approach
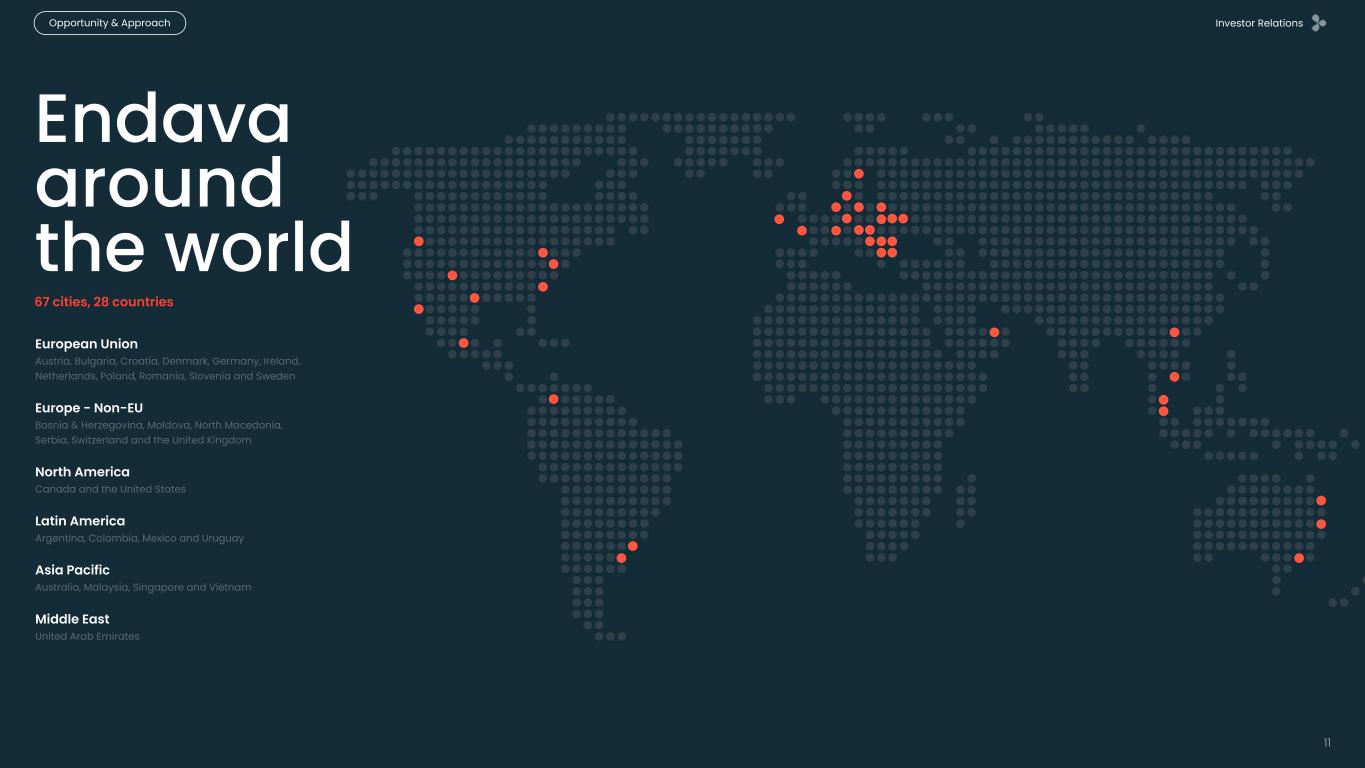
Investor Relations 11 Endava around the world 67 cities, 28 countries European Union Austria, Bulgaria, Croatia, Denmark, Germany, Ireland, Netherlands, Poland, Romania, Slovenia and Sweden Europe - Non-EU Bosnia & Herzegovina, Moldova, North Macedonia, Serbia, Switzerland and the United Kingdom North America Canada and the United States Latin America Argentina, Colombia, Mexico and Uruguay Asia Pacific Australia, Malaysia, Singapore and Vietnam Middle East United Arab Emirates Opportunity & Approach
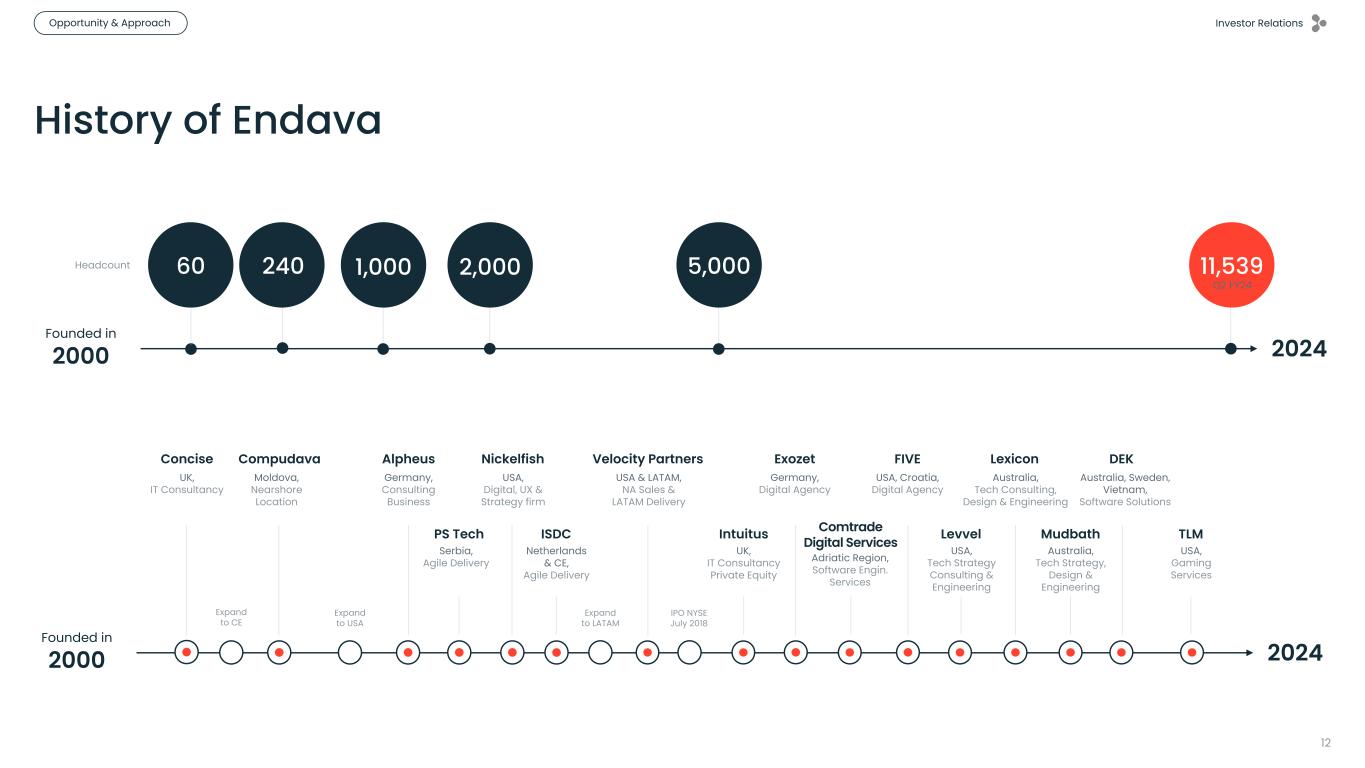
Investor Relations 12 Founded in 2000 Expand to CE Concise UK, IT Consultancy Expand to USA Expand to LATAM IPO NYSE July 2018 Compudava Moldova, Nearshore Location Alpheus Germany, Consulting Business Nickelfish USA, Digital, UX & Strategy firm Velocity Partners USA & LATAM, NA Sales & LATAM Delivery PS Tech Serbia, Agile Delivery ISDC Netherlands & CE, Agile Delivery Intuitus UK, IT Consultancy Private Equity Exozet Germany, Digital Agency Comtrade Digital Services Adriatic Region, Software Engin. Services FIVE USA, Croatia, Digital Agency Levvel USA, Tech Strategy Consulting & Engineering Lexicon Australia, Tech Consulting, Design & Engineering Mudbath Australia, Tech Strategy, Design & Engineering Australia, Sweden, Vietnam, Software Solutions DEK TLM USA, Gaming Services 2024 History of Endava 11,539 Founded in 2000 60 240 1,000 2,000Headcount Q2 FY24 5,000 2024 Opportunity & Approach
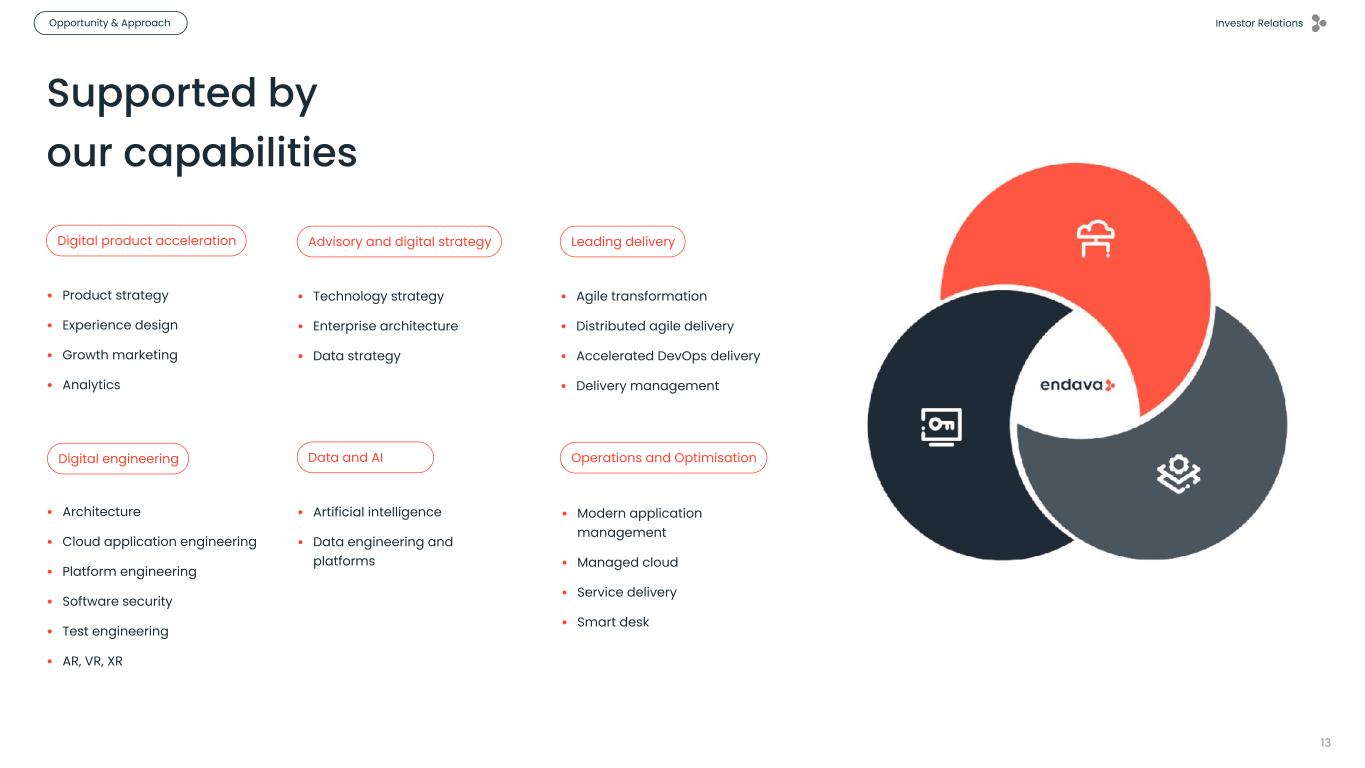
Investor Relations • Modern application management • Managed cloud • Service delivery • Smart desk • Architecture • Cloud application engineering • Platform engineering • Software security • Test engineering • AR, VR, XR • Artificial intelligence • Data engineering and platforms Data and AI Advisory and digital strategy • Technology strategy • Enterprise architecture • Data strategy 13 Supported by our capabilities • Product strategy • Experience design • Growth marketing • Analytics Digital product acceleration • Agile transformation • Distributed agile delivery • Accelerated DevOps delivery • Delivery management Leading delivery Operations and OptimisationDigital engineering Opportunity & Approach
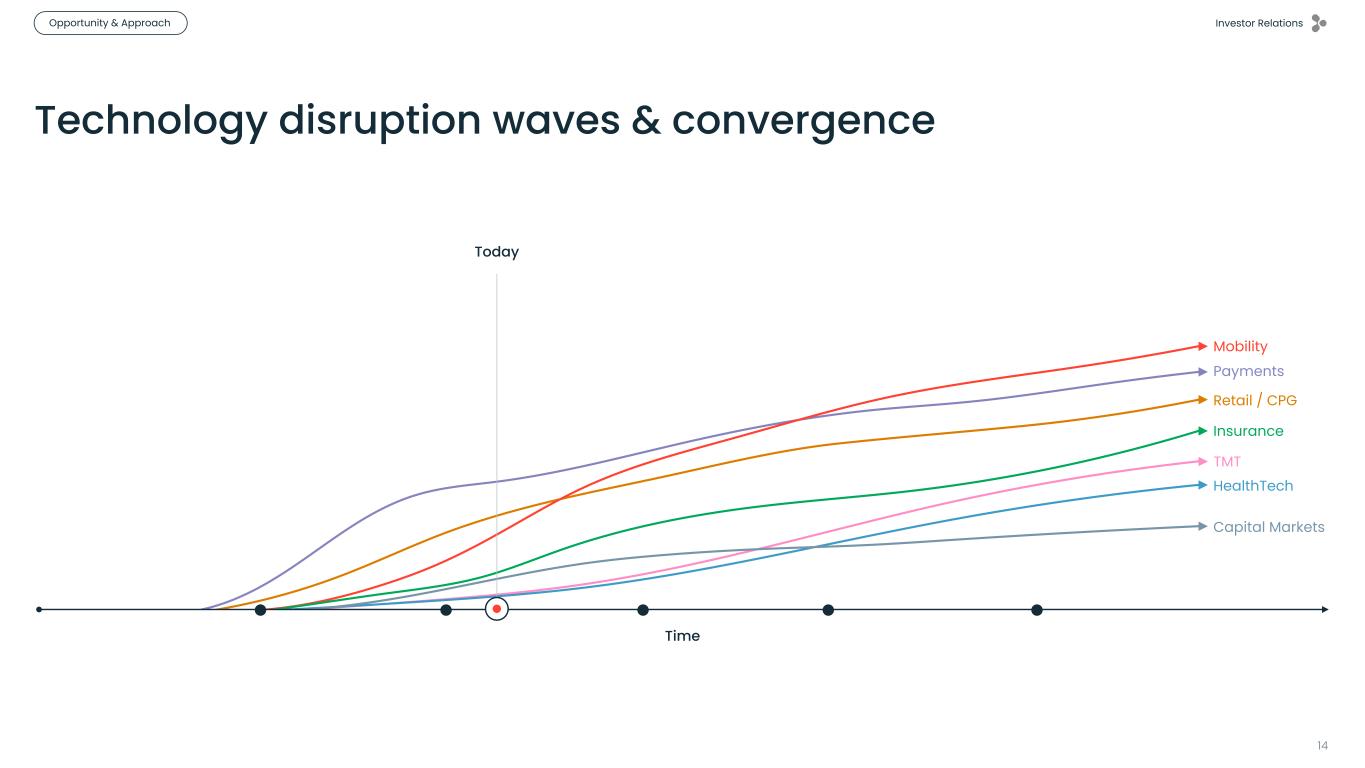
Investor Relations 14 Today Time Payments Retail / CPG HealthTech Insurance Capital Markets Mobility Technology disruption waves & convergence TMT Opportunity & Approach
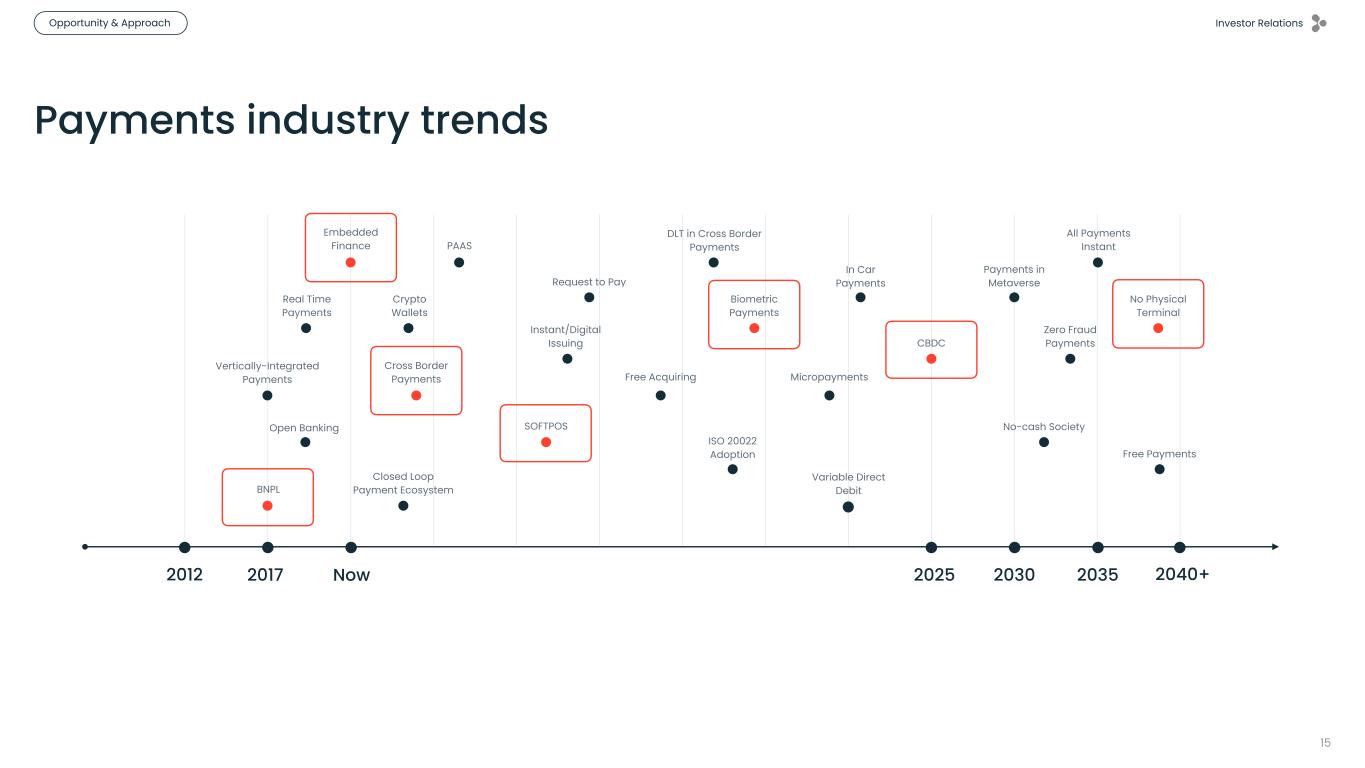
Investor Relations 15 2012 2017 Now 2030 2040+20352025 Open Banking Real Time Payments Crypto Wallets Instant/Digital Issuing DLT in Cross Border Payments Closed Loop Payment Ecosystem ISO 20022 Adoption Vertically-Integrated Payments Micropayments In Car Payments Payments in Metaverse All Payments Instant No-cash Society Zero Fraud Payments Free Payments PAAS Free Acquiring Request to Pay Variable Direct Debit Cross Border Payments BNPL Embedded Finance SOFTPOS Biometric Payments CBDC No Physical Terminal Payments industry trends Opportunity & Approach
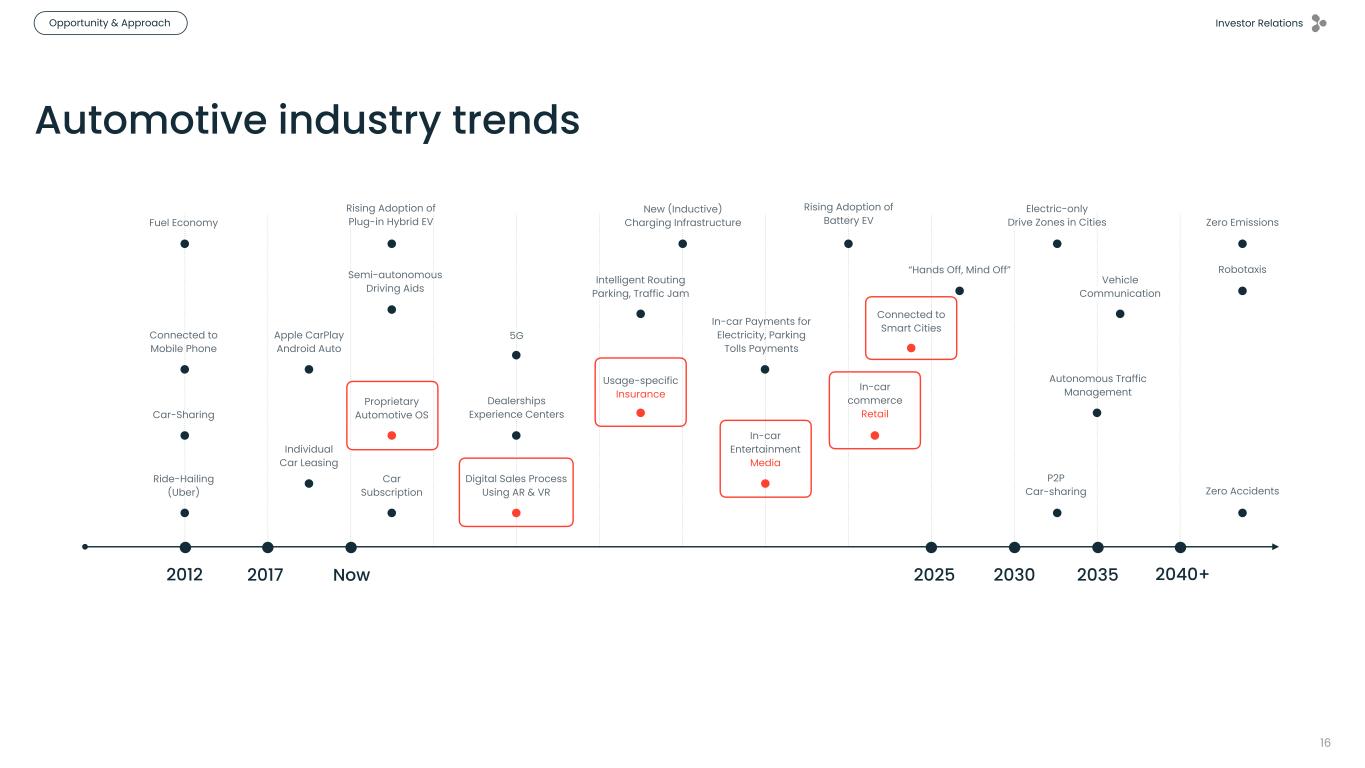
Investor Relations 16 2012 2017 Now 2030 2040+20352025 Automotive industry trends Fuel Economy Individual Car Leasing Apple CarPlay Android Auto Semi-autonomous Driving Aids Car Subscription Intelligent Routing Parking, Traffic Jam 5G New (Inductive) Charging Infrastructure In-car Payments for Electricity, Parking Tolls Payments Connected to Mobile Phone Dealerships Experience CentersCar-Sharing Ride-Hailing (Uber) Rising Adoption of Plug-in Hybrid EV “Hands Off, Mind Off” Rising Adoption of Battery EV Electric-only Drive Zones in Cities Vehicle Communication P2P Car-sharing Autonomous Traffic Management Robotaxis Zero Emissions Zero Accidents Proprietary Automotive OS Digital Sales Process Using AR & VR Usage-specific Insurance In-car Entertainment Media In-car commerce Retail Connected to Smart Cities Opportunity & Approach
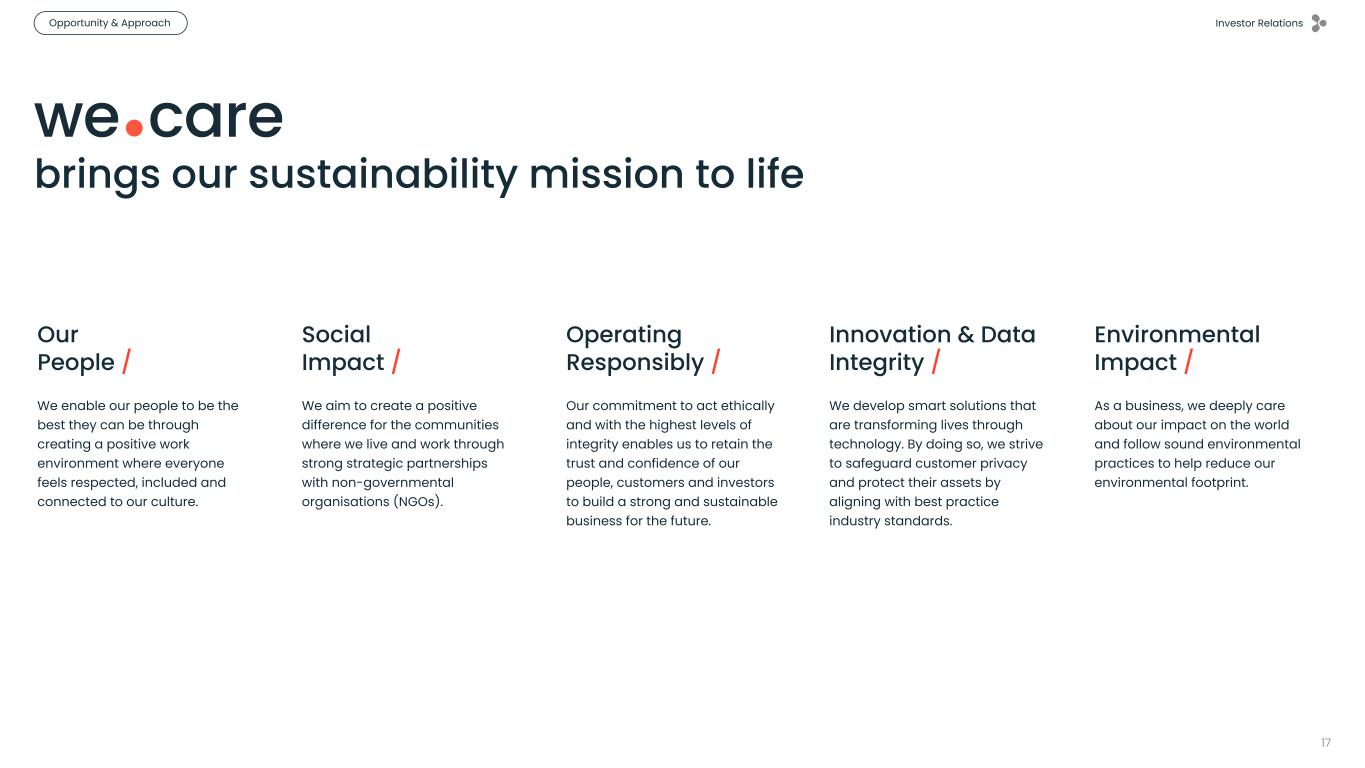
Investor Relations 17 Our People / We enable our people to be the best they can be through creating a positive work environment where everyone feels respected, included and connected to our culture. Social Impact / We aim to create a positive difference for the communities where we live and work through strong strategic partnerships with non-governmental organisations (NGOs). Operating Responsibly / Our commitment to act ethically and with the highest levels of integrity enables us to retain the trust and confidence of our people, customers and investors to build a strong and sustainable business for the future. Innovation & Data Integrity / We develop smart solutions that are transforming lives through technology. By doing so, we strive to safeguard customer privacy and protect their assets by aligning with best practice industry standards. Environmental Impact / As a business, we deeply care about our impact on the world and follow sound environmental practices to help reduce our environmental footprint. brings our sustainability mission to life Opportunity & Approach

Financials02
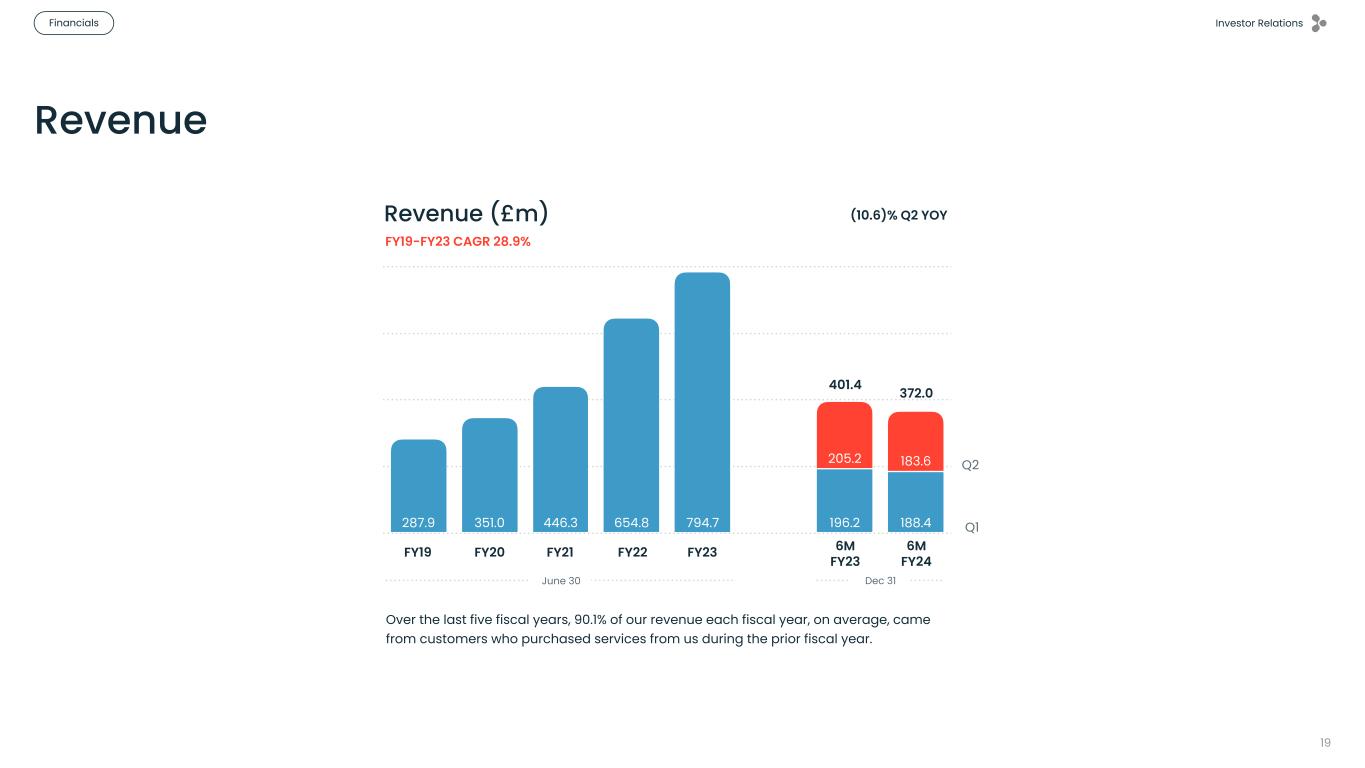
Investor Relations Financials 19 FY19 FY20 FY21 FY22 FY23 _ FY23 FY24 183.6205.2 188.4196.2794.7654.8446.3351.0287.9 FY19-FY23 CAGR 28.9% Over the last five fiscal years, 90.1% of our revenue each fiscal year, on average, came from customers who purchased services from us during the prior fiscal year. June 30 Dec 31 6M FY23 6M FY24 (10.6)% Q2 YOYRevenue (£m) Q1 Q2 372.0 401.4 Revenue

Investor Relations Financials 20 Profitability FY19 FY20 FY21 FY22 FY23 _ FY23 FY24 10.6 20.3 17.338.6114.2102.454.423.429.1 F 1 June 30 Dec 31 6M FY23 6M FY24 F F 1 Profit before tax (£m) F F Q1 Q2 27.9 58.8 Margin 10.1% 6.7% 12.2% 15.6% 14.4% Q29.9% 5.8% 19.7% 9.2% Q1 6M14.7% 7.5% FY19 FY20 FY21 FY22 FY23 _ FY23 FY24 22.7 43.0 29.839.5164.2138.392.166.751.0 FY19-FY23 CAGR 34% F 1 June 30 Dec 31 6M FY23 6M FY24 F F 1 Adjusted profit before tax F F Q1 Q2 52.5 82.5 Margin 17.7% 19.0% 20.6% 21.1% 20.7% Q220.9% 12.4% 20.1% 15.8% Q1 6M20.5% 14.1% * See page 26 for reconciliation of IFRS to Non-IFRS metrics
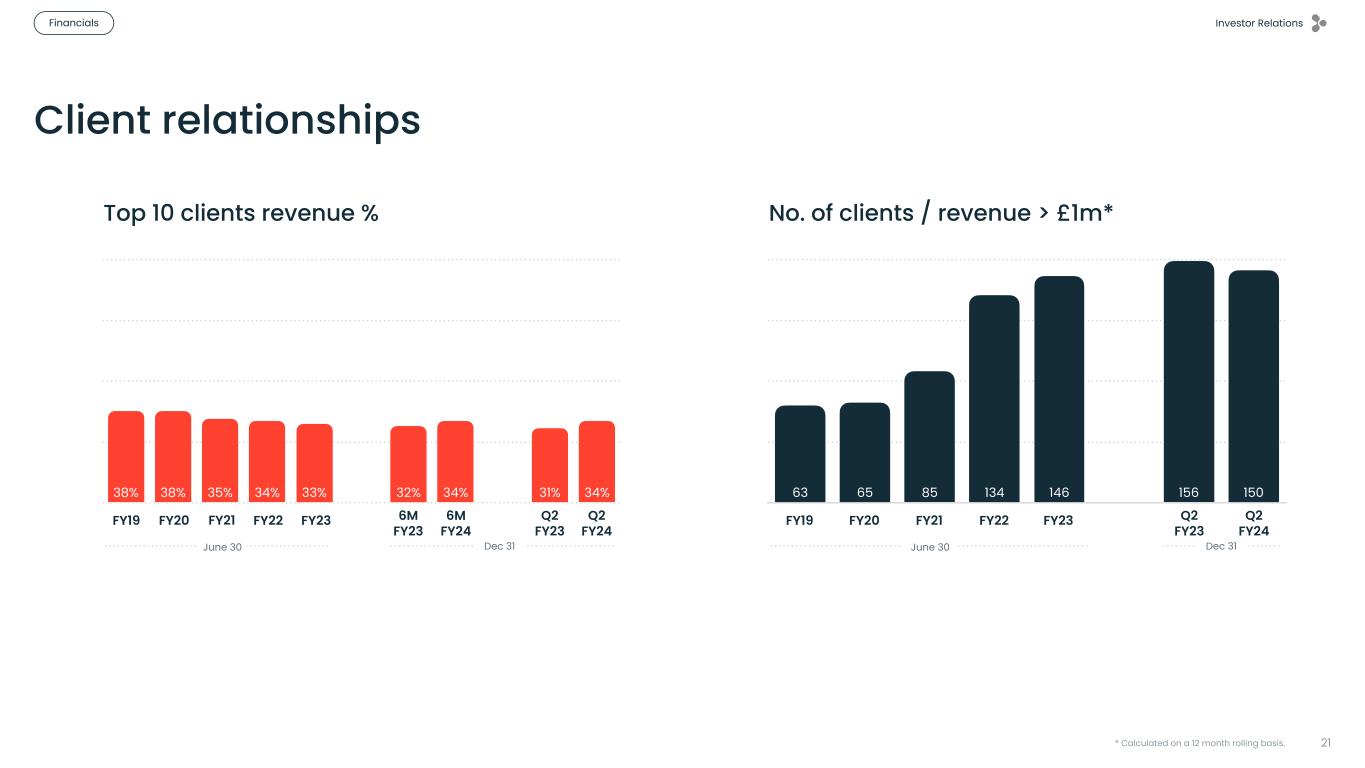
Investor Relations Financials 21 Client relationships FY19 FY21 FY23 6M FY23 Q2FY24 34%31%34%32%33%34%35%38%38% F 1 June 30 Dec 31 Q2 FY23 Q2 FY24 FY20 F 21 Top 10 clients revenue % FY22 F 6M FY23 6M FY24 FY19 FY20 FY20 FY21 FY22 _ Q2FY23 Q2FY24 150156146134856563 F 1 June 30 Dec 31 Q2 FY23 Q2 FY24 F F 1 No. of clients / revenue > £1m* F 2 F 3 * Calculated on a 12 month rolling basis.
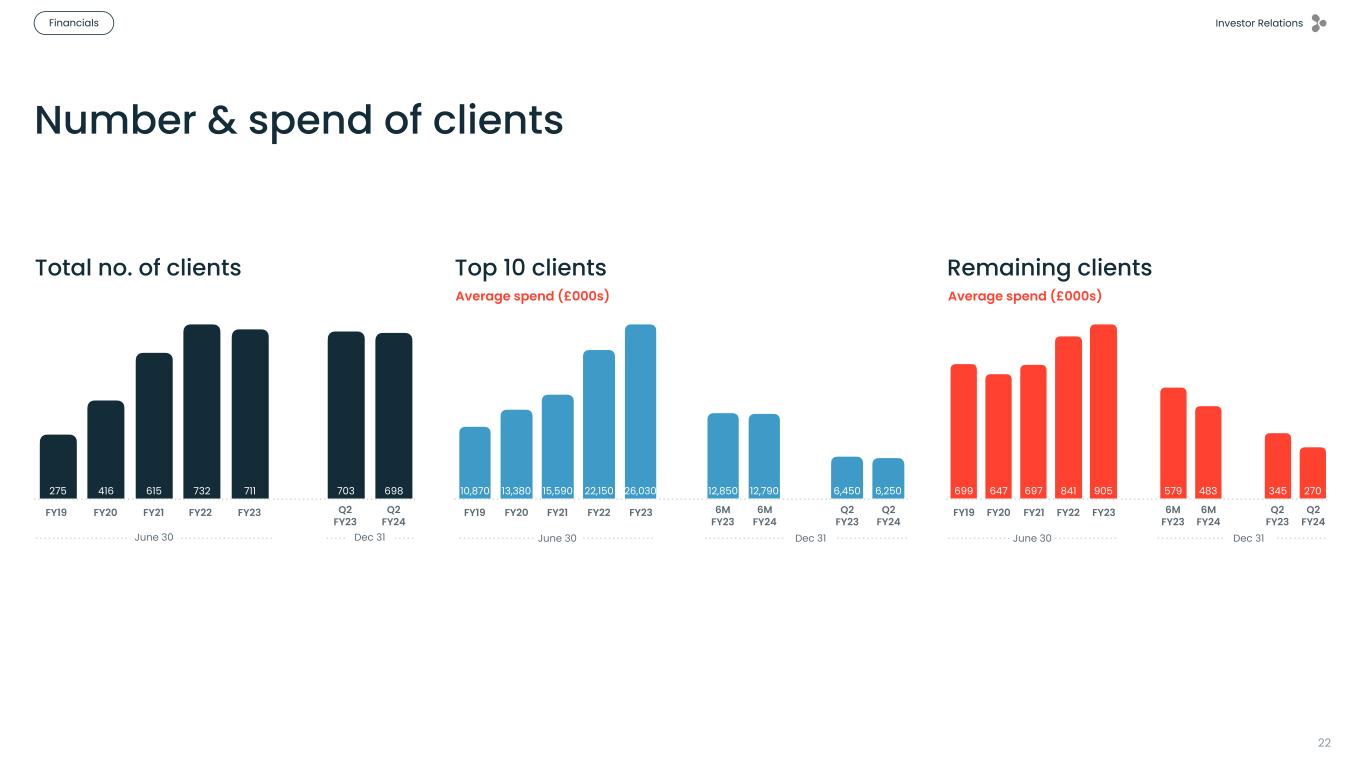
Investor Relations Financials 22 Number & spend of clients FY19 FY20 FY22 Q2FY23 698703711732615416275 June 30 Dec 31 Q2 FY23 Q2 FY24 FY20 FY21 FY22 FY23FY19 Total no. of clients FY19 FY21 FY23 6M FY23 Q2FY24 6,2506,45012,79012,85026,03022,15015,59013,38010,870 June 30 Dec 31 Q2 FY23 Q2 FY24 FY20 FY21 FY22 FY23FY19 Average spend (£000s) Top 10 clients 6M FY23 6M FY24 FY19 FY21 FY22 6M FY23 Q2FY24 270345483579905841697647699 June 30 Dec 31 Q2 FY23 Q2 FY24 FY20 FY21 FY22 FY23FY19 Average spend (£000s) Remaining clients 6M FY23 6M FY24
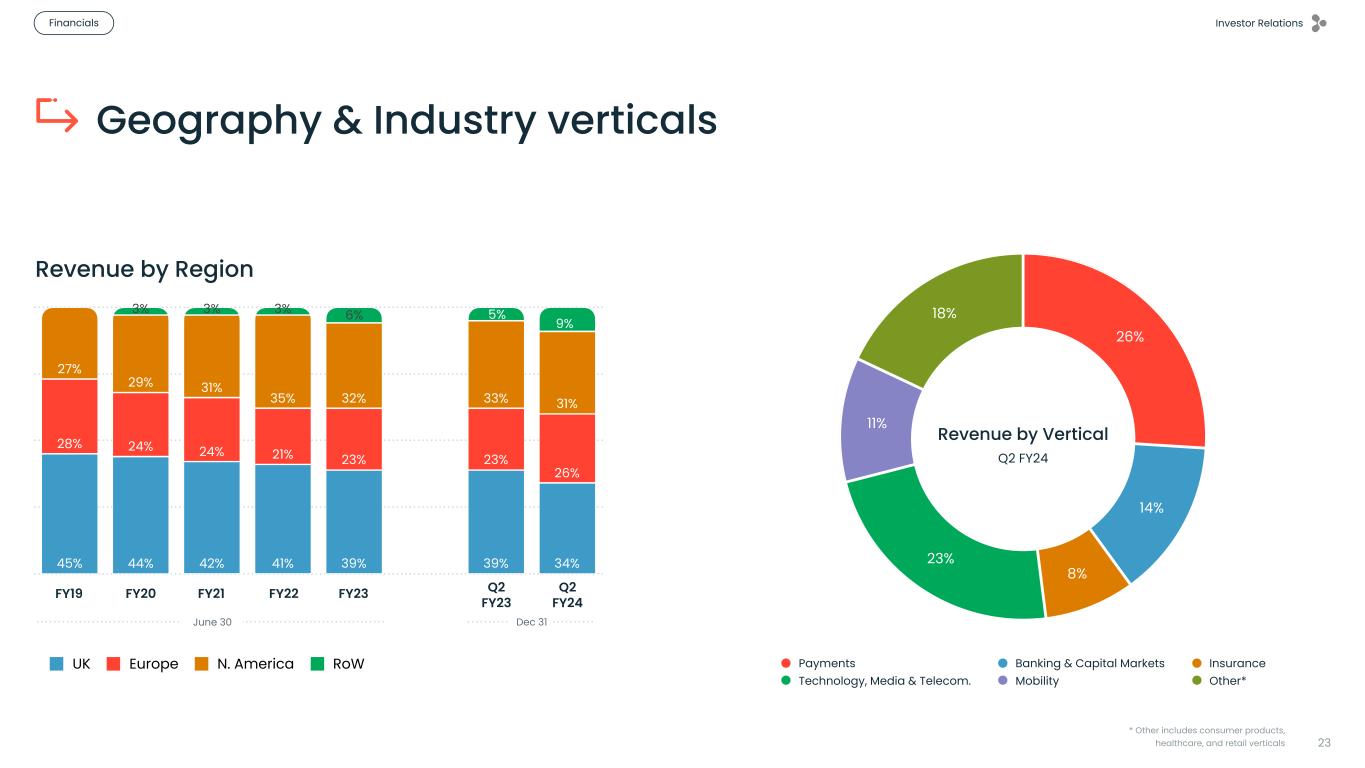
Investor Relations Financials 23 FY19 FY20 FY21 FY22 FY23 _ Q2FY23 Q2FY24 31%33%32%35% 31%29% 27% 26% 23%23%21%24%24%28% 34%39%39%41%42%44%45% UK Europe N. America RoW June 30 Dec 31 Q2 FY23 Q2 FY24 Revenue by Region Geography & Industry verticals 3% 3% 3% 6% 9% * Other includes consumer products, healthcare, and retail verticals 18% 11% 23% 8% 14% 26% Payments Banking & Capital Markets Insurance Technology, Media & Telecom. Mobility Other* Revenue by Vertical Q2 FY24 5%
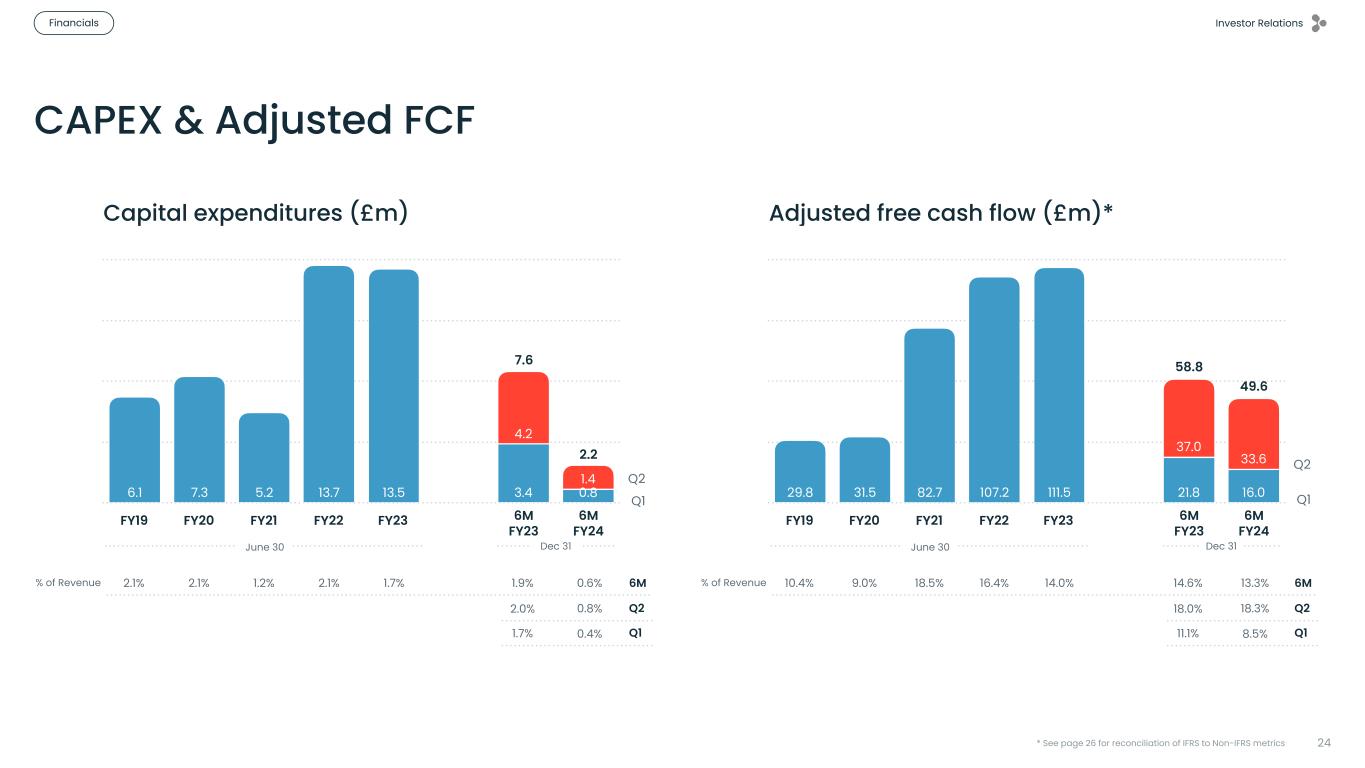
Investor Relations Financials 24 CAPEX & Adjusted FCF FY19 FY20 FY21 FY22 FY23 _ FY23 FY24 1.4 4.2 0.83.413.513.75.27.36.1 F 1 June 30 Dec 31 6M FY23 6M FY24 F F 1 Capital expenditures (£m) F F Q1 Q2 2.2 7.6 % of Revenue 2.1% 2.1% 1.2% 2.1% 1.7% Q22.0% 0.8% 1.7% 0.4% Q1 6M1.9% 0.6% FY19 FY20 FY21 FY22 FY23 _ FY23 FY24 33.6 37.0 16.021.8111.5107.282.731.529.8 F 1 June 30 Dec 31 6M FY23 6M FY24 F F 1 Adjusted free cash flow (£m)* F F Q1 Q2 49.6 58.8 % of Revenue 10.4% 9.0% 18.5% 16.4% 14.0% Q218.0% 18.3% 11.1% 8.5% Q1 6M14.6% 13.3% * See page 26 for reconciliation of IFRS to Non-IFRS metrics

Appendix03
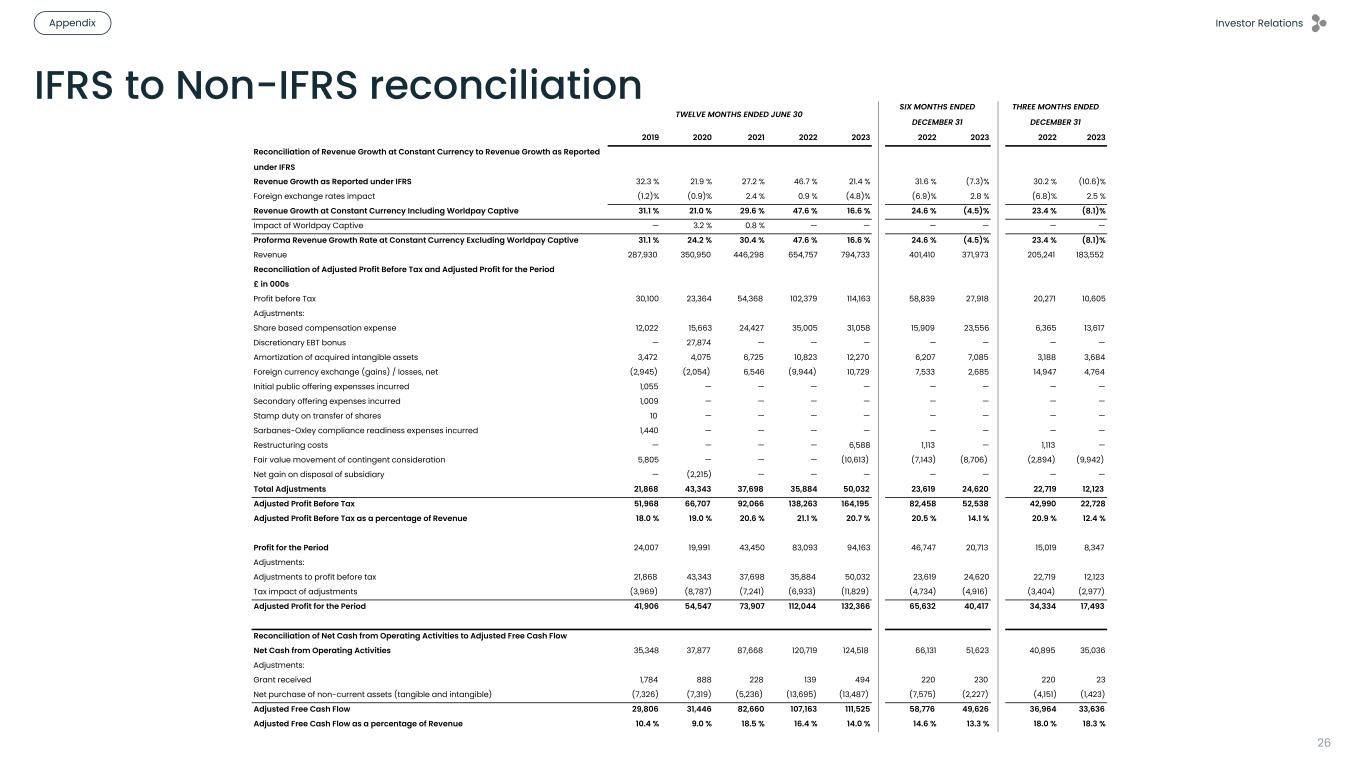
Investor Relations Appendix 26 IFRS to Non-IFRS reconciliation 2019 2020 2021 2022 2023 2022 2023 2022 2023 Reconciliation of Revenue Growth at Constant Currency to Revenue Growth as Reported under IFRS Revenue Growth as Reported under IFRS 32.3 % 21.9 % 27.2 % 46.7 % 21.4 % 31.6 % (7.3)% 30.2 % (10.6)% Foreign exchange rates impact (1.2)% (0.9)% 2.4 % 0.9 % (4.8)% (6.9)% 2.8 % (6.8)% 2.5 % Revenue Growth at Constant Currency Including Worldpay Captive 31.1 % 21.0 % 29.6 % 47.6 % 16.6 % 24.6 % (4.5)% 23.4 % (8.1)% Impact of Worldpay Captive — 3.2 % 0.8 % — — — — — — Proforma Revenue Growth Rate at Constant Currency Excluding Worldpay Captive 31.1 % 24.2 % 30.4 % 47.6 % 16.6 % 24.6 % (4.5)% 23.4 % (8.1)% Revenue 287,930 350,950 446,298 654,757 794,733 401,410 371,973 205,241 183,552 Reconciliation of Adjusted Profit Before Tax and Adjusted Profit for the Period £ in 000s Profit before Tax 30,100 23,364 54,368 102,379 114,163 58,839 27,918 20,271 10,605 Adjustments: Share based compensation expense 12,022 15,663 24,427 35,005 31,058 15,909 23,556 6,365 13,617 Discretionary EBT bonus — 27,874 — — — — — — — Amortization of acquired intangible assets 3,472 4,075 6,725 10,823 12,270 6,207 7,085 3,188 3,684 Foreign currency exchange (gains) / losses, net (2,945) (2,054) 6,546 (9,944) 10,729 7,533 2,685 14,947 4,764 Initial public offering expensses incurred 1,055 — — — — — — — — Secondary offering expenses incurred 1,009 — — — — — — — — Stamp duty on transfer of shares 10 — — — — — — — — Sarbanes-Oxley compliance readiness expenses incurred 1,440 — — — — — — — — Restructuring costs — — — — 6,588 1,113 — 1,113 — Fair value movement of contingent consideration 5,805 — — — (10,613) (7,143) (8,706) (2,894) (9,942) Net gain on disposal of subsidiary — (2,215) — — — — — — — Total Adjustments 21,868 43,343 37,698 35,884 50,032 23,619 24,620 22,719 12,123 Adjusted Profit Before Tax 51,968 66,707 92,066 138,263 164,195 82,458 52,538 42,990 22,728 Adjusted Profit Before Tax as a percentage of Revenue 18.0 % 19.0 % 20.6 % 21.1 % 20.7 % 20.5 % 14.1 % 20.9 % 12.4 % Profit for the Period 24,007 19,991 43,450 83,093 94,163 46,747 20,713 15,019 8,347 Adjustments: Adjustments to profit before tax 21,868 43,343 37,698 35,884 50,032 23,619 24,620 22,719 12,123 Tax impact of adjustments (3,969) (8,787) (7,241) (6,933) (11,829) (4,734) (4,916) (3,404) (2,977) Adjusted Profit for the Period 41,906 54,547 73,907 112,044 132,366 65,632 40,417 34,334 17,493 Reconciliation of Net Cash from Operating Activities to Adjusted Free Cash Flow Net Cash from Operating Activities 35,348 37,877 87,668 120,719 124,518 66,131 51,623 40,895 35,036 Adjustments: Grant received 1,784 888 228 139 494 220 230 220 23 Net purchase of non-current assets (tangible and intangible) (7,326) (7,319) (5,236) (13,695) (13,487) (7,575) (2,227) (4,151) (1,423) Adjusted Free Cash Flow 29,806 31,446 82,660 107,163 111,525 58,776 49,626 36,964 33,636 Adjusted Free Cash Flow as a percentage of Revenue 10.4 % 9.0 % 18.5 % 16.4 % 14.0 % 14.6 % 13.3 % 18.0 % 18.3 % TWELVE MONTHS ENDED JUNE 30 SIX MONTHS ENDED DECEMBER 31 THREE MONTHS ENDED DECEMBER 31
