EX-99.2
Published on September 4, 2025
© Copyright 2025 Endava

Investor presentation Q4 FY2025
© Copyright 2025 Endava Disclaimer This presentation includes forward-looking statements within the meaning of the Private Securities Litigation Reform Act of 1995. All statements contained in this presentation, other than statements of historical facts, are forward-looking statements. The words “believe,” “estimate,” “expect,” “may,” “will” and similar expressions are intended to identify forward-looking statements. Such forward-looking statements include, but are not limited to, the statements regarding our business strategy and our plans and objectives for future operations, our estimated addressable market, our assumptions regarding industry trends, potential technological disruptions, and client demand for our services. Forward-looking statements involve known and unknown risks, uncertainties and other factors that could cause actual results to differ materially from the results anticipated by these forward-looking statements, including, but not limited to: our ability to achieve its revenue growth goals including as a result of a slower conversion of its pipeline; our expectations of future operating results or financial performance; our ability to accurately forecast and achieve its announced guidance; our ability to retain existing clients and attract new clients, including its ability to increase revenue from existing clients and diversify its revenue concentration; our ability to attract and retain highly-skilled IT professionals at cost-effective rates; our ability to successfully identify acquisition targets, consummate acquisitions and successfully integrate acquired businesses and personnel; our ability to penetrate new industry verticals and geographies and grow its revenue in current industry verticals and geographies; our ability to maintain favourable pricing and utilisation rates to support its gross margin; the effects of increased competition as well as innovations by new and existing competitors in its market; the size of our addressable market and market trends; our ability to adapt to technological change and industry trends and innovate solutions for its clients; our plans for growth and future operations, including its ability to manage its growth; our ability to effectively manage its international operations, including our exposure to foreign currency exchange rate fluctuations; our future financial performance; the impact of unstable market, economic and global conditions, as well as other risks and uncertainties discussed in the “Risk Factors” section of our Annual Report on Form 20-F for the year ended June 30, 2025 filed with the SEC on September 4, 2025 and in other filings that we make from time to time with the SEC. Except as required by law, we assume no duty to update any of these forward-looking statements after the date of this presentation to conform these statements to actual results or revised expectations. You should, therefore, not rely on these forward-looking statements as representing our views as of any date subsequent to the date of this presentation. Moreover, except as required by law, neither we nor any other person assumes responsibility for the accuracy and completeness of the forward-looking statements contained in this presentation. This presentation also contains estimates and other statistical data made by independent parties and by us relating to market size and growth and other data about our industry. This data involves a number of assumptions and limitations, and you are cautioned not to give undue weight to such estimates. Neither we nor any other person makes any representation as to the accuracy or completeness of such data or undertakes any obligation to update such data after the date of this presentation. In addition, projections, assumptions and estimates of our future performance and the future performance of the markets in which we operate are necessarily subject to a high degree of uncertainty and risk. By attending or receiving this presentation you acknowledge that you will be solely responsible for your own assessment of the market and our market position and that you will conduct your own analysis and be solely responsible for forming your own view of the potential future performance of our business. This presentation includes non-IFRS financial measures which have certain limitations and should not be considered in isolation, or as alternatives to or substitutes for, financial measures determined in accordance with IFRS. The non-IFRS measures as defined by us may not be comparable to similar non- IFRS measures presented by other companies. Our presentation of such measures, which may include adjustments to exclude unusual or non-recurring items, should not be construed as an inference that our future results will be unaffected by these or other unusual or non-recurring items. See the IFRS to Non-IFRS Reconciliation section for a reconciliation of these non- IFRS financial measures to the most directly comparable IFRS financial measures. 3
Technology is our how. And people are our why. A new wave of AI-driven digital transformation is underway, and businesses must embrace a more digital core that enables the real-time usage of data to support the rapid and efficient delivery of new initiatives. At Endava, we’ve partnered with our customers over the last two decades to drive their digital agenda and we have upgraded our capabilities to align with their emerging needs. We combine our engineering heritage, digital transformation expertise and deep industry knowledge with new core modernisation capabilities to support our customers on their transformation journey. These enhanced capabilities provide the transparency and predictability needed to confidently shape the future and harness the leading technologies of tomorrow.

5 Opportunity & Approach 01

© Copyright 2025 Endava For over 25 years we’ve been helping our customers transform people’s lives through technology. Businesses use us as a trusted partner to help them leverage the latest ideas to modernise their business and digitally transform their interactions with their customers.
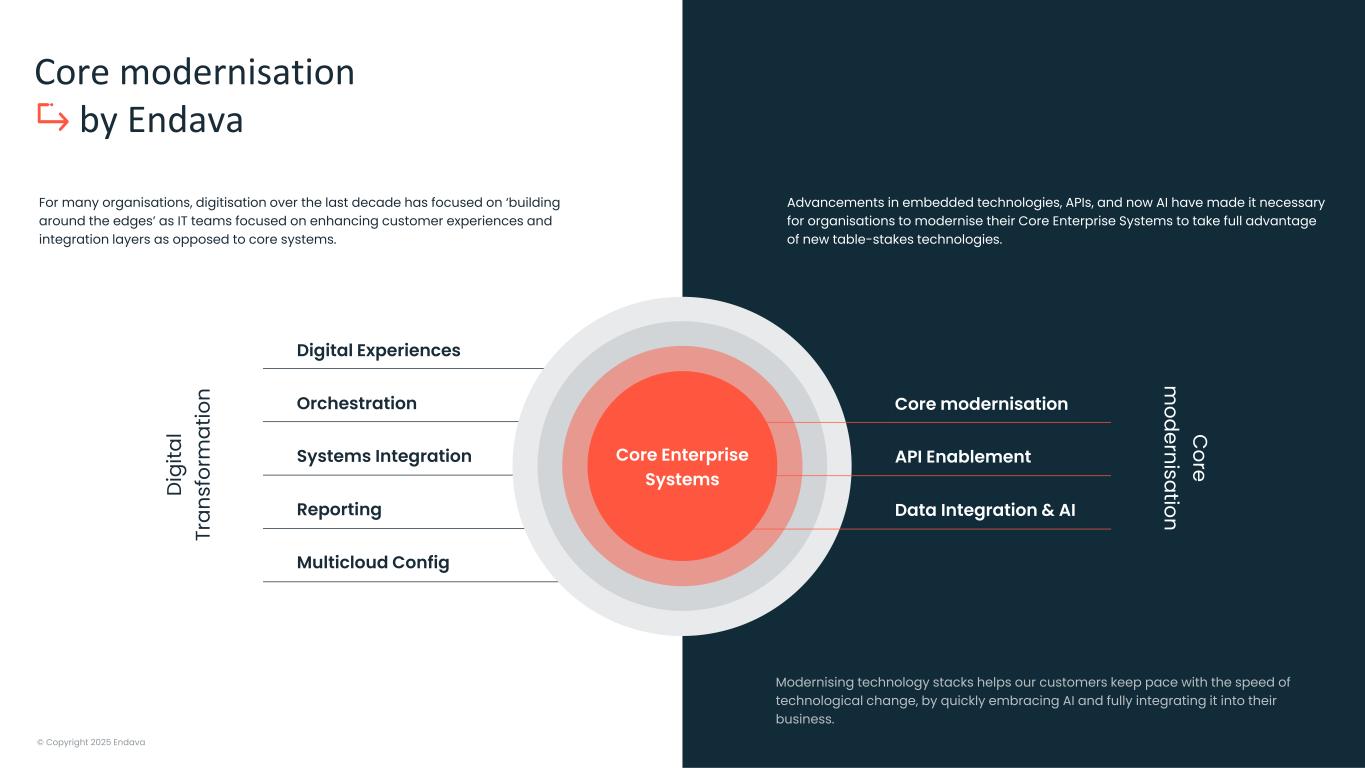
© Copyright 2025 Endava Digital Experiences Orchestration Reporting Systems Integration Multicloud Config Core modernisation by Endava Advancements in embedded technologies, APIs, and now AI have made it necessary for organisations to modernise their Core Enterprise Systems to take full advantage of new table-stakes technologies. Core Enterprise Systems For many organisations, digitisation over the last decade has focused on ‘building around the edges’ as IT teams focused on enhancing customer experiences and integration layers as opposed to core systems. Modernising technology stacks helps our customers keep pace with the speed of technological change, by quickly embracing AI and fully integrating it into their business. D ig ita l Tr an sf or m at io n C ore m odernisation Core modernisation Data Integration & AI API Enablement
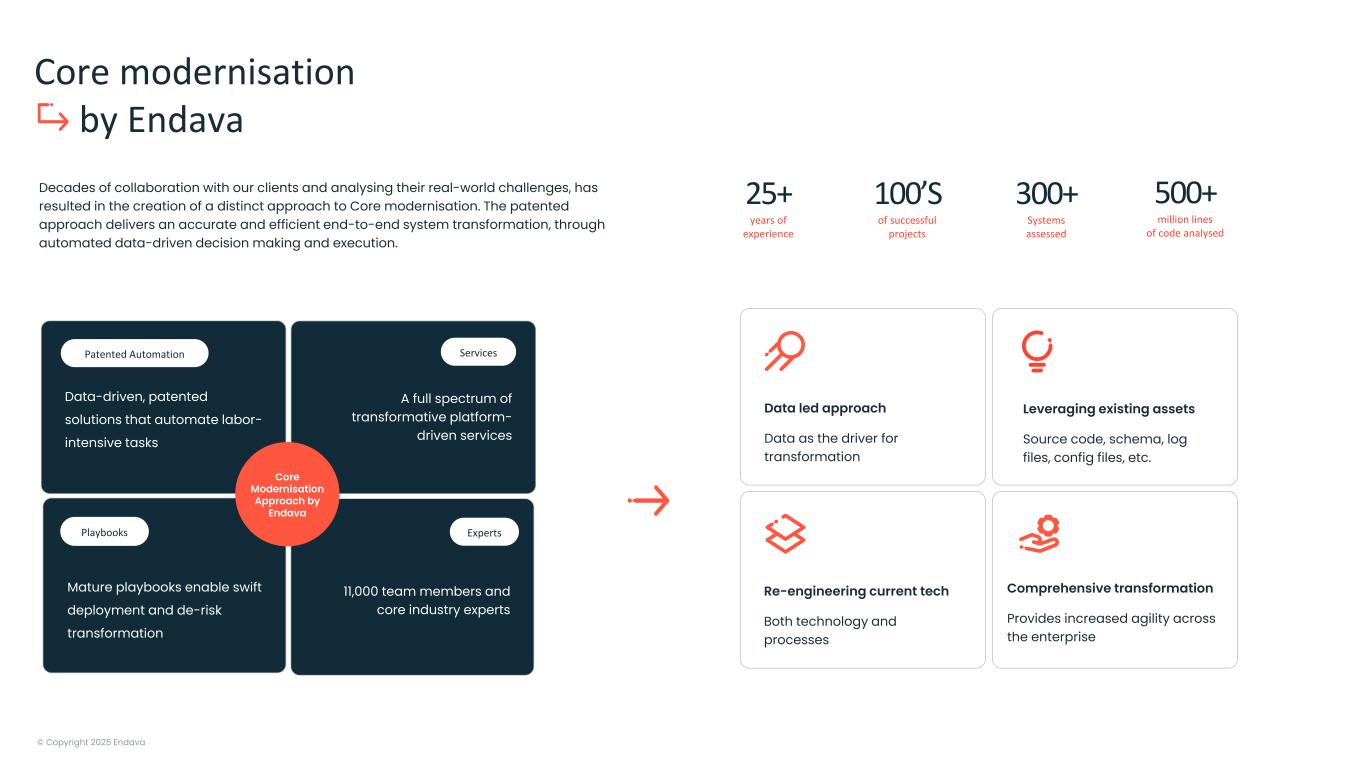
© Copyright 2025 Endava Core modernisation by Endava Decades of collaboration with our clients and analysing their real-world challenges, has resulted in the creation of a distinct approach to Core modernisation. The patented approach delivers an accurate and efficient end-to-end system transformation, through automated data-driven decision making and execution. Data-driven, patented solutions that automate labor- intensive tasks Mature playbooks enable swift deployment and de-risk transformation 11,000 team members and core industry experts A full spectrum of transformative platform- driven services ServicesPatented Automation ExpertsPlaybooks Core Modernisation Approach by Endava Data led approach Data as the driver for transformation Comprehensive transformation Provides increased agility across the enterprise Re-engineering current tech Both technology and processes Leveraging existing assets Source code, schema, log files, config files, etc. 25+ years of experience 100’S of successful projects 300+ Systems assessed 500+ million lines of code analysed
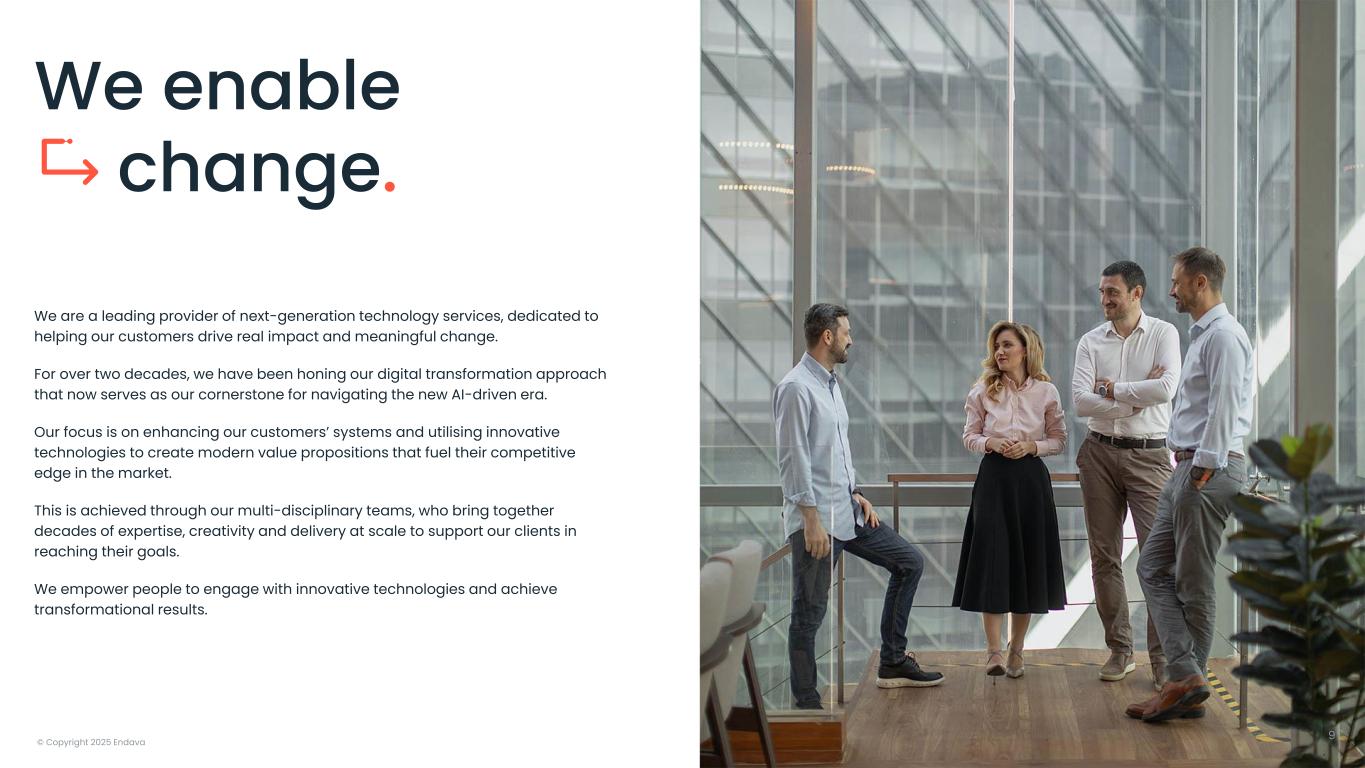
© Copyright 2025 Endava We enable change. We are a leading provider of next-generation technology services, dedicated to helping our customers drive real impact and meaningful change. For over two decades, we have been honing our digital transformation approach that now serves as our cornerstone for navigating the new AI-driven era. Our focus is on enhancing our customers’ systems and utilising innovative technologies to create modern value propositions that fuel their competitive edge in the market. This is achieved through our multi-disciplinary teams, who bring together decades of expertise, creativity and delivery at scale to support our clients in reaching their goals. We empower people to engage with innovative technologies and achieve transformational results. 9
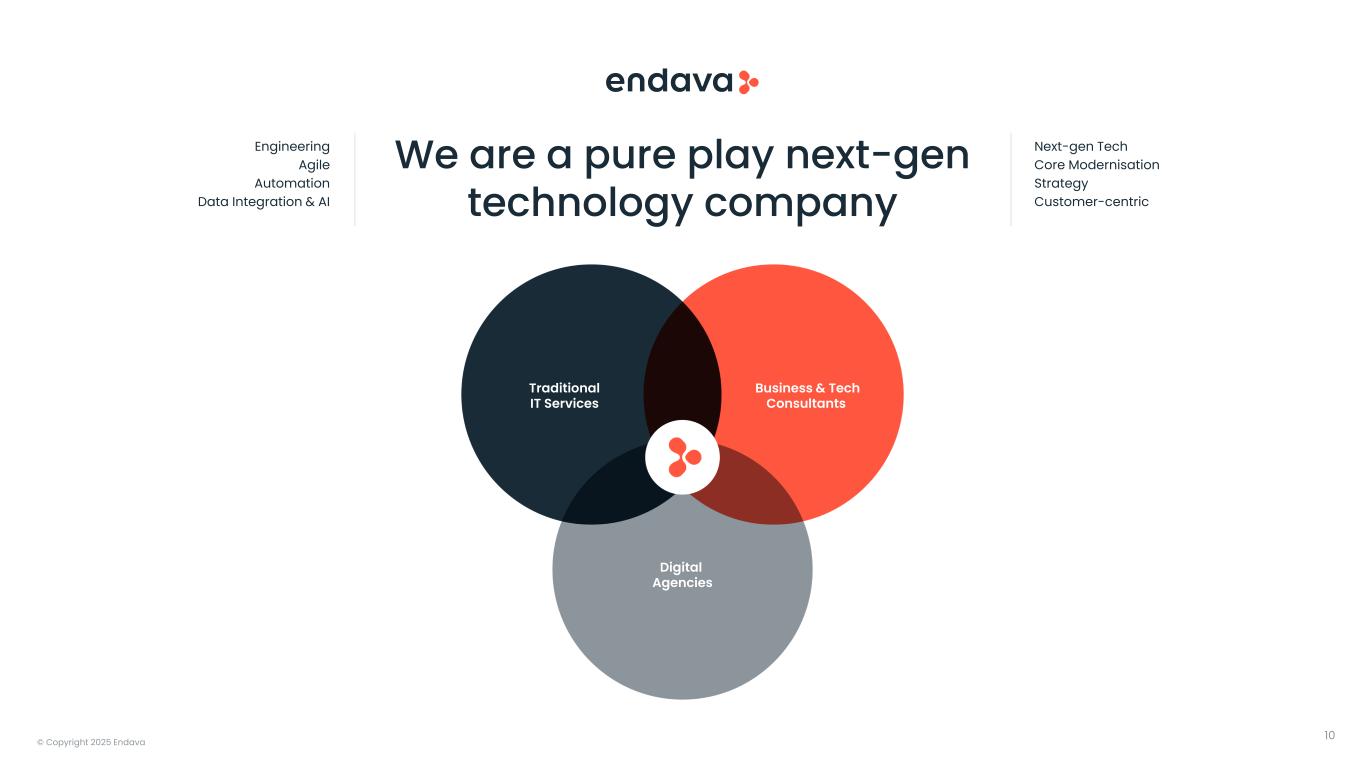
© Copyright 2025 Endava Next-gen Tech Core Modernisation Strategy Customer-centric Engineering Agile Automation Data Integration & AI Traditional IT Services Business & Tech Consultants Digital Agencies We are a pure play next-gen technology company 10
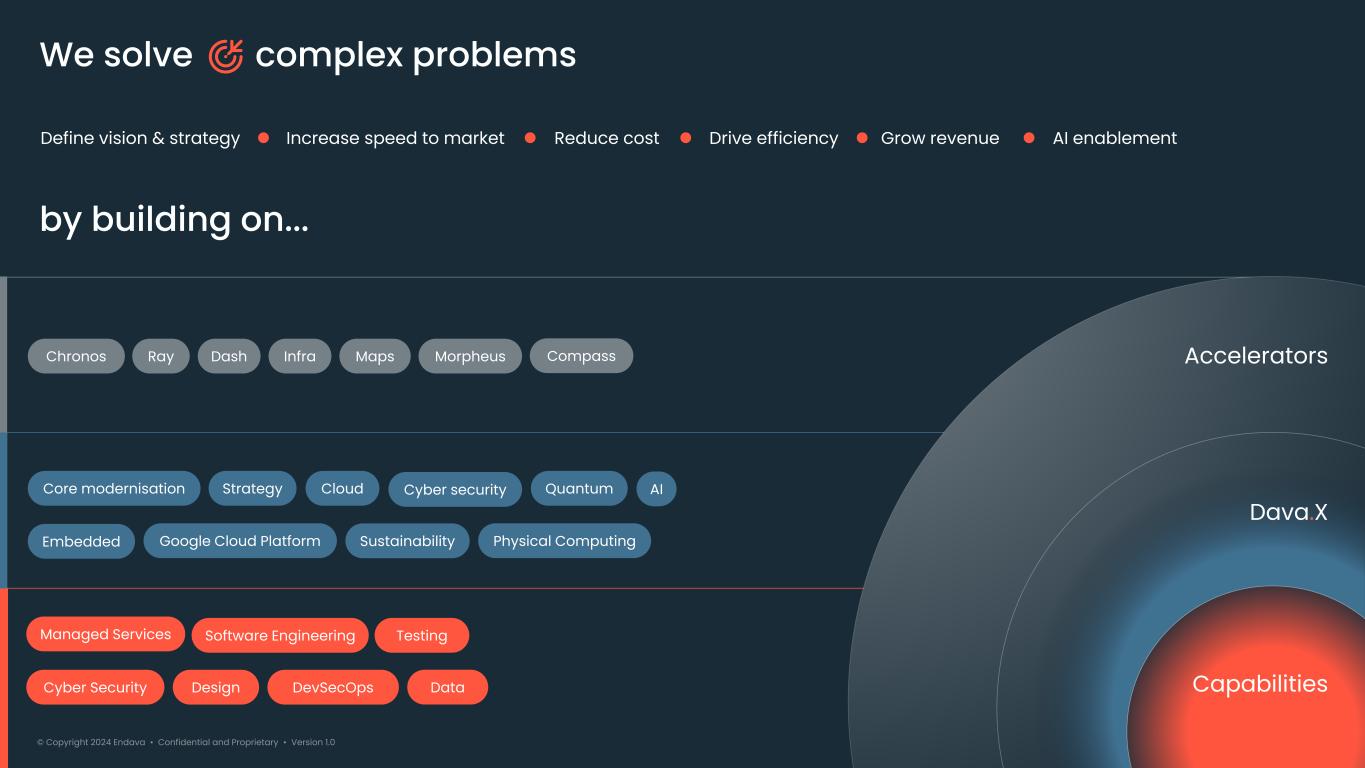
© Copyright 2024 Endava • Confidential and Proprietary • Version 1.0 Accelerators Dava.X Capabilities Managed Services DevSecOps Testing Cyber Security Software Engineering Design Data by building on... We solve complex problems Define vision & strategy Increase speed to market Drive efficiency Grow revenue AI enablementReduce cost Core modernisation Strategy Embedded Google Cloud Platform Sustainability Cloud AICyber security Physical Computing Quantum Chronos Ray Dash MorpheusInfra Maps Compass
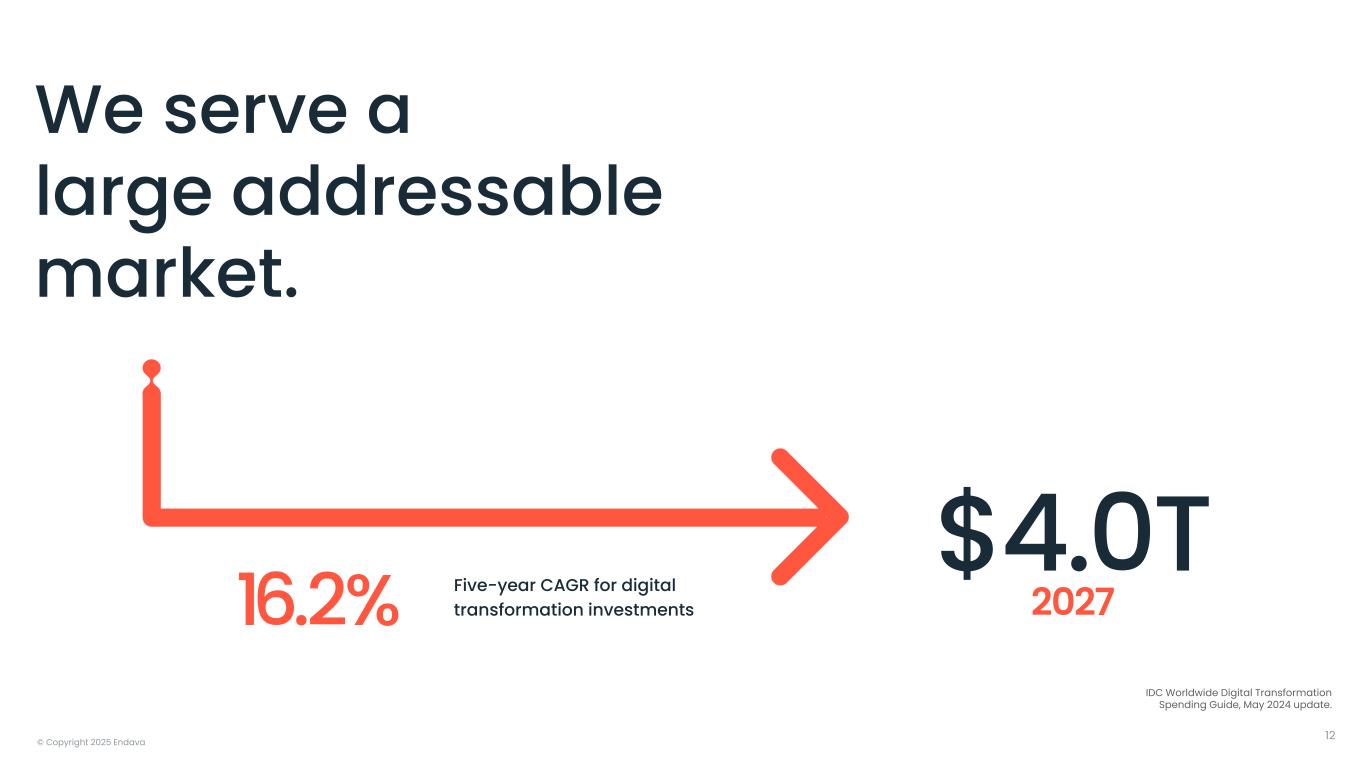
© Copyright 2025 Endava We serve a large addressable market. $4.0T 16.2% Five-year CAGR for digital transformation investments IDC Worldwide Digital Transformation Spending Guide, May 2024 update. 2027 12
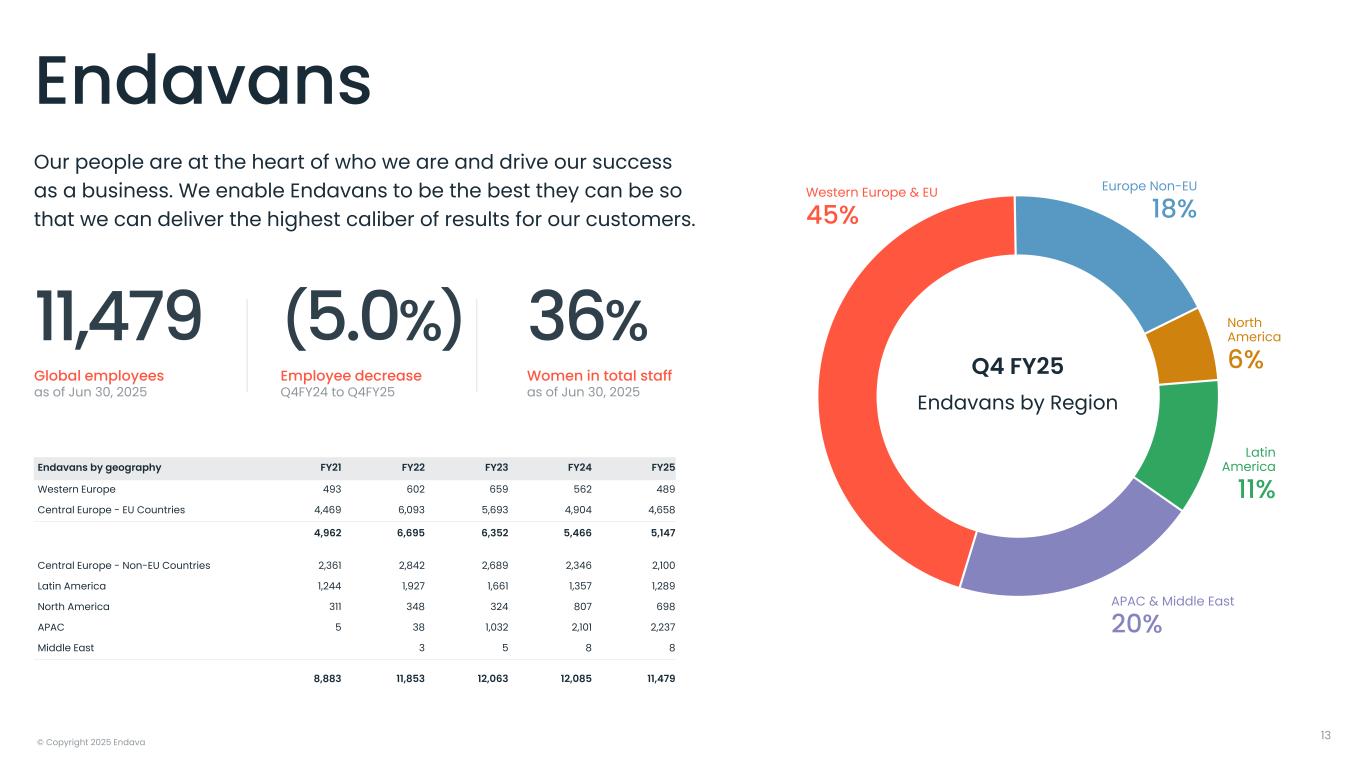
© Copyright 2025 Endava (5.0%) Employee decrease Q4FY24 to Q4FY25 11,479 Global employees as of Jun 30, 2025 36% Women in total staff as of Jun 30, 2025 Our people are at the heart of who we are and drive our success as a business. We enable Endavans to be the best they can be so that we can deliver the highest caliber of results for our customers. Western Europe & EU 45% Europe Non-EU 18% North America 6% Latin America 11% APAC & Middle East 20% Endavans 13 Endavans by geography FY21 FY22 FY23 FY24 FY25 Western Europe 493 602 659 562 489 Central Europe - EU Countries 4,469 6,093 5,693 4,904 4,658 4,962 6,695 6,352 5,466 5,147 Central Europe - Non-EU Countries 2,361 2,842 2,689 2,346 2,100 Latin America 1,244 1,927 1,661 1,357 1,289 North America 311 348 324 807 698 APAC 5 38 1,032 2,101 2,237 Middle East 3 5 8 8 8,883 11,853 12,063 12,085 11,479 Q4 FY25 Endavans by Region
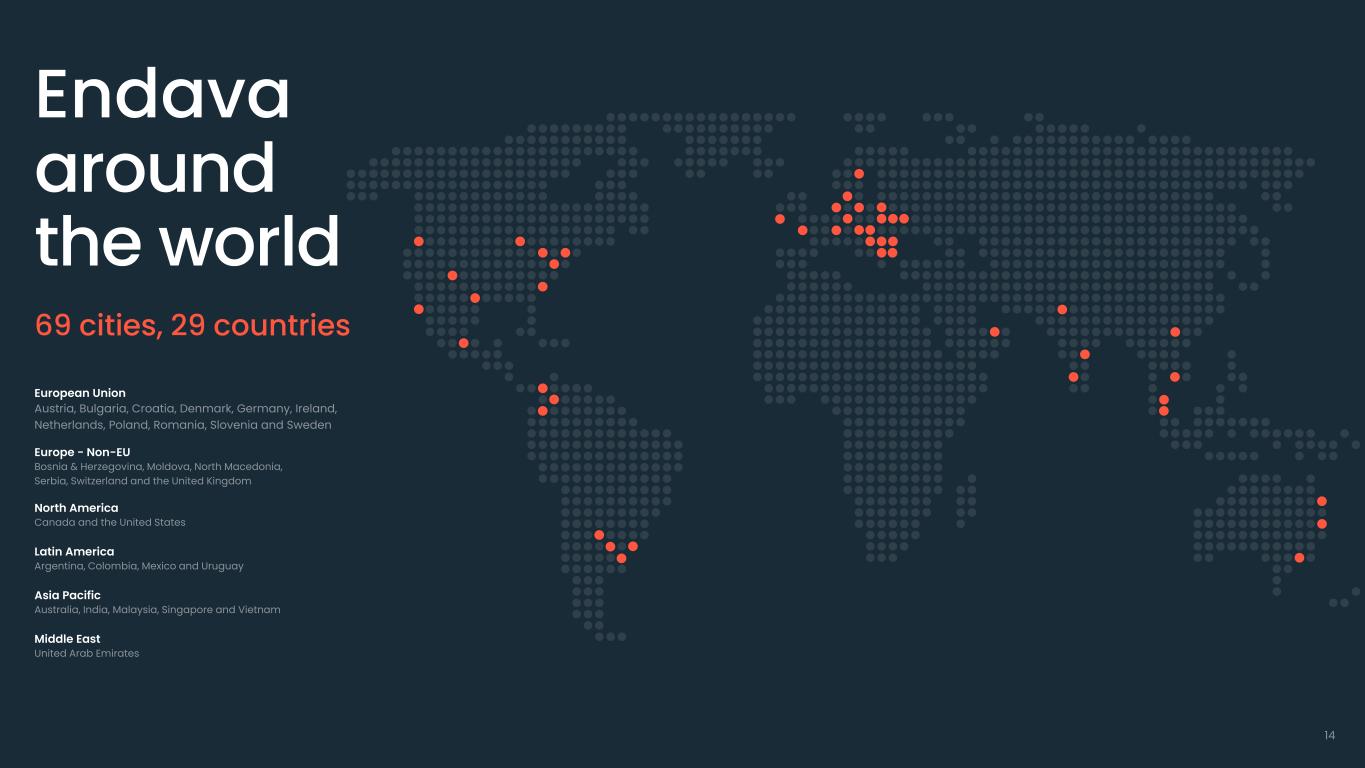
69 cities, 29 countries European Union Austria, Bulgaria, Croatia, Denmark, Germany, Ireland, Netherlands, Poland, Romania, Slovenia and Sweden Europe - Non-EU Bosnia & Herzegovina, Moldova, North Macedonia, Serbia, Switzerland and the United Kingdom North America Canada and the United States Latin America Argentina, Colombia, Mexico and Uruguay Asia Pacific Australia, India, Malaysia, Singapore and Vietnam Middle East United Arab Emirates Endava around the world 14
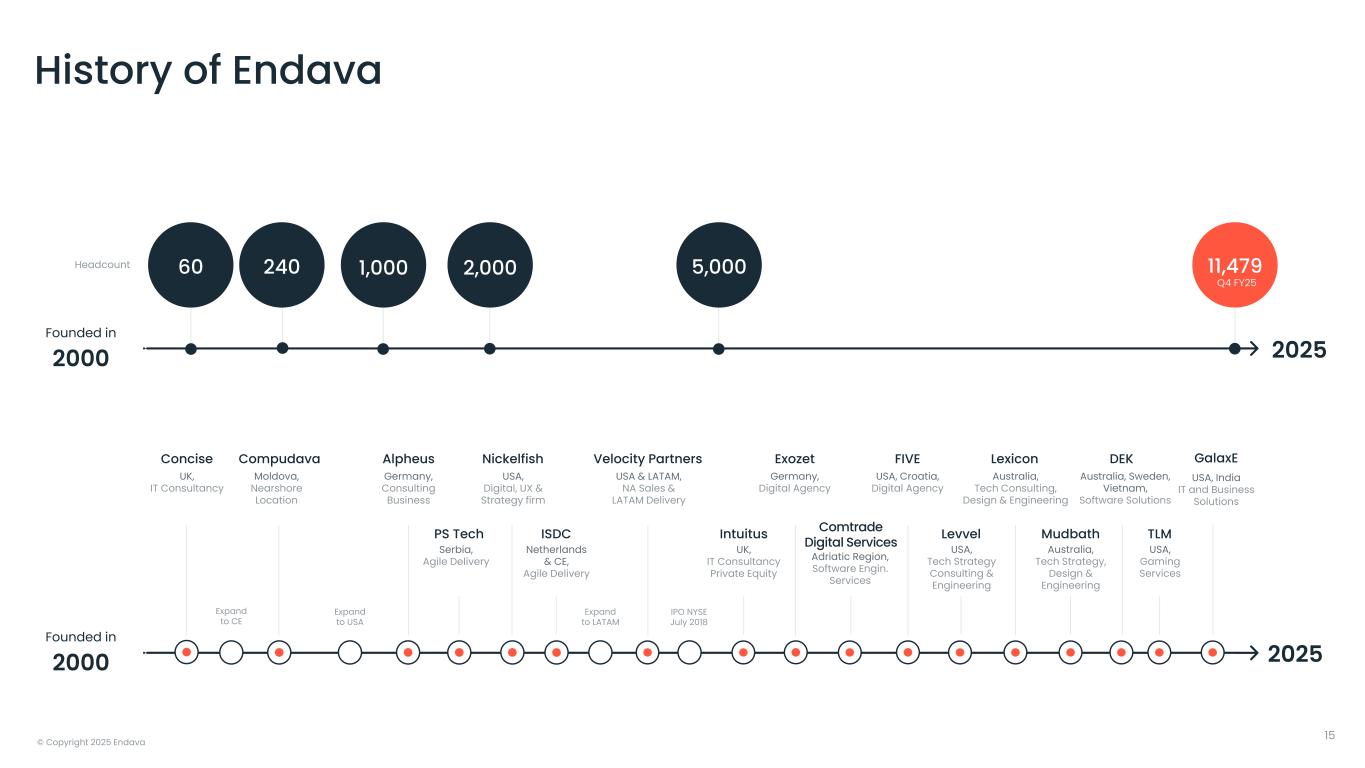
© Copyright 2025 Endava Founded in 2000 Expand to CE Concise UK, IT Consultancy Expand to USA Expand to LATAM IPO NYSE July 2018 Compudava Moldova, Nearshore Location Alpheus Germany, Consulting Business Nickelfish USA, Digital, UX & Strategy firm Velocity Partners USA & LATAM, NA Sales & LATAM Delivery PS Tech Serbia, Agile Delivery ISDC Netherlands & CE, Agile Delivery Intuitus UK, IT Consultancy Private Equity Exozet Germany, Digital Agency Comtrade Digital Services Adriatic Region, Software Engin. Services FIVE USA, Croatia, Digital Agency Levvel USA, Tech Strategy Consulting & Engineering Lexicon Australia, Tech Consulting, Design & Engineering Mudbath Australia, Tech Strategy, Design & Engineering Australia, Sweden, Vietnam, Software Solutions DEK TLM USA, Gaming Services 2025 11,479 Founded in 2000 60 240 1,000 2,000Headcount Q4 FY25 5,000 2025 GalaxE USA, India IT and Business Solutions 15 History of Endava
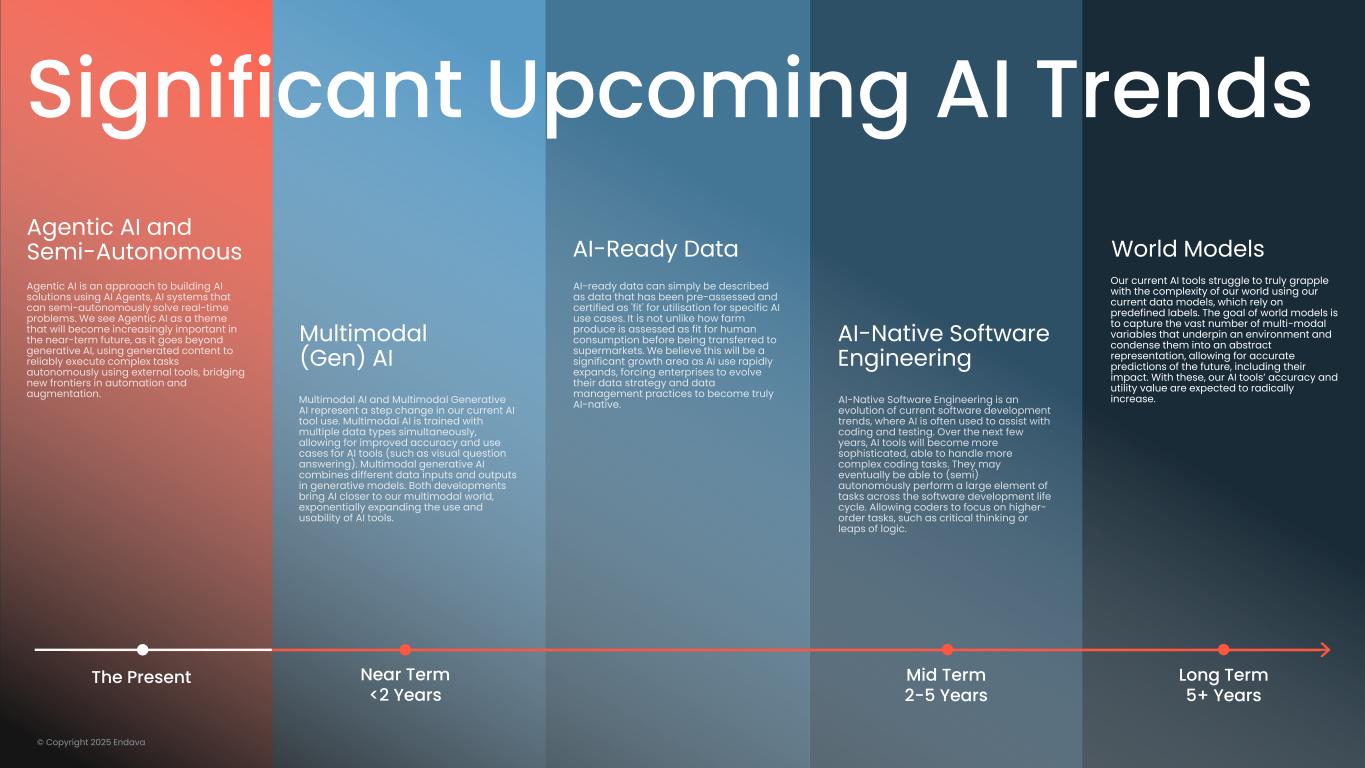
© Copyright 2025 Endava Significant Upcoming AI Trends The Present Near Term <2 Years Mid Term 2-5 Years Long Term 5+ Years Agentic AI and Semi-Autonomous Multimodal (Gen) AI AI-Ready Data AI-Native Software Engineering World Models Our current AI tools struggle to truly grapple with the complexity of our world using our current data models, which rely on predefined labels. The goal of world models is to capture the vast number of multi-modal variables that underpin an environment and condense them into an abstract representation, allowing for accurate predictions of the future, including their impact. With these, our AI tools’ accuracy and utility value are expected to radically increase.
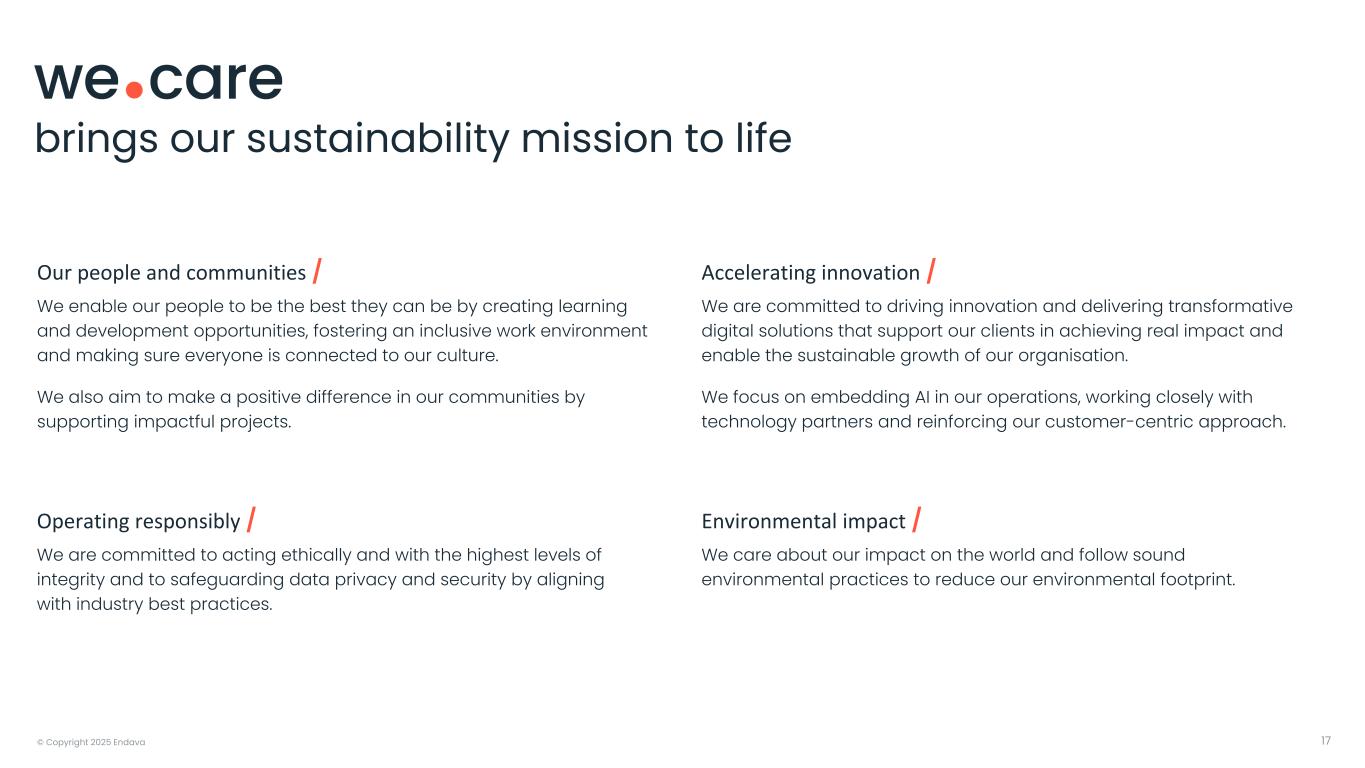
© Copyright 2025 Endava 17 Our people and communities / We enable our people to be the best they can be by creating learning and development opportunities, fostering an inclusive work environment and making sure everyone is connected to our culture. We also aim to make a positive difference in our communities by supporting impactful projects. brings our sustainability mission to life Operating responsibly / We are committed to acting ethically and with the highest levels of integrity and to safeguarding data privacy and security by aligning with industry best practices. Environmental impact / We care about our impact on the world and follow sound environmental practices to reduce our environmental footprint. Accelerating innovation / We are committed to driving innovation and delivering transformative digital solutions that support our clients in achieving real impact and enable the sustainable growth of our organisation. We focus on embedding AI in our operations, working closely with technology partners and reinforcing our customer-centric approach.

18 Financials02
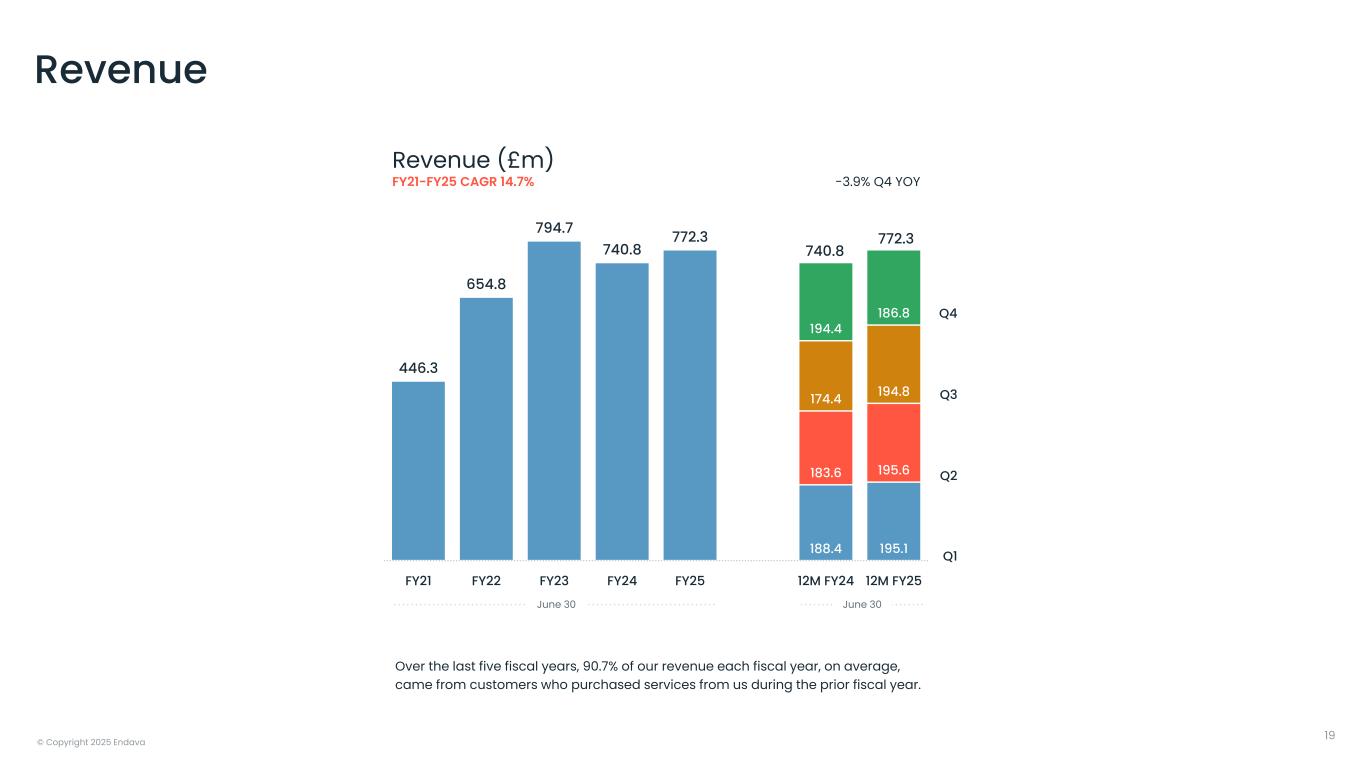
© Copyright 2025 Endava 188.4 195.1 183.6 195.6 174.4 194.8 194.4 186.8 446.3 654.8 794.7 740.8 772.3 740.8 772.3 FY21 FY22 FY23 FY24 FY25 12M FY24 12M FY25 FY21-FY25 CAGR 14.7% Over the last five fiscal years, 90.7% of our revenue each fiscal year, on average, came from customers who purchased services from us during the prior fiscal year. -3.9% Q4 YOY Revenue (£m) Q1 Q3 Q4 Revenue June 30 June 30 19 Q2
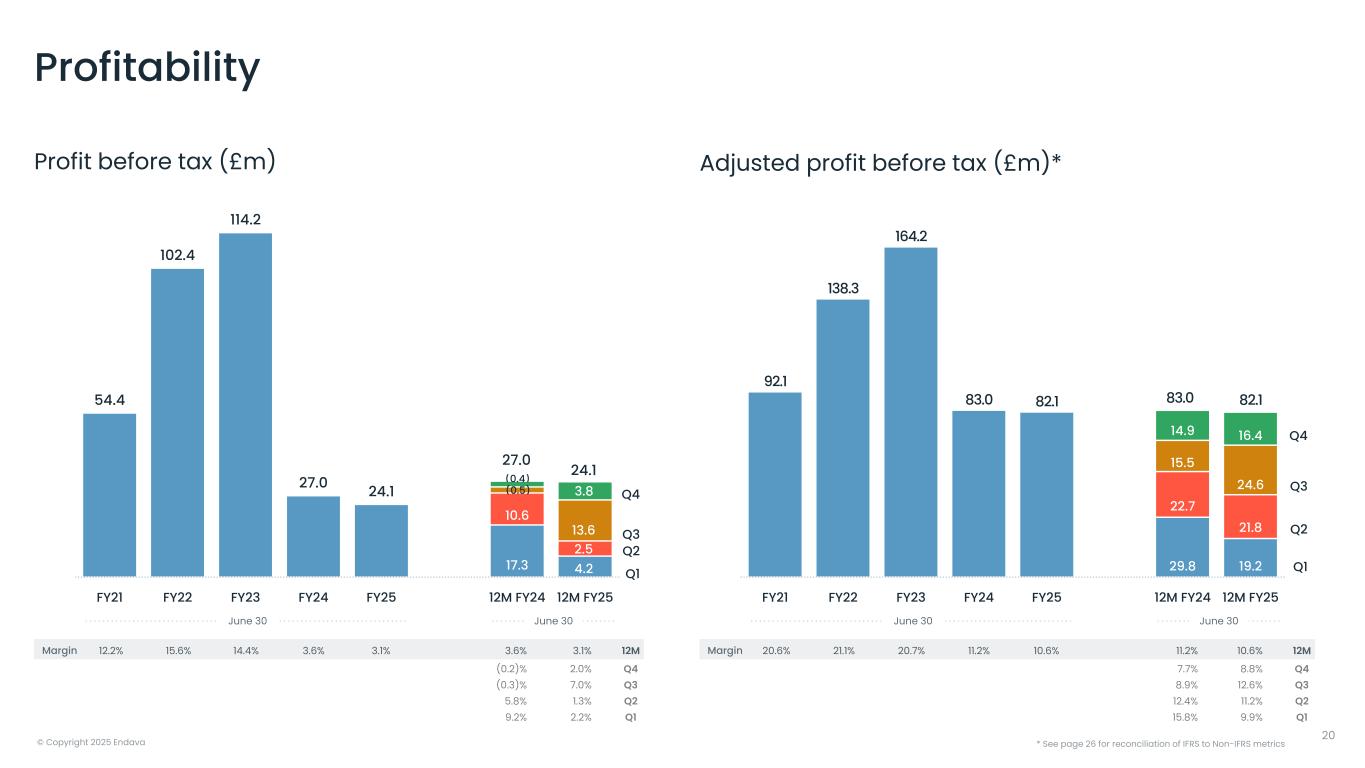
© Copyright 2025 Endava 17.3 4.2 10.6 2.5 13.6 (0.5) (0.4) 3.8 54.4 102.4 114.2 27.0 24.1 27.0 24.1 FY21 FY22 FY23 FY24 FY25 12M FY24 12M FY25 Profit before tax (£m) Q2 Q3 Q4 Profitability June 30 June 30 Margin 29.8 19.2 22.7 21.8 15.5 24.6 14.9 16.4 92.1 138.3 164.2 83.0 82.1 83.0 82.1 FY21 FY22 FY23 FY24 FY25 12M FY24 12M FY25 Adjusted profit before tax (£m)* Q1 Q3 Q4 June 30 June 30 Margin * See page 26 for reconciliation of IFRS to Non-IFRS metrics 20 Q2 Q1
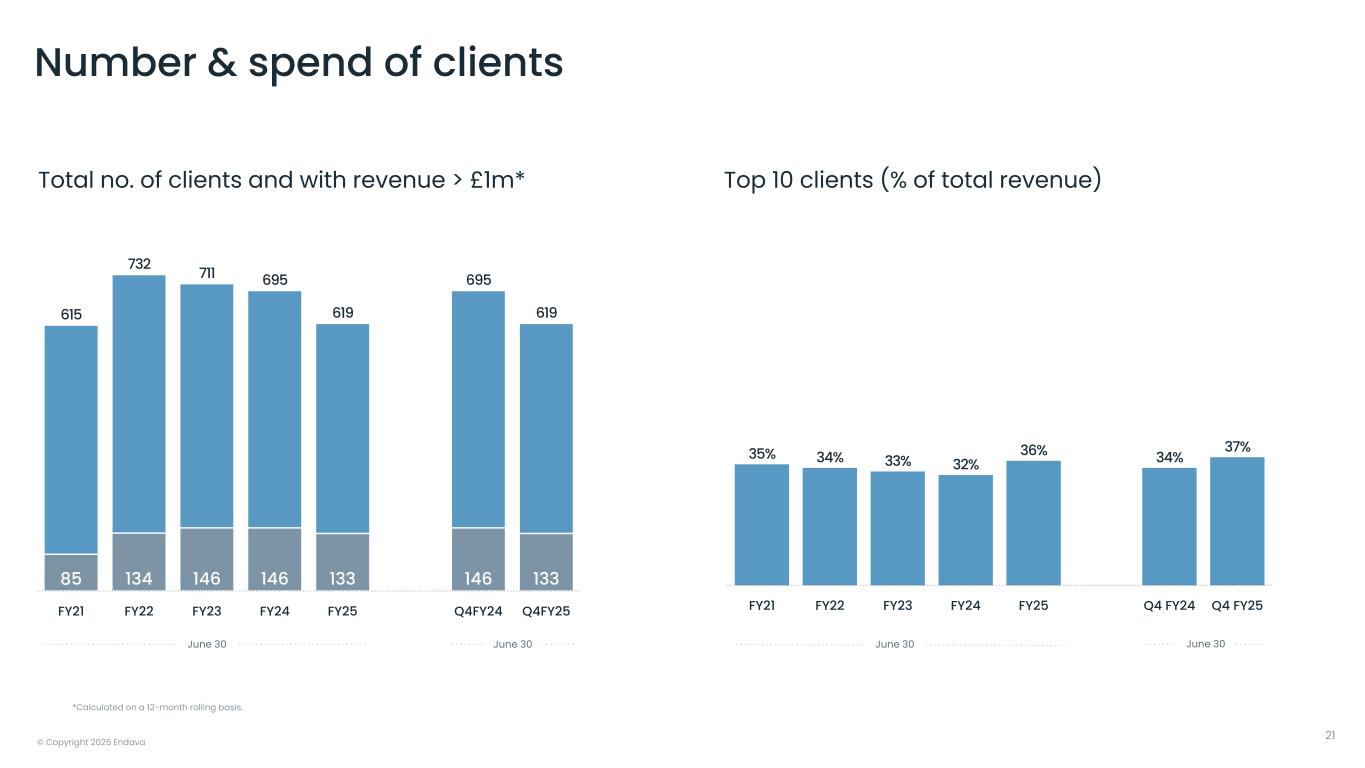
© Copyright 2025 Endava 35% 34% 33% 32% 36% 34% 37% FY21 FY22 FY23 FY24 FY25 Q4 FY24 Q4 FY25 85 134 146 146 133 146 133 615 732 711 695 619 695 619 FY21 FY22 FY23 FY24 FY25 Q4FY24 Q4FY25 Total no. of clients and with revenue > £1m* June 30 June 30June 30 June 30 Top 10 clients (% of total revenue) Number & spend of clients 21 *Calculated on a 12-month rolling basis.
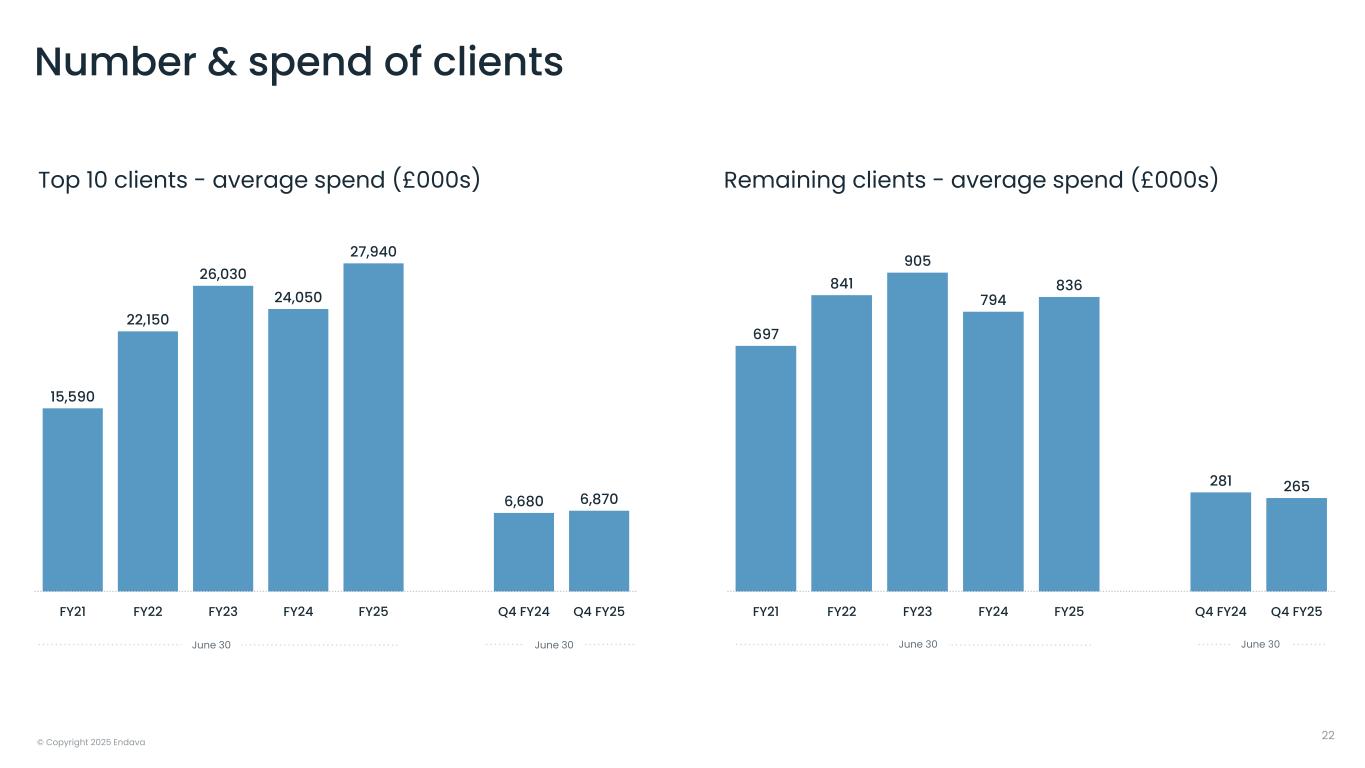
© Copyright 2025 Endava 15,590 22,150 26,030 24,050 27,940 6,680 6,870 FY21 FY22 FY23 FY24 FY25 Q4 FY24 Q4 FY25 22 Top 10 clients - average spend (£000s) 697 841 905 794 836 281 265 FY21 FY22 FY23 FY24 FY25 Q4 FY24 Q4 FY25 June 30 June 30June 30 June 30 Remaining clients - average spend (£000s) Number & spend of clients
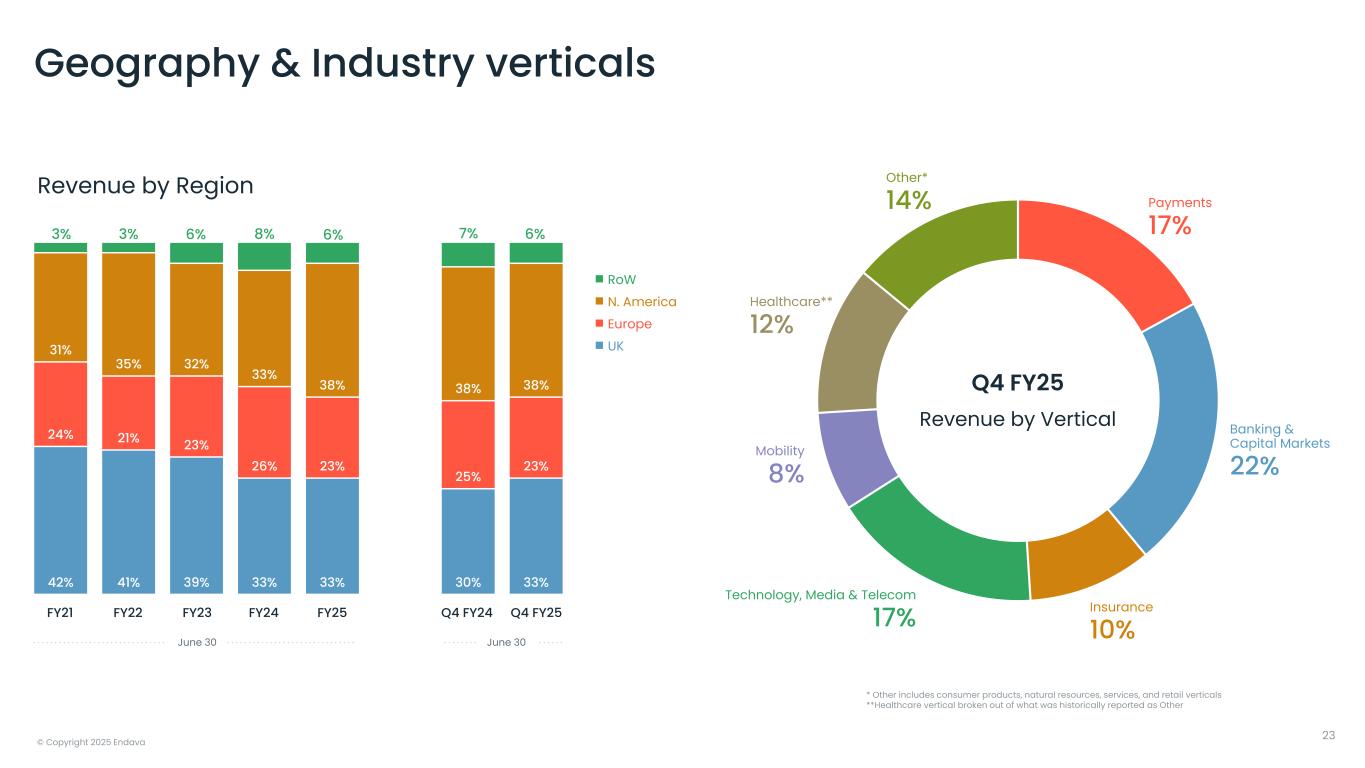
© Copyright 2025 Endava 42% 41% 39% 33% 33% 30% 33% 24% 21% 23% 26% 23% 25% 23% 31% 35% 32% 33% 38% 38% 38% 3% 3% 6% 8% 6% 7% 6% RoW N. America Europe UK * Other includes consumer products, natural resources, services, and retail verticals **Healthcare vertical broken out of what was historically reported as Other Payments 17% Banking & Capital Markets 22% Insurance 10% Technology, Media & Telecom 17% Mobility 8% Healthcare** 12% Other* 14% Geography & Industry verticals Q4 FY25 Revenue by Vertical FY21 June 30 Q4 FY24 Q4 FY25FY22 FY23 FY24 FY25 June 30 Revenue by Region 23
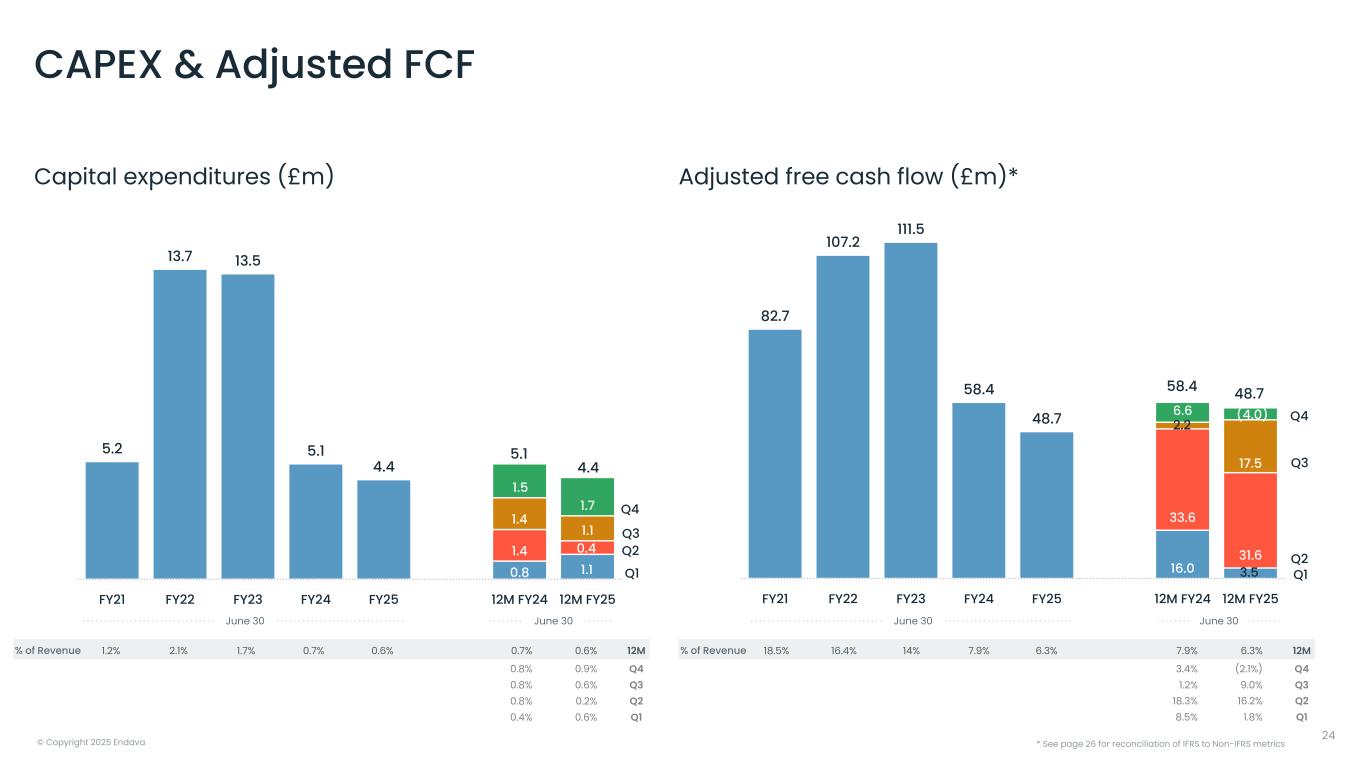
© Copyright 2025 Endava 0.8 1.1 1.4 0.4 1.4 1.1 5.2 13.7 13.5 5.1 4.4 5.1 4.4 1.5 1.7 FY21 FY22 FY23 FY24 FY25 12M FY24 12M FY25 Capital expenditures (£m) Q2 Q3 Q4 CAPEX & Adjusted FCF June 30 June 30 % of Revenue 16.0 3.5 33.6 31.6 2.2 17.5 82.7 107.2 111.5 58.4 48.7 58.4 48.7 6.6 (4.0) FY21 FY22 FY23 FY24 FY25 12M FY24 12M FY25 Q4 Adjusted free cash flow (£m)* Q1 Q3 June 30 June 30 * See page 26 for reconciliation of IFRS to Non-IFRS metrics % of Revenue 24 Q1 Q2

25 Appendix03
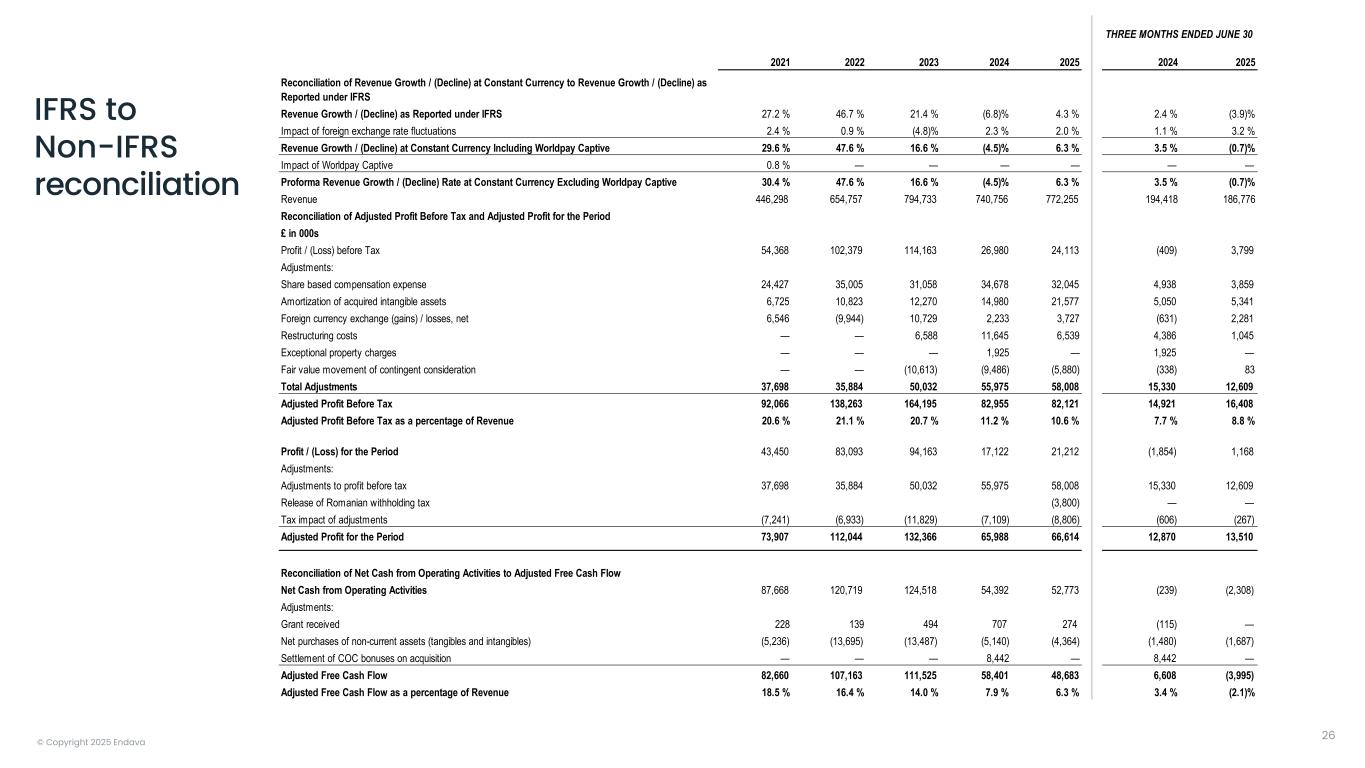
© Copyright 2025 Endava IFRS to Non-IFRS reconciliation 26 2021 2022 2023 2024 2025 2024 2025 Reconciliation of Revenue Growth / (Decline) at Constant Currency to Revenue Growth / (Decline) as Reported under IFRS Revenue Growth / (Decline) as Reported under IFRS 27.2 % 46.7 % 21.4 % (6.8)% 4.3 % 2.4 % (3.9)% Impact of foreign exchange rate fluctuations 2.4 % 0.9 % (4.8)% 2.3 % 2.0 % 1.1 % 3.2 % Revenue Growth / (Decline) at Constant Currency Including Worldpay Captive 29.6 % 47.6 % 16.6 % (4.5)% 6.3 % 3.5 % (0.7)% Impact of Worldpay Captive 0.8 % — — — — — — Proforma Revenue Growth / (Decline) Rate at Constant Currency Excluding Worldpay Captive 30.4 % 47.6 % 16.6 % (4.5)% 6.3 % 3.5 % (0.7)% Revenue 446,298 654,757 794,733 740,756 772,255 194,418 186,776 Reconciliation of Adjusted Profit Before Tax and Adjusted Profit for the Period £ in 000s Profit / (Loss) before Tax 54,368 102,379 114,163 26,980 24,113 (409) 3,799 Adjustments: Share based compensation expense 24,427 35,005 31,058 34,678 32,045 4,938 3,859 Amortization of acquired intangible assets 6,725 10,823 12,270 14,980 21,577 5,050 5,341 Foreign currency exchange (gains) / losses, net 6,546 (9,944) 10,729 2,233 3,727 (631) 2,281 Restructuring costs — — 6,588 11,645 6,539 4,386 1,045 Exceptional property charges — — — 1,925 — 1,925 — Fair value movement of contingent consideration — — (10,613) (9,486) (5,880) (338) 83 Total Adjustments 37,698 35,884 50,032 55,975 58,008 15,330 12,609 Adjusted Profit Before Tax 92,066 138,263 164,195 82,955 82,121 14,921 16,408 Adjusted Profit Before Tax as a percentage of Revenue 20.6 % 21.1 % 20.7 % 11.2 % 10.6 % 7.7 % 8.8 % Profit / (Loss) for the Period 43,450 83,093 94,163 17,122 21,212 (1,854) 1,168 Adjustments: Adjustments to profit before tax 37,698 35,884 50,032 55,975 58,008 15,330 12,609 Release of Romanian withholding tax (3,800) — — Tax impact of adjustments (7,241) (6,933) (11,829) (7,109) (8,806) (606) (267) Adjusted Profit for the Period 73,907 112,044 132,366 65,988 66,614 12,870 13,510 Reconciliation of Net Cash from Operating Activities to Adjusted Free Cash Flow Net Cash from Operating Activities 87,668 120,719 124,518 54,392 52,773 (239) (2,308) Adjustments: Grant received 228 139 494 707 274 (115) — Net purchases of non-current assets (tangibles and intangibles) (5,236) (13,695) (13,487) (5,140) (4,364) (1,480) (1,687) Settlement of COC bonuses on acquisition — — — 8,442 — 8,442 — Adjusted Free Cash Flow 82,660 107,163 111,525 58,401 48,683 6,608 (3,995) Adjusted Free Cash Flow as a percentage of Revenue 18.5 % 16.4 % 14.0 % 7.9 % 6.3 % 3.4 % (2.1)% THREE MONTHS ENDED JUNE 30
© Copyright 2025 Endava